Week-4 Challenge WOT Condition Part-2
WOT CONDITION PART -2
1) What is difference between mapped and dynamic model of engine, motor and generator?
How can you change model type?
solution:
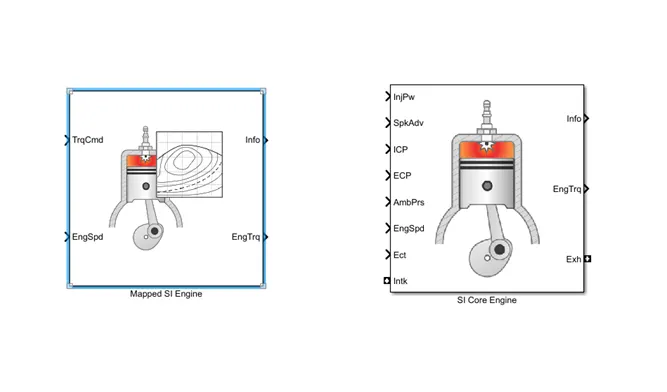
Powertrain Blockset provides two types of combustion engine models: mapped and dynamic.
Mapped engines represent macro engine behaviour as a set of lookup tables (brake torque, fuel flow, air mass flow, exhaust temperature, efficiency, and emissions) as functions of commanded load and measured engine speed.
Mapped engine models are suitable for analysis and design activities that do not require engine subsystem dynamic characteristics, for example, in engine and transmission powertrain matching analysis for fuel economy, emissions, and performance tradeoffs.
Dynamic engines decompose engine behaviour into individual component models that account for engine dynamics, most notably intake airflow and turbocharger dynamics.
Dynamic engine models are suitable for designing control, estimator, and diagnostic algorithms that depend on dynamic subsystem states, for example, in closed-loop AFR control algorithm development.
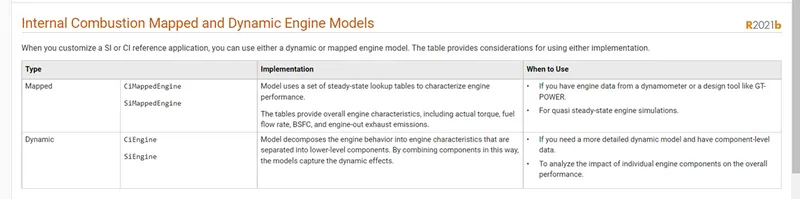
Above image shows the difference mentioned by MATLAB documentation between mapped & dynamic model.
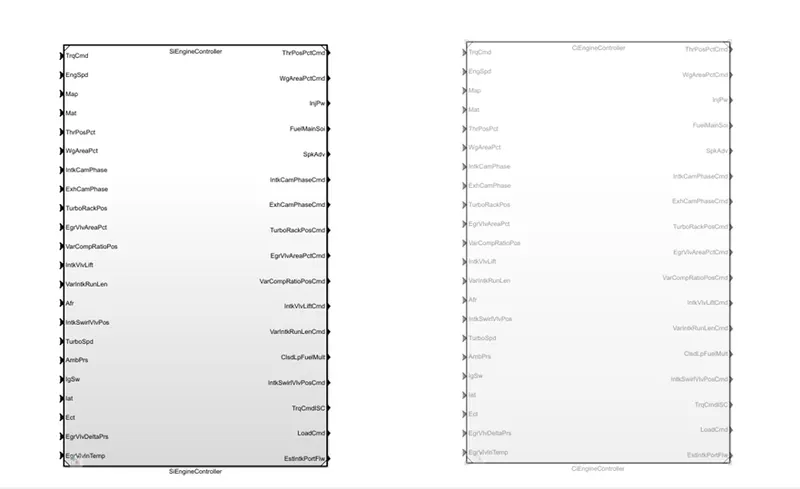
In powertrain Blockset in HEV file, controller block set is shown.
In which mapped and dynamic controller SI engine is showed.
Si mapped engine is used, while dynamic model is commented out.
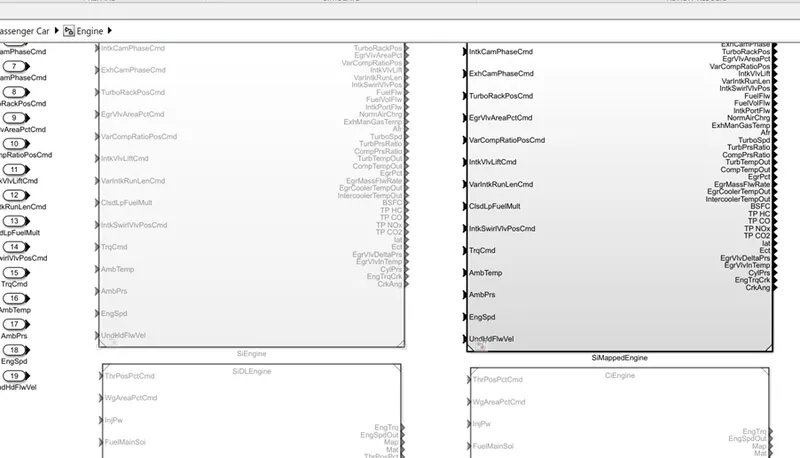
How can you change model type?
Solution:
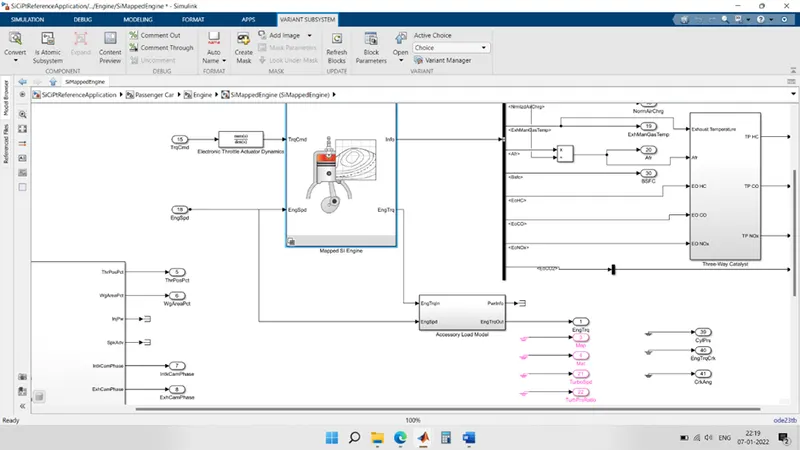
As shown in image below, mapped SI engine is shown.
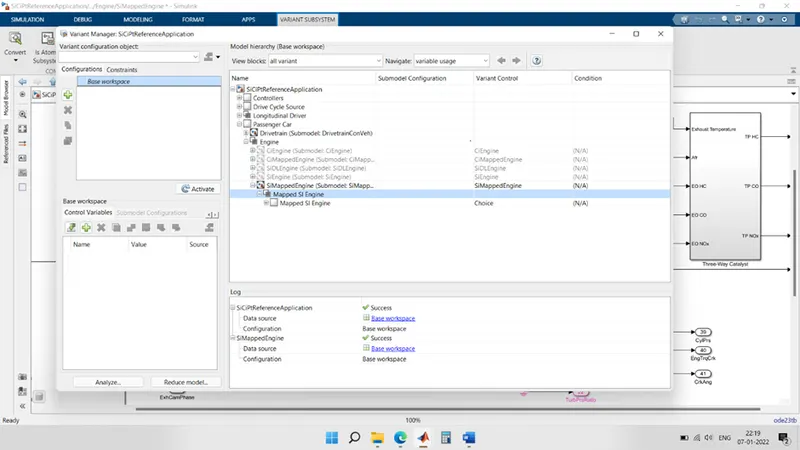
In that, is shown that mapped SI engine is changed to dynamic model
On top of screen with red markings it is shown that how to change the model from mapped to dynamic using variants option.
As shown above, the dialogue box will open after choosing variants option.
Similarly, mapped model is changed to dynamic model, and vice versa.
2) How does the model calculate miles per gallon?
Which factors are considered to model fuel flow?
Solution:
MPG, or miles per gallon, is the distance, measured in miles, that a car can travel per gallon of fuel.
MPG is also the primary measurement of a car's fuel efficiency:
The higher a car's MPG, the more fuel efficient it is.
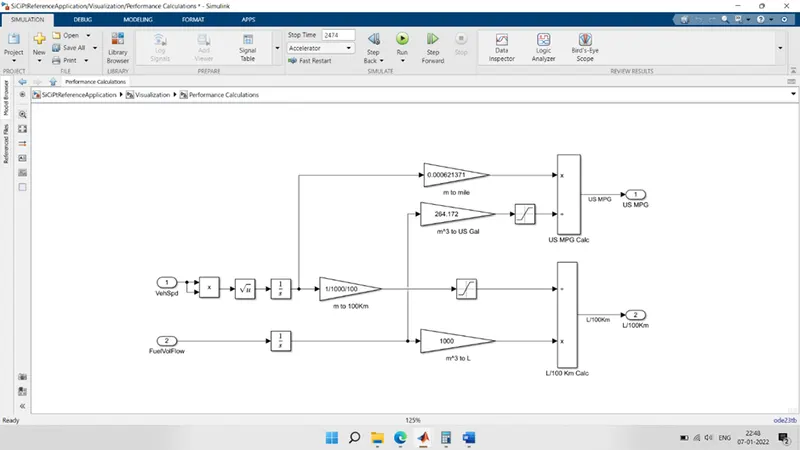
Now to calculate MPG of car, if vehicle speed is given as input, we can integrate the speed and calculate distance covered.
Now after distance is measured, we have to find fuel used to cover that distance.
As shown in model, m3 to us gallon gain block is used.
Using that how much litres of fuel is used that is estimated.
Now by calculating and dividing it by 1000, MPG is calculated.
Similarly for BATTERY,
Battery power is calculated in power, so we have to convert it to KWH.
Then converted to m3 using 0.00378541 gain block.
Then gallons is used, so again 264.172 gain is produced.
After that it is converted to km, and then used for comparison.
Finally, the distance measured & energy flows are calculated and they are divided to get results in MPG.
Which factors are considered to model fuel flow?
Pollution under control certified.
High calorific value.
Low polluting agent like ash, co2, etc…
4) Maintained Run the HEV reference Application with WOT drive cycle. Change the grade and wind velocity in the environment block. Comment on the results.
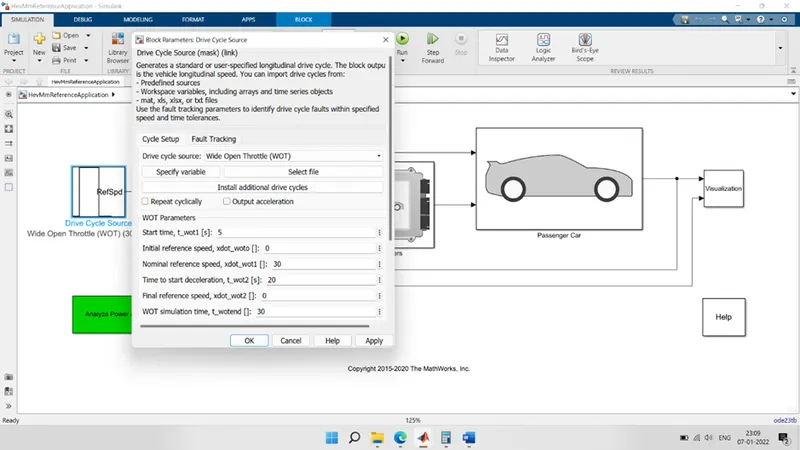
HEV reference application with WOT drive cycle is opened in Simulink.
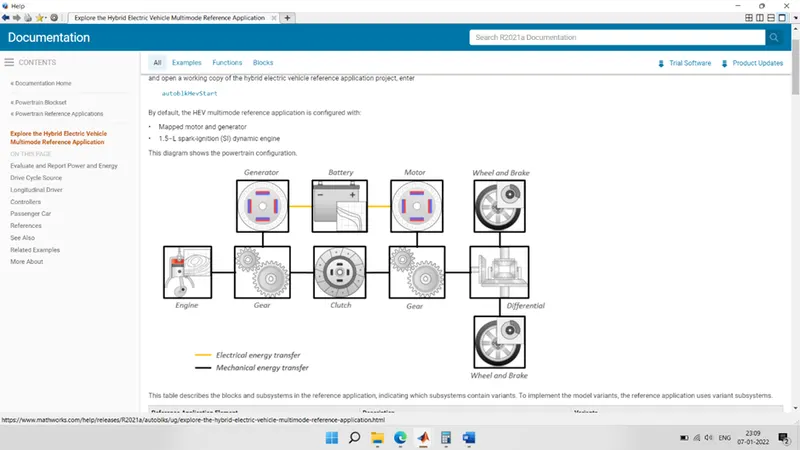
As given, using WOT as drive cycle.
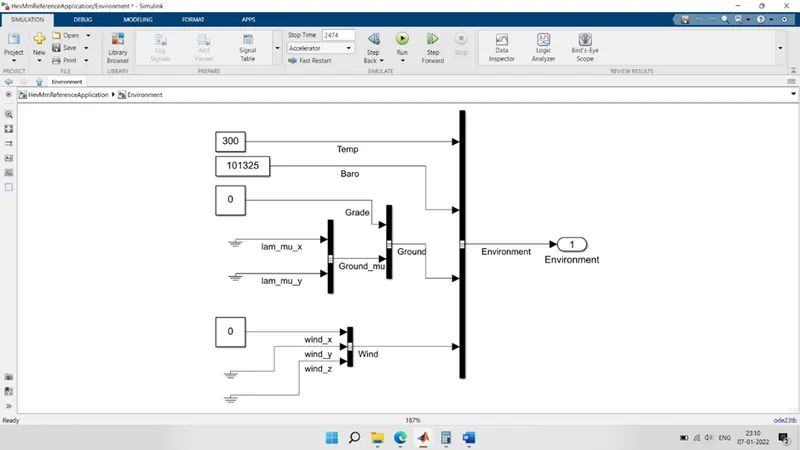
Initially simulating model with the default parameters of environment.
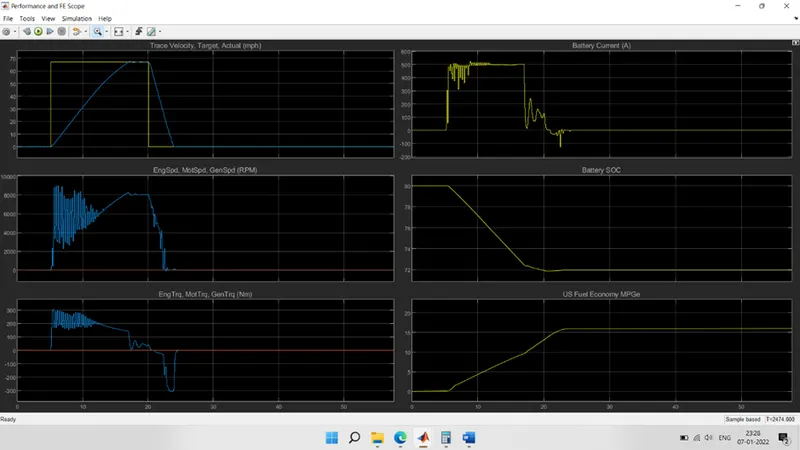
And the results are plotted below.
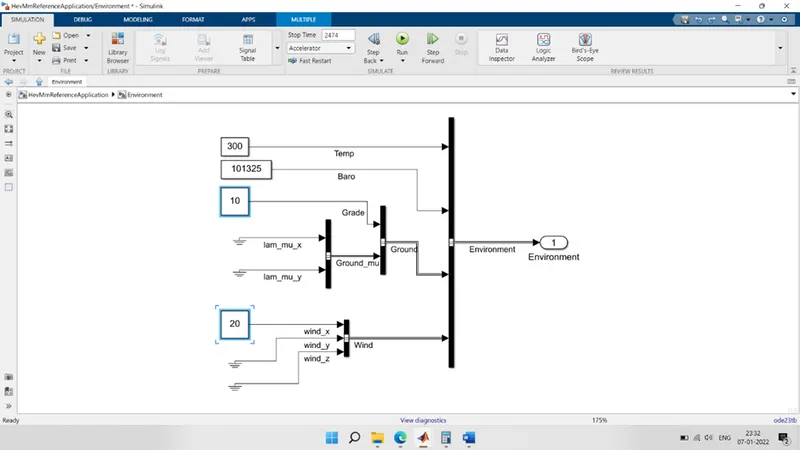
Now as per given data, to plot results of simulation after changing values of environment block.
Garde: 10
Wind: 20 m/s
Below shown is output result using that environment data.
Garde: 7
Wind: 28 m/s
Below shown is output result using that environment data.
Conclusion:
- Battery state of charge at end of wide open throttle is same, but during decrease in speed battery is charged due to regenerative braking & wind velocity is less when grade is also low.
- As wind loses are increase and grade is more, fuel consumption icreases.
- Due to increase in wind and grade, regenerative braking is reduced and battery charging is slower.
- Highest point of velocity s also shown less, due to more external forces.
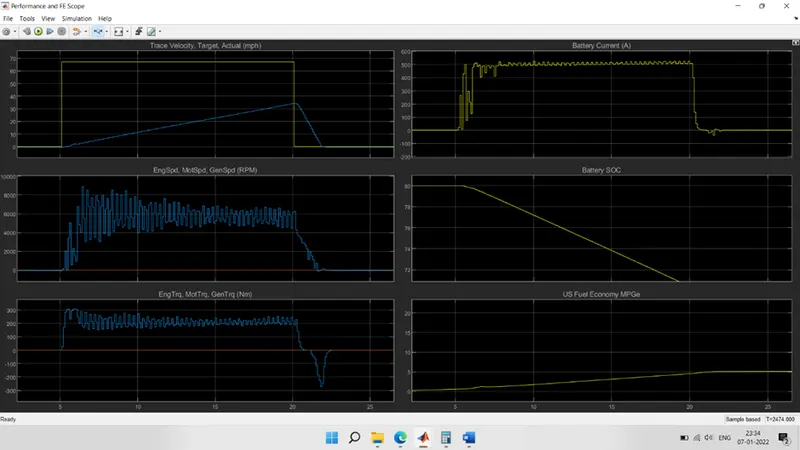
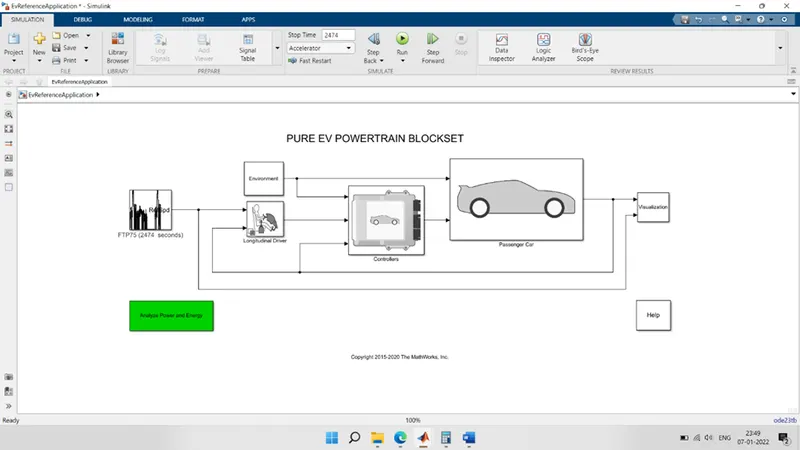
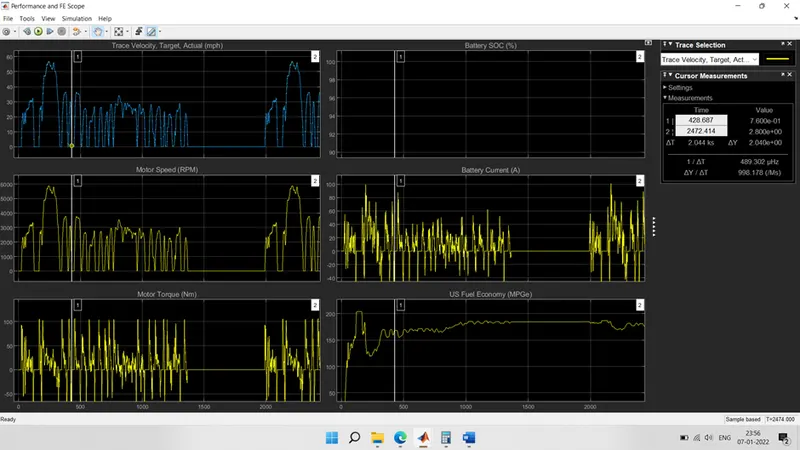
4) Keeping all other parameters same, compare the simulated results of hybrid & pure electric powertrains.
SIMULATION MODEL EXAMPLE OF EV POWERTRAIN MODEL
SIMULATION RESULTS FOR PURE EV POWERTRAIN MODEL.
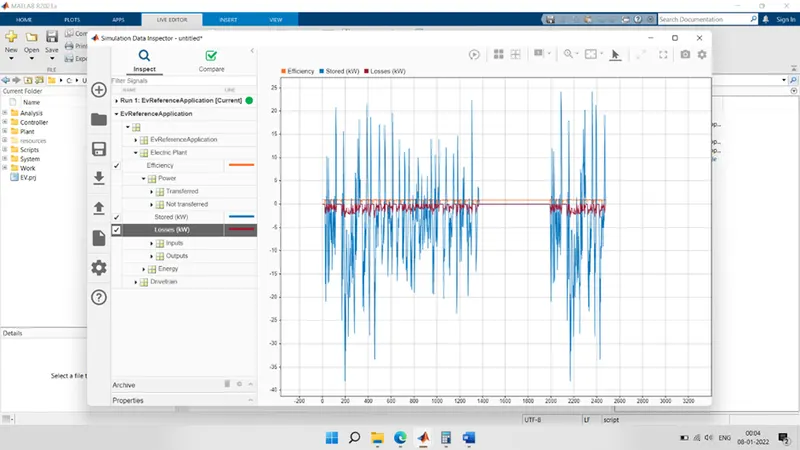
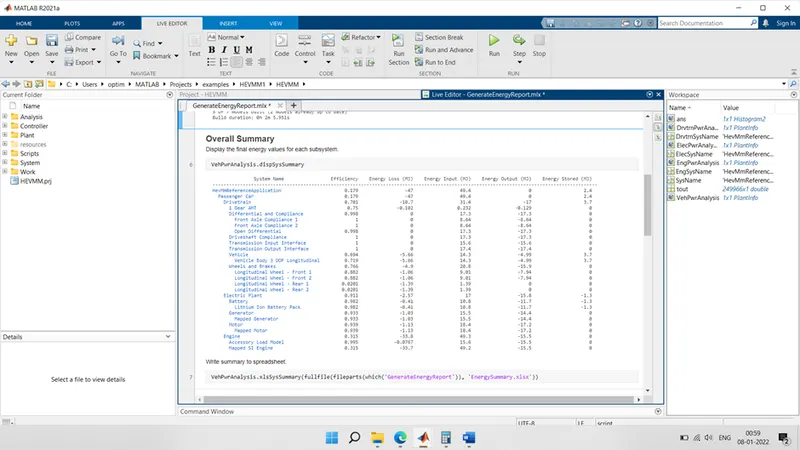
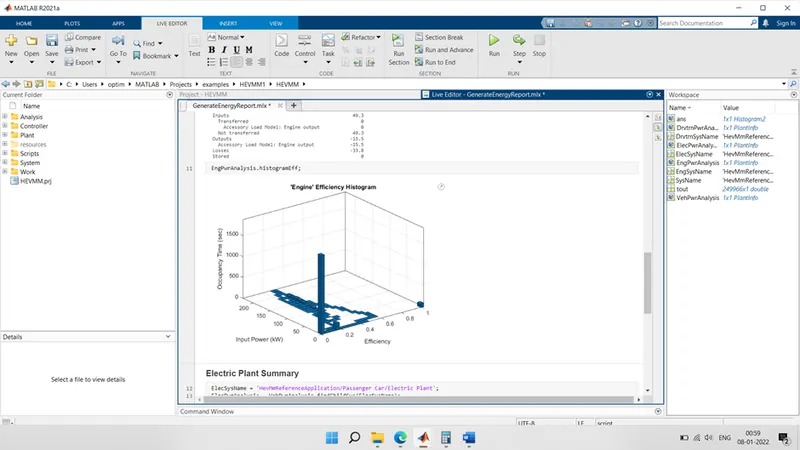
ANALYZE POWER AND ENERGY FOR PURE EV POWERTRAN BLOCK
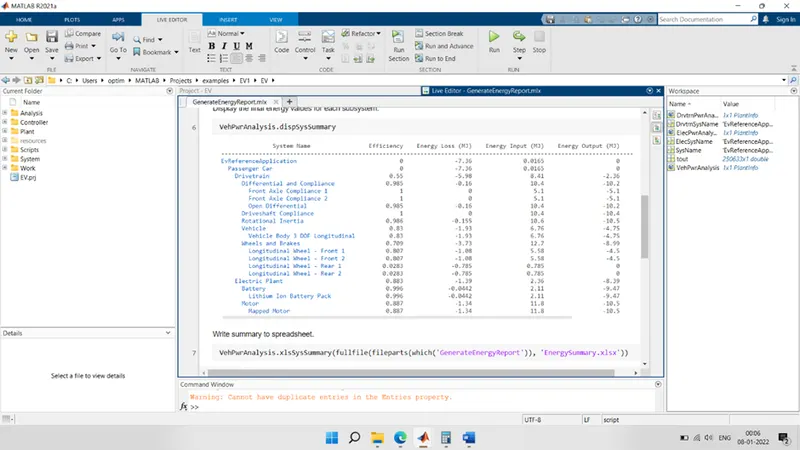
SIMULATION MODEL EXAMPLE OF HEV POWERTRAIN MODEL
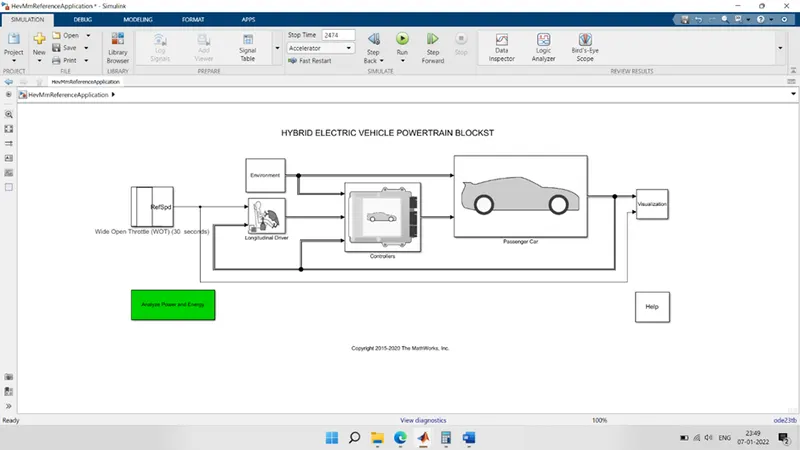
SIMULATION RESULTS FOR PURE EV POWERTRAIN MODEL.
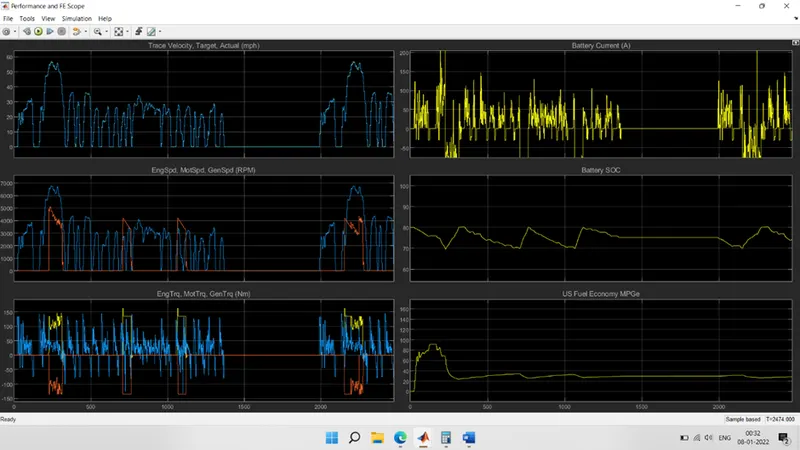
ANALYZE POWER AND ENERGY FOR PURE EV POWERTRAN BLOCK
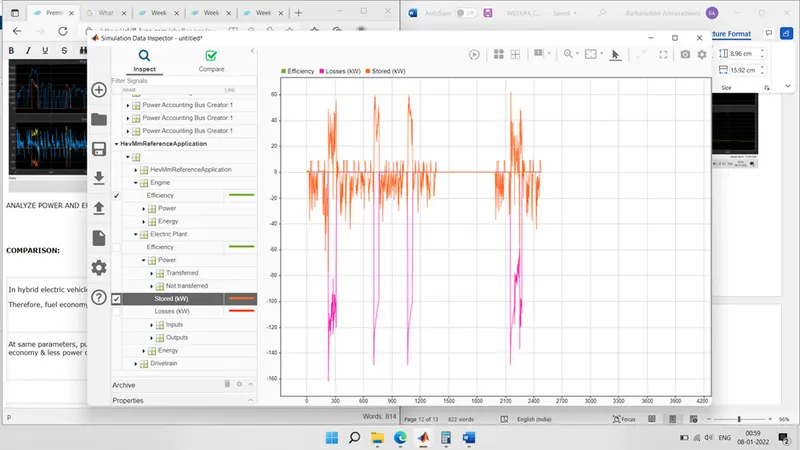
COMPARISON:
|
In hybrid electric vehicle the pollution damage is high. Therefore, fuel economy is low. |
|
At same parameters, pure EV has 0% pollution and highest fuel economy & less power consumption per KM. |
|
Drivetrain loss for pure EV is more |
|
Power loss for HEV is more |
|
In pure EV, lithium-ion battery is used, having high efficiency. |
|
In HEV, Ni-Mh is used, which has comparatively low efficiency |
|
Characteristics |
HEV |
PURE EV |
|
Motor speed |
8500 |
3800 |
|
Torque |
250Nm |
180Nm |
|
Battery current |
500A |
210A |
|
Soc% |
80-70 % |
80-77 5 |