Week-4 Challenge WOT Condition Part-2
1. What is the difference between mapped and dynamic model of engine, motor and generator? How can you change model type?
Mapped and dynamic model of engine, motor and generator
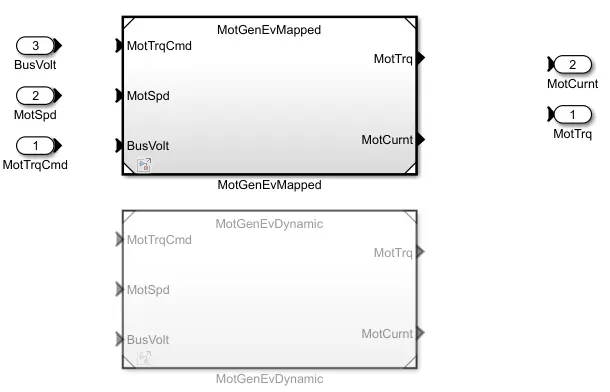
The difference between mapped and dynamic model of engine, motor and generator
|
Mapped Model |
Dynamic Model |
|
The Mapped Model is use pri defined data for operation and simulation, the data is to be entered by using lookup table or by using excel sheet. The input data configure with operational parts and proceed for analysis. |
The Dynamic Model is work as understanding the actual behaviour of the vehicle. It work with considering specified conditions which have enter in the model. The simulation done in real and dynamic condition. |
|
This model is also known as Global based model.Because of pri defined data the simulation become more easier to simulate. It need less time than dynamic for result. Result get in interrupted form. |
This is also known as Real time model. As per name it work on real time situations of vehicle. Where the situation are specified in designed model for simulation. |
|
More assumption need to be done for result. |
No need to create assumption for simulation. |
|
|
|
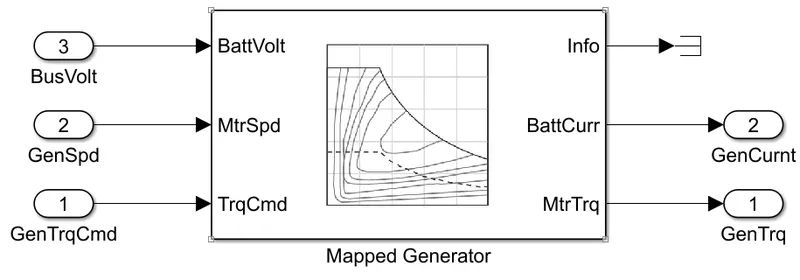
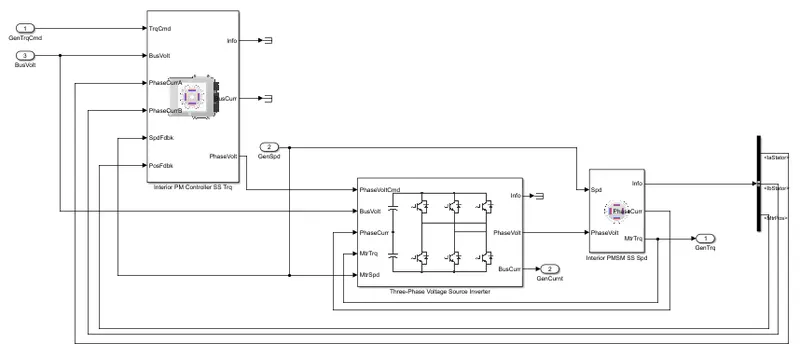
Effects on engine, motor and generat
|
Mapped |
Dynamic |
|
|
Engine |
The array of data is provided for simulation. The power, efficiency, engine power is to be measured with this data. |
The specification of engine is given at the time of designing the engine, all this specification are use for all calculation ang gives real time result. |
|
Motor |
The imaginary data for Motor rpm, efficiency, heat is given for the simulation. |
The provided manufacture specification is used for calculation. |
|
Generator |
The battery current, voltage, efficiency, all power rating is provided manually for simulation. |
All battery specification are used for simulation to know about battery performance. |
Change model type
- Open any block set, 'EV' either 'HEV' from powertrain block set.
- As the model open click on the 'passenger' block from selected blockset. Then select the 'electric plant' block.
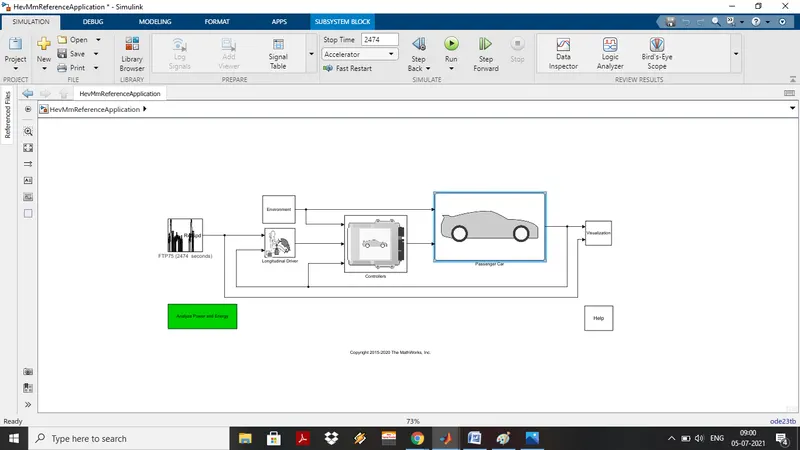
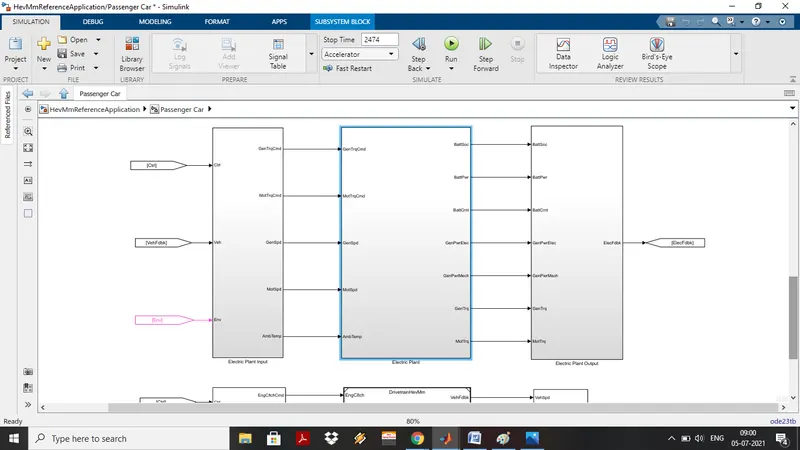
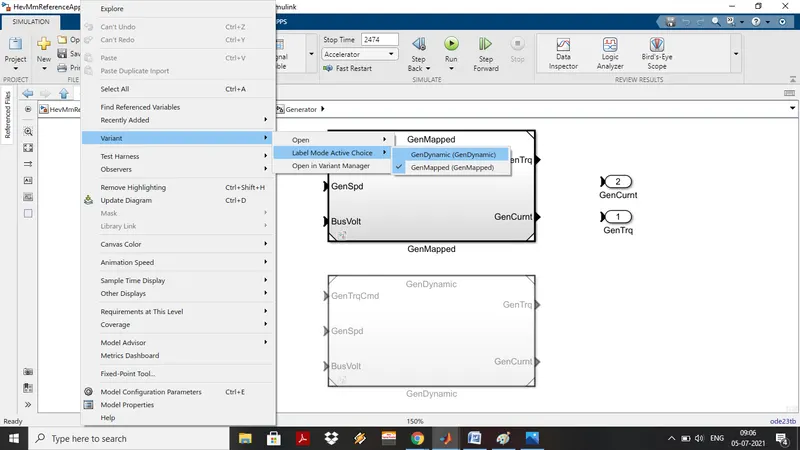
- After that there is block for generator and motor. Click on any block as it opens right click any where there is option 'varient' then 'label model Active choice' then there is both model are given select any one of them as per requirment.
2. How does the model calculate miles per gallon? Which factors are considered to model fuel flow?
- Miles per gallon is a US standerd of defining the fuel rating as how long vehicle can travel in a one gallon.
- In hybrid vehicle the engine power is dependent on such fuel efficiency.
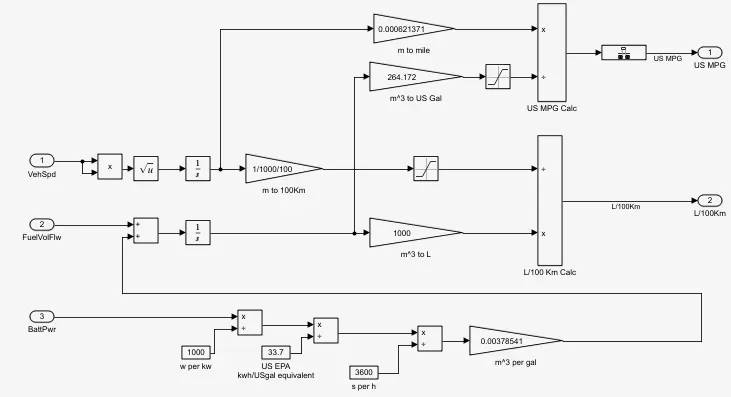
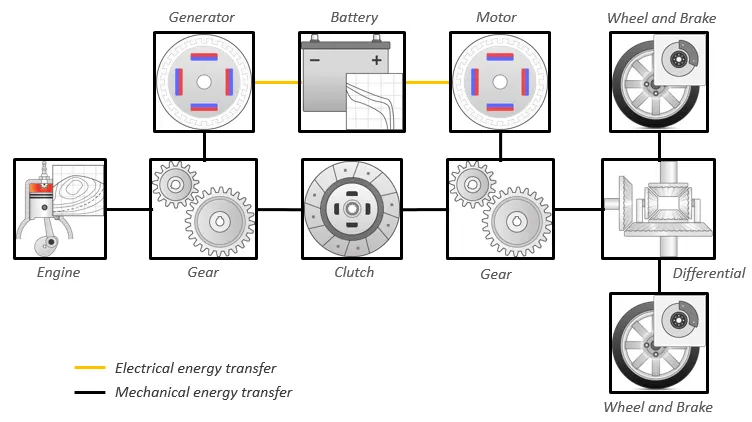
- The above blockset is of HEV. Where the inputs are vehicle speed, Fuel flow, Battrey power.
Factors are considered to model fuel flow:-
- vehicle Speed
- Fuel Flow
- Battrey Power
Calculation:-
1. Vehicle speed

- Vehicle speed is most inportant factor for fuel calculation. At every time of instant the speed of the vehicle is not same. So the need of the fuel at every time of instant is different.
- Ther where we need to convert speed in total distance traveled for that the velocity get integrated with time.
2. Fuel Flow

- 1 Gallon = 3.78541 lit
- The amount of fuel flow is a mass flow rate which is given as kg/sec. then intigrate the value to get volume and then multiply with 1000 to convert it in to liters.
- By compairing vehicle speed and fuel flow it gives the amount of fuel consumed for 100km.
- 1 mile = 1.6 km.
3. Battrey Power

- The power of batrrey required is equivalent to the calculated engine power.
- Input battrey power is in watt so dividet it by 1000 to get power in Kw. To conver power in to energy multiply the value with respect to time gets Kwh.
- As we need result in gallon the for conversion divide the value with 33.7 which is conversion un US unit.
- Also we need the result in gallons per sec. So to convert hours to sec dividing the value with 3600.
- Then further multiply with 0.00378541 to convert volume in to US gallon.
calculation of miles per gallon
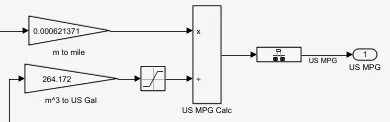
- By the input of speed of vehicle we found distance traveled by vehicle in meter 'm', so to convert it in to miles multiply it with 0.00621371.
- From the input of fuel flow and battrey power we get total amount of power which is in m^3 so to convert it into US gallon devide it with 264.172.
- Calculating these two values we get fuel require miles per gallon.
3. Run the HEV ReferenceApplication with WOT drive cycle. Change the grade and wind velocity in the environment block. Comment on the results.
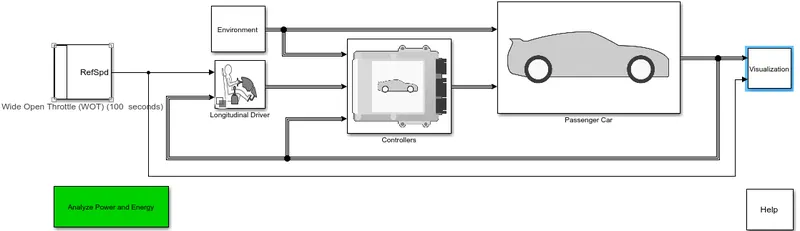
Model with WOT drive cycle:
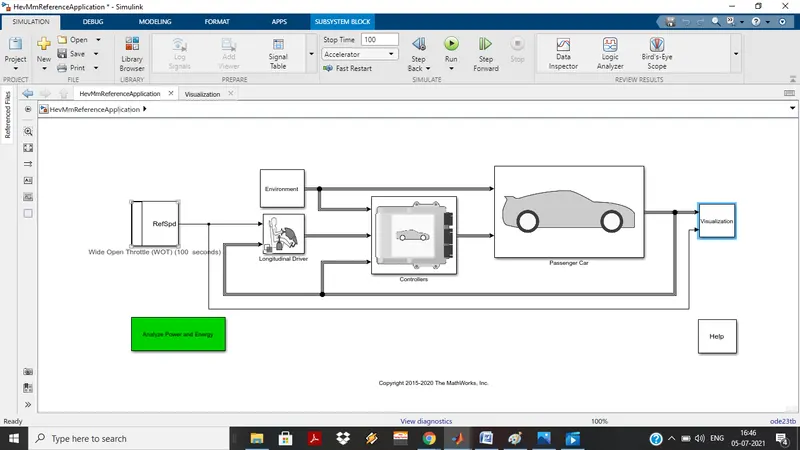
CONDITION :1
Run model with WOT drive cycle with out any change in parameters.
WOT drive cycle parameters
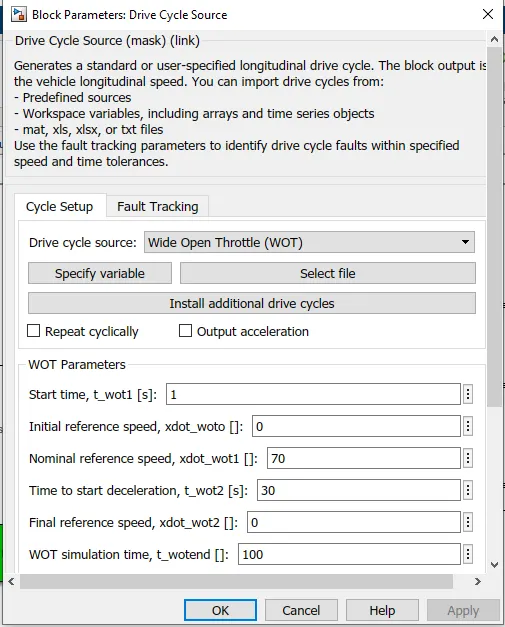
- Maximum speed = 70mph
- Deceleration time = 30 sec
- Total run time = 100 sec
- Grade = 0
- wind velocity = 0
Output:
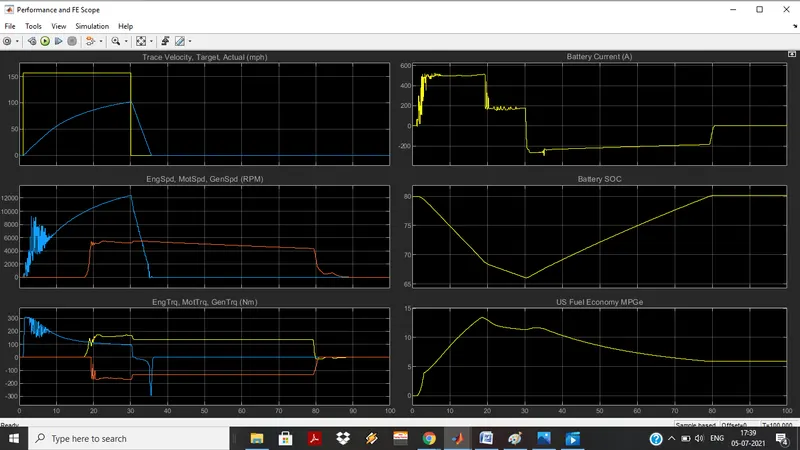
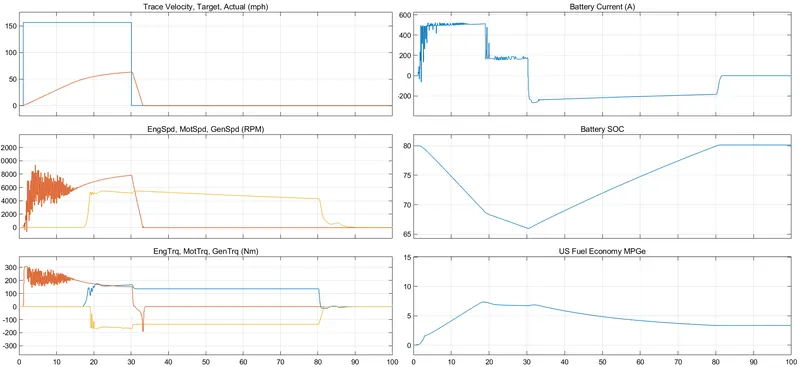
PLOT 1 (Trace velocity to actual velocity) :- The Graph shows that actual velocity of the vehicle does not met to the decired velocity. where the desired velocity is 160mph, and the velocity obtaine by the vehicle is 100mph.
PLOT 2 (Engine speed, Motor speed, Generator speed ) :- This plot shows the required power in RPM to achive actual velocity, from gragh it clears that the power reaches to the actual velocity limit.
PLOT 3 (Engine Torque, Motor Torque, Generator Torque) :- The garph shows the required torque for reaching the vehicle at perticular velocity at every instant of time.
PLOT 4 (Battrey current) :- Battrey current can be studied with this graph where the unit is amper. The battrey current used is depend on the change in velocity of the vehicle.
PLOT 5 (Battrey SOC) :- The battrey state of charge shows the status of charging and discharging of the battrey at every instant of time.
PLOT 6 (Fuel Economy) :- The fuel used MPGe for every instant of time considering acceleration and decleration of vehicle.
CONDITION :2
Run model with WOT drive cycle with change in parameters.
WOT drive cycle parameters
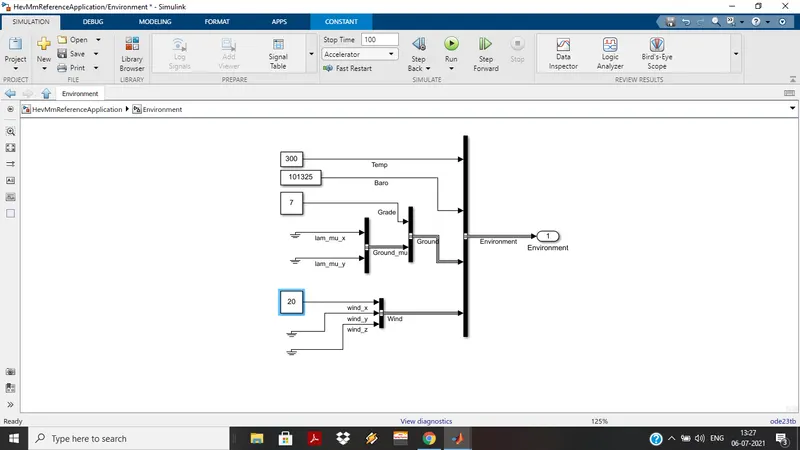
- Maximum speed = 70mph
- Deceleration time = 30 sec
- Total run time = 100 sec
- Grade = 7
- wind velocity = 20
Output:
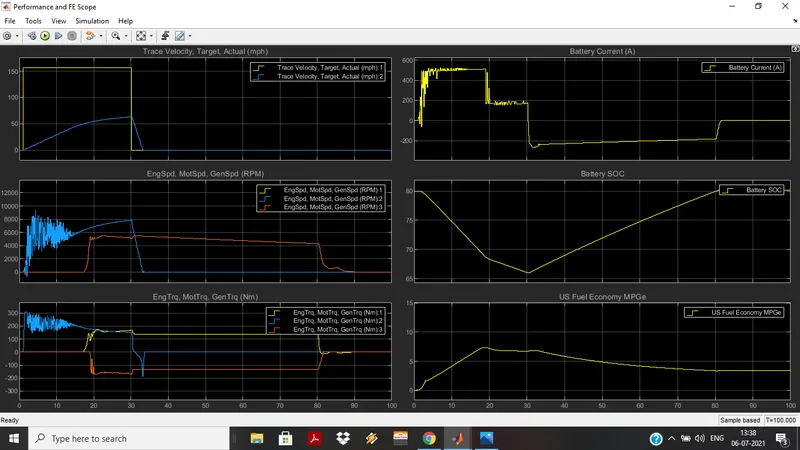
As we apply grade and wind velocity which actually acts as a resistance to the vehicle so the out put changes accordingly
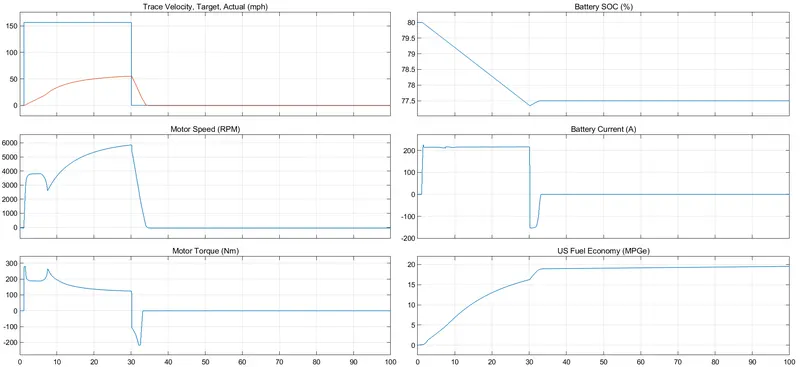
PLOT 1 (Trace velocity to actual velocity) :- The Graph shows that actual velocity of the vehicle does not met to the decired velocity. where the desired velocity is 160mph, and the velocity obtaine by the vehicle is 60mph where as without grade and wind velocity it was 100mph.
PLOT 2 (Engine speed, Motor speed, Generator speed ) :- This plot shows the required power in RPM to achive actual velocity, from gragh it clears that the power reaches to the actual velocity limit.
PLOT 3 (Engine Torque, Motor Torque, Generator Torque) :- The garph shows the required torque for reaching the vehicle at perticular velocity at every instant of time.
PLOT 4 (Battrey current) :- Battrey current can be studied with this graph where the unit is amper. The battrey current used is depend on the change in velocity of the vehicle.
PLOT 5 (Battrey SOC) :- The battrey state of charge shows the status of charging and discharging of the battrey at every instant of time. As velocity increases battrey goes on discharge and when vehicle velocity decreases the battrey wuch on charging mode.
PLOT 6 (Fuel Economy) :- The fuel used MPGe for every instant of time considering acceleration and decleration of vehicle.
4. Keeping all other parameters same, compare the simulated results of hybrid and pure electric powertrains.
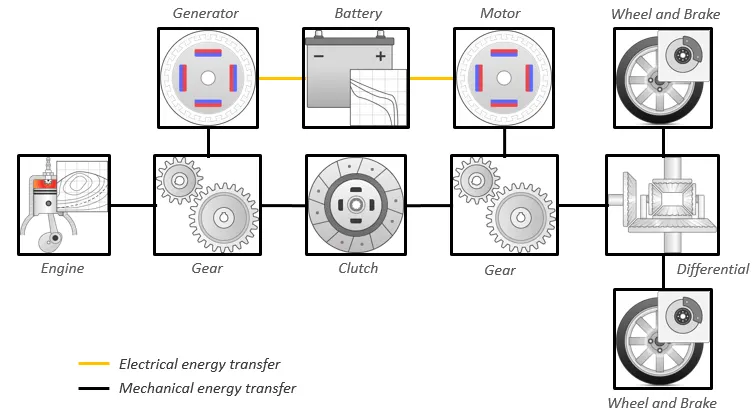
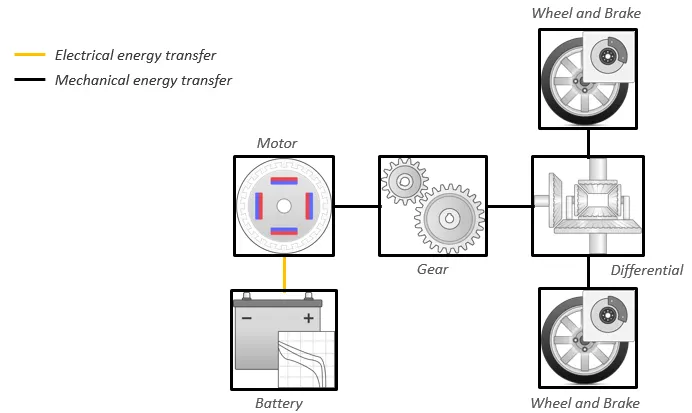
| hybrid electric powertrain | pure electric powertrains |
 |
 |
 |
 |
 |
 |
|
Prarameters
|
Prarameters
|
|
|