Week-4 Challenge WOT Condition Part-2
1) Aim:
To explain between the mapped and dynamic block and to modify the model.
Explanation:
Mapped Block:
Mapped Engines represent macro engine behavior as a set of lookup tables (brake torque, fuel flow, air mass flow, exhaust temperature, efficiency, and emissions) as functions of commanded load and measured engine speed. Mapped engine models are suitable for analysis and design activities that do not require engine subsystem dynamic characteristics, for example, in engine and transmission powertrain matching analysis for fuel economy, emissions, and performance tradeoffs.
Dynamic Block:
Dynamic engines decompose engine behavior into individual component models that account for engine dynamics, most notably intake airflow and turbocharger dynamics. Dynamic engine models are suitable for designing control, estimator, and diagnostic algorithms that depend on dynamic subsystem states, for example, in closed-loop AFR control algorithm development.
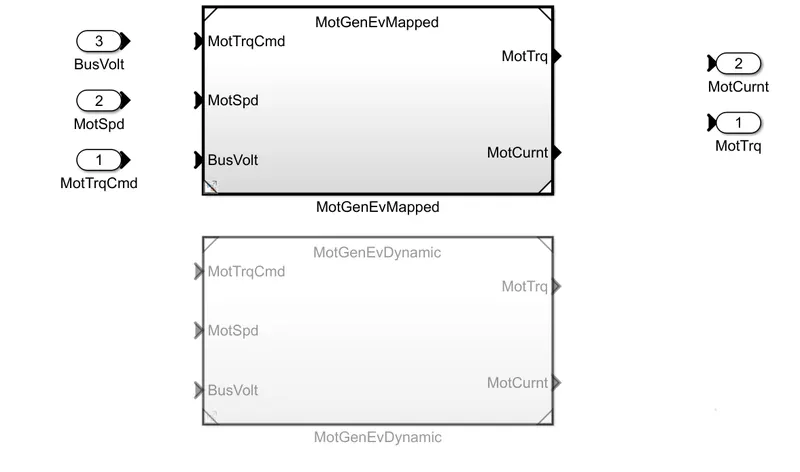
The above figure shows the Motor mapped and Dynamic Block of the Electric Vehicle Application.
To change the model from mapped to dynamic :
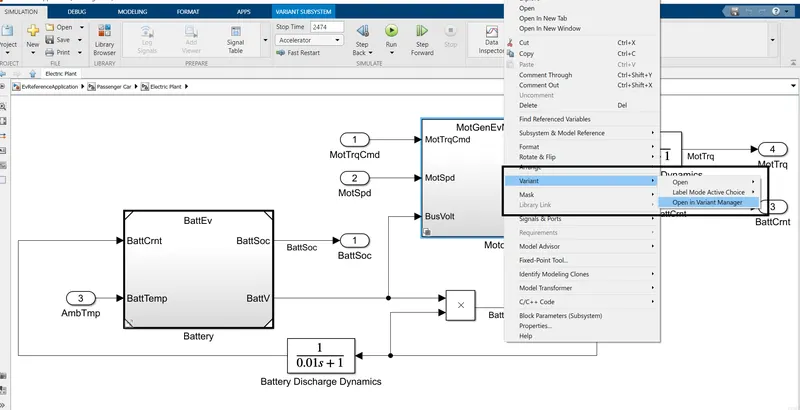
Right-click on the block and choose the variant and open the Variant Manager.
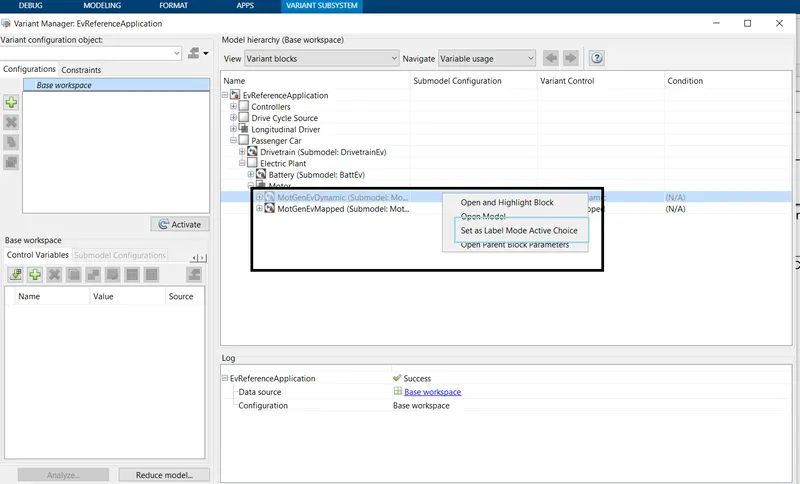
In the Variant Manager, right-click on the submodel, and click on the Set as Label model Active choice and now the particular block becomes active.
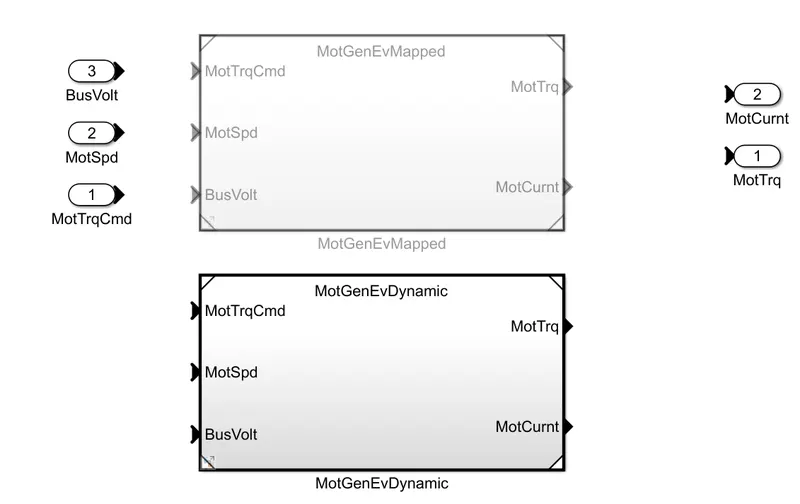
By Following the above steps, The MotGenEVDynamic is activated and shown in the figure.
2)Aim:
To explain how the model calculates the miles per gallon and explain the factor considered to model the fuel flow.
Model:
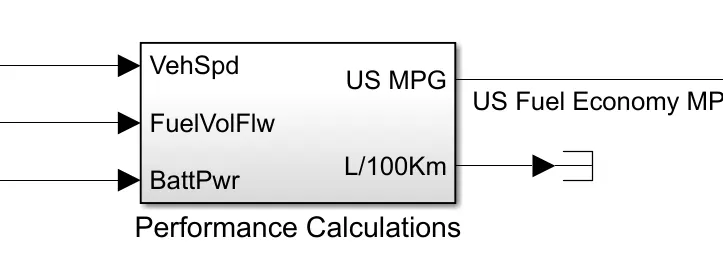
In the visualization block, click on the performance calculation subblock where the model calculates the miles per gallon.
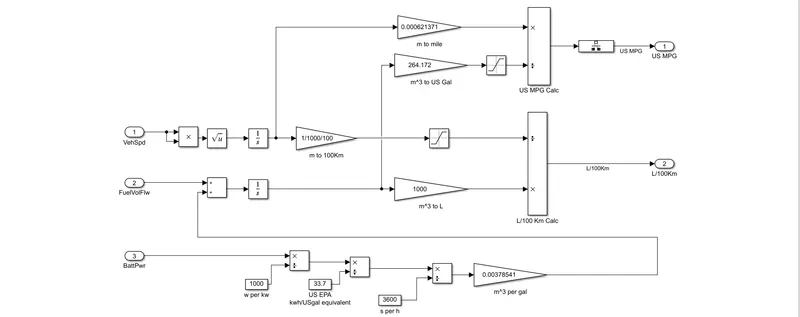
Explanation:

The battery power is converted into m^3 per gal by below steps:
Battery power is converted from KW to Watts and divide by 33.7 to convert into gal equivalent and the result is again divided by 3600 and multiply by the gain of 0.00378541.

The output Battery power conversion is fed as input od add block along with Fuel flow value.The output of add block is integrated using integrator block and fed as input to m^3 to US gal and m^3 to L block.
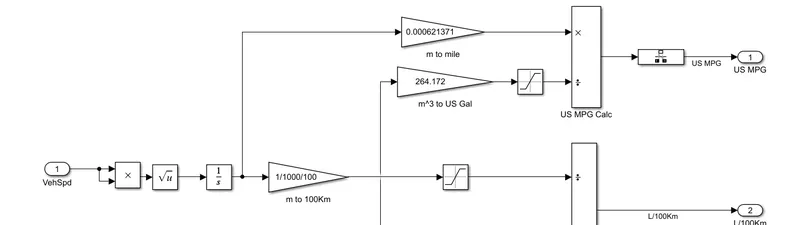
The vehicle speed is cov=nverted into mile by using product, sqrt and integrator block. The speed in mile and output of m^3 to US gal is fed as input to US MPG calc block and given to rate transition block.
Factors are considered to model fuel flow:
- Vehicle speed
- Fuel Flow value
- Battery power
3)Aim:
To run the HEV ReferenceApplication with WOT drive cycle, also modify the grade, wind velocity values and plot the observation.
Model:
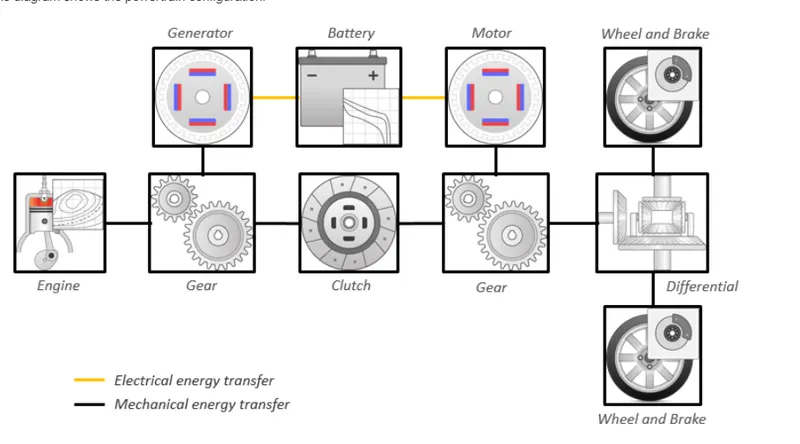
The hybrid electric vehicle reference application represents a full multimode hybrid electric vehicle (HEV) model with an internal combustion engine, transmission, battery, motor, generator, and associated powertrain control algorithms.
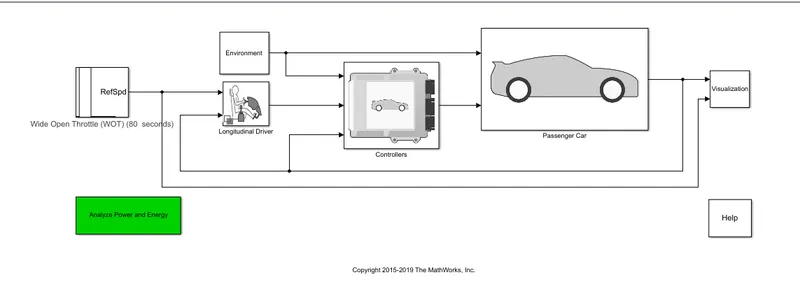
In the HEV ReferenceApplication, Drive cycle Source is changed to Wide-open throttle(WOT), and nominal reference speed is 60, and simulation time is set to 80 sec.
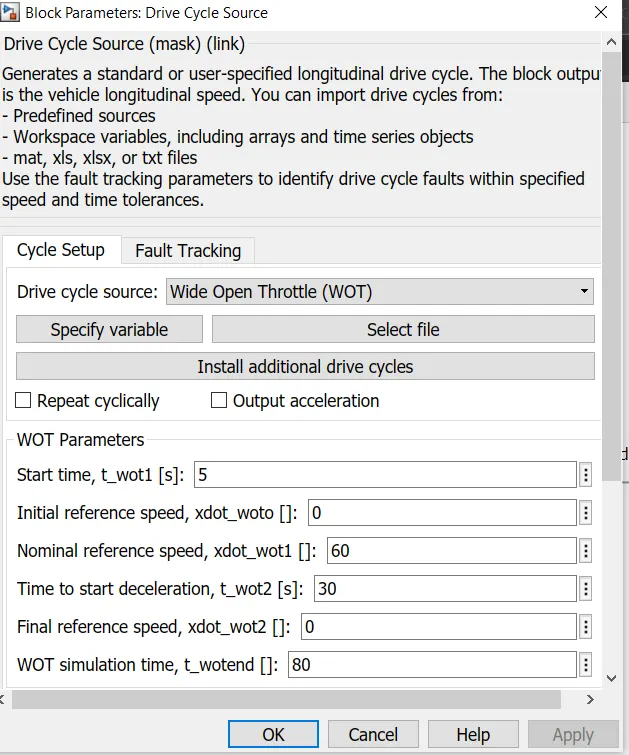
Explanation:
For the default parameter, the response of the HEV ReferenceApplication with WOT drive cycle is shown below.
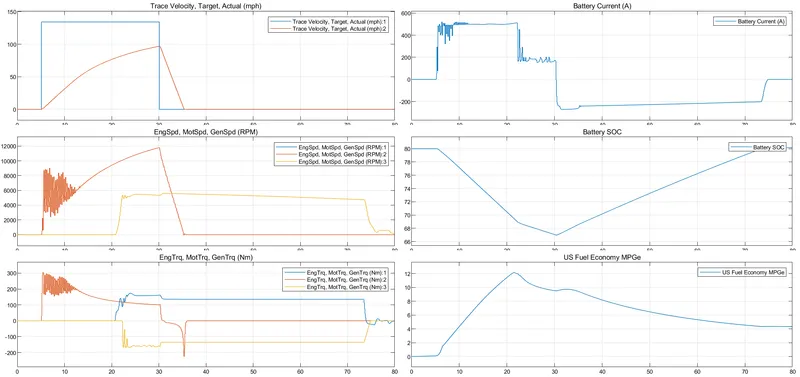
in the above graph,
- The trace velocity is 134 mph and the actual velocity is 96.5 mph at the time period of 30 sec.
- The battery current at a time starting is 35 A and reaches the maximum value of 497.7A and decreases to 163.8 A at the time period of 30 sec.
- The Battery SOC is 80.0 at the time of start and reduces to 67.0 at 30 sec and increases gradually because of the negative battery current which indicates is in charging mode.
- In this case, the US Fuel economy increases in time of starting to 30 sec because operated with help of battery and engine but after 30 sec it decreases because operated only with help of the engine.
Changes of values:
The grade and wind velocity is changed to 5 and 8 respectively.
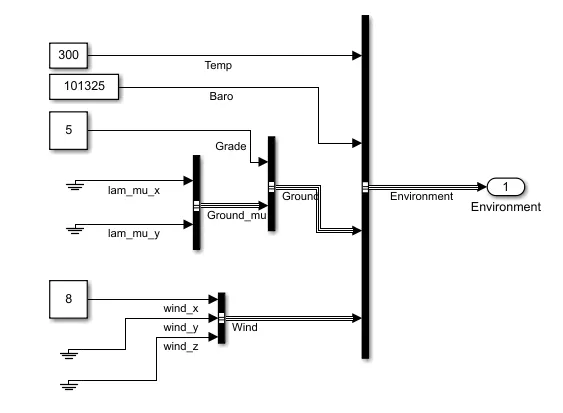
For the changes in grade and wind velocity parameter, the response of the HEV ReferenceApplication with WOT drive cycle is shown below.
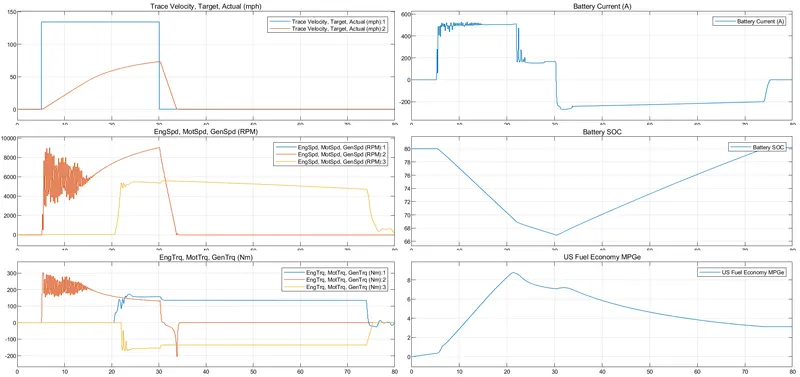
In the above graph,
- Trace velocity reaches the speed of 134 mph at 30 s while actual velocity reaches 73.1 mph.
- The battery current at time start is 56.9 A and reaches the maximum value of 506.4 A and decreases to 158.7 A at time of 30 sec.
- Battery SOC at time of start is 80.0 and gradually reduces to 67.0 at time of 30 sec after that Battery SOC increases because of negative battery current indicates that battery is in charging mode.
- In this case, the US Fuel economy increases in time of starting to 30 sec because operated with help of battery and engine but after 30 sec it decreases because operated only with help of the engine.
Conclusion:
By changing the grade and wind velocity values we can conclude that actual speed reduces, battery current increases and fuel economy reduces.
4)Aim:
Compare the electric vehicle and hybrid vehicle and plot the observation.
Electric Vehicle Model:
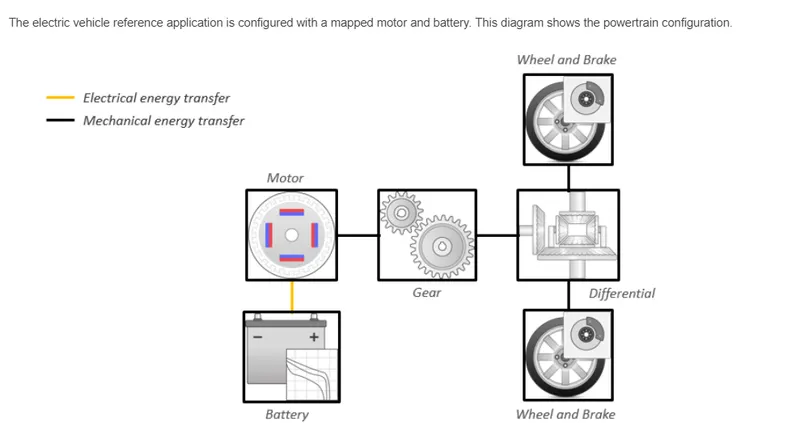
The electric vehicle reference application represents a fully electric vehicle model with a motor-generator, battery, direct-drive transmission, and associated powertrain control algorithms.
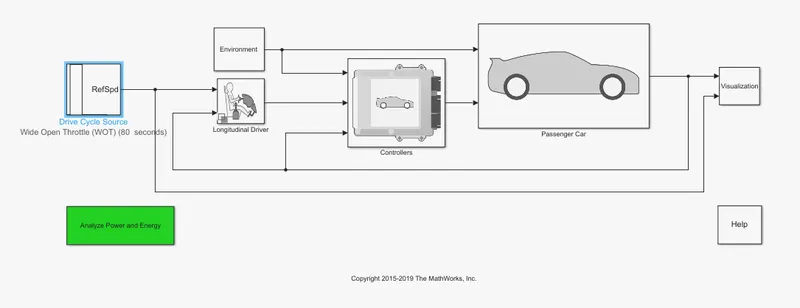
In the EV ReferenceApplication, Drive cycle Source is changed to Wide-open throttle(WOT), and nominal reference speed is 60, and the simulation time is set to 80 sec.
Explanation:
For the default parameter, the response of the HEV ReferenceApplication with WOT drive cycle is shown below.
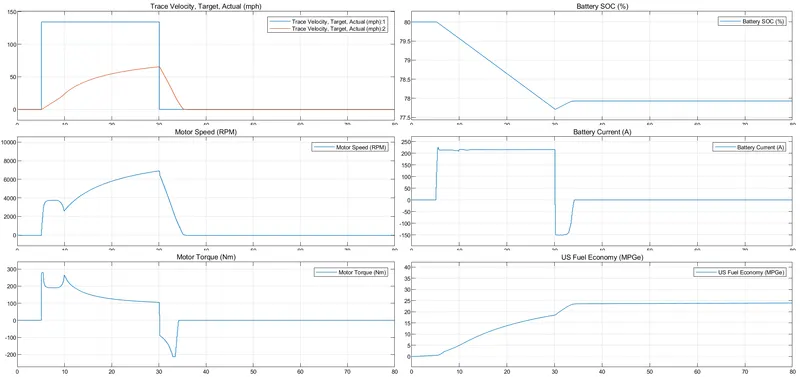
In the above graph,
- The trace velocity reaches the maximum speed of 132 mph while the actual velocity reaches a maximum speed of 65.1 mph.
- The battery current reaches the maximum value of 215 A and reduces gradually because the velocity reduces, the vehicle in deceleration. When the Battery current goes negative the Battery SOC increases because it is in charging mode.
- The battery SOC at the time of starting is 80.0 % and reduces to 77 % at the time period of 30 sec and then increases gradually at becomes constant at 78% because at that time the velocity becomes zero.
- The US Fuel Economy increases reach the maximum value of 23 MPGe.
Conclusion:
In the hybrid Electric vehicle, the actual velocity reaches a maximum value than the electric vehicle. The Battery current required is less when compared with the hybrid Electric vehicle. The Fuel economy of electric vehicles is high when compared with the hybrid Electric vehicle.