Week - 4
- Implement control logic of a “washing machine” using Stateflow as per given sequence:
- If the power supply is available, the system gets activated
- If the Water supply is not available, stop the process & indicate through LED
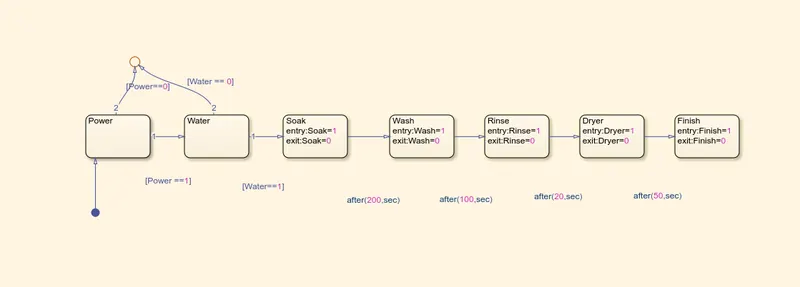
- Soaking time should be 200s followed by Washing time of 100s.
- Then rinsing happens for next 20s & dryer runs for 50s
Aim: Implement the control logic of a washing machine using stateflow chart as per the sequence and durations provided in the question
Theory:
A Stateflow chart is a graphical representation of a finite state machine consisting of states, transitions, and data.Stateflow is generally used to specify the discrete controller in the model of a hybrid system where the continuous dynamics (i.e., the behavior of the plant and environment) are specified using Simulink.
An automatic washing machine executes different stages in washing in a sequence and as per a fixed duration. Different initial conditions has to be met inorder to start the operations like water supply and power supply. If any of the initial conditions are not met, the entire operation is aborted and an indication is given.
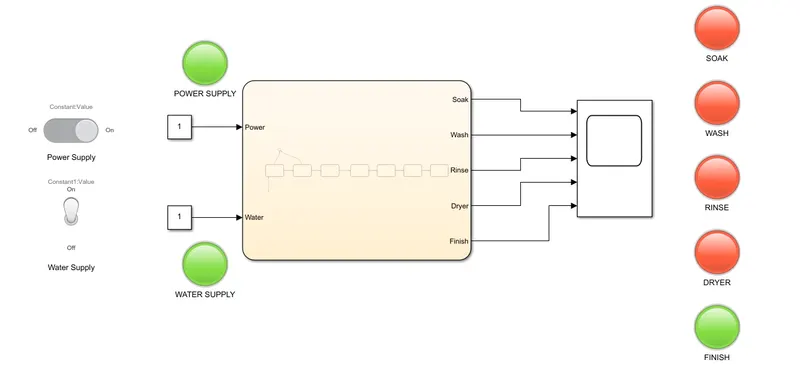
Slider Switch: This block is used for switching on/off the power supply. The output of the switch is indicated through a lamp
Toggle switch : this block is used to switch on the water supply
Stateflow chart: The sequential operations are mentioned in this with different states. entry and exit conditions are mentioned for each state and data from each state is assigned as input and output
Scope: The output data is plotted for better understanding
Lamp: different operation of states are indicated through lamps
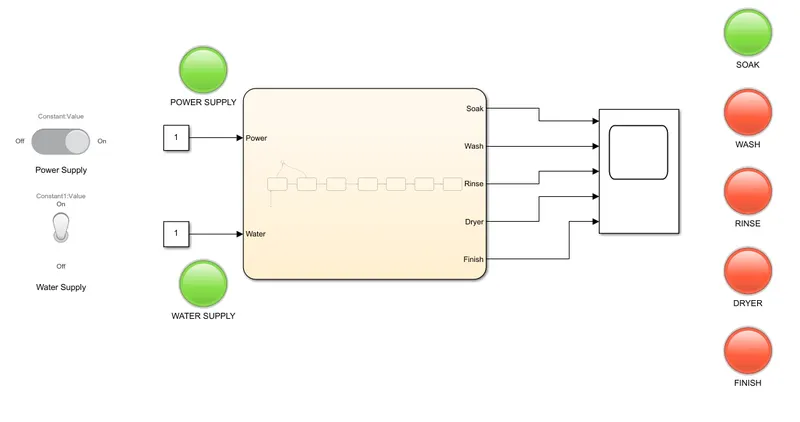
The blocks are connected as follows
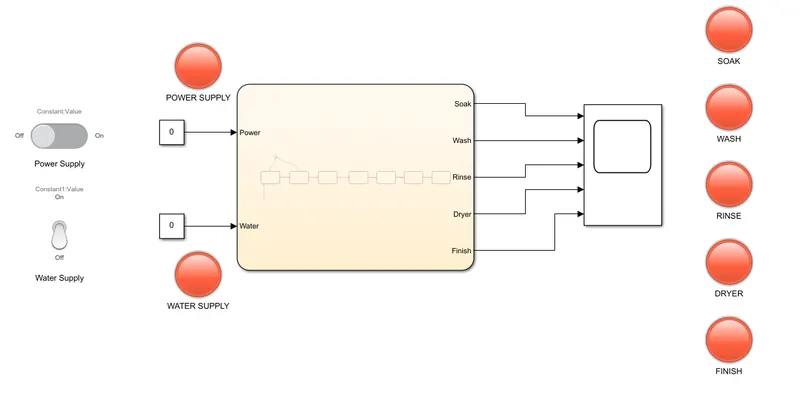
The stateflow chart is as follows
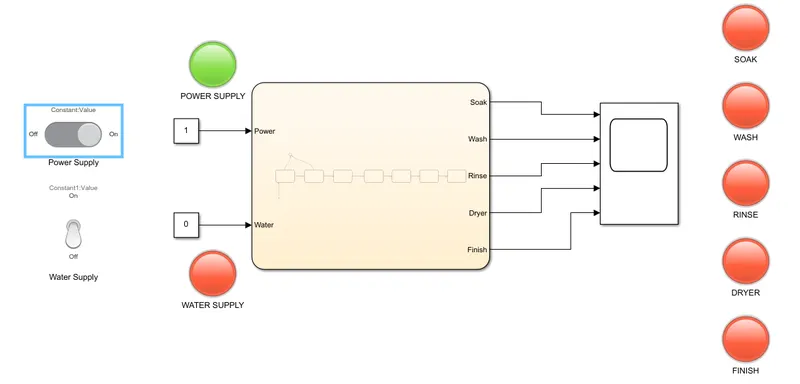
At t=0; and power supply is on, we can see that the lamp is green
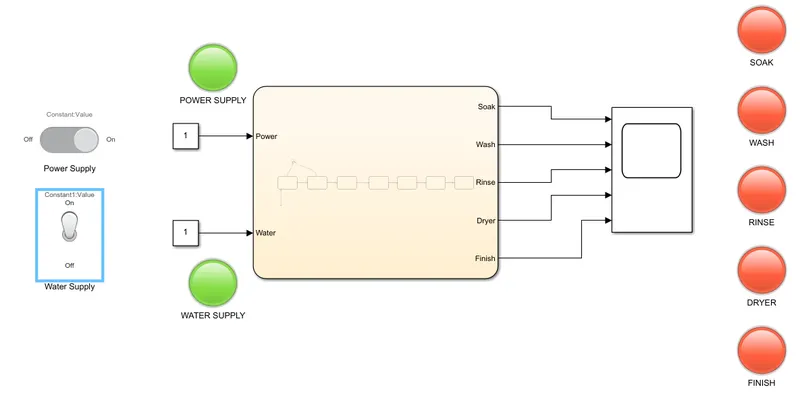
When both power supply and water supply is ON, both lamps are green
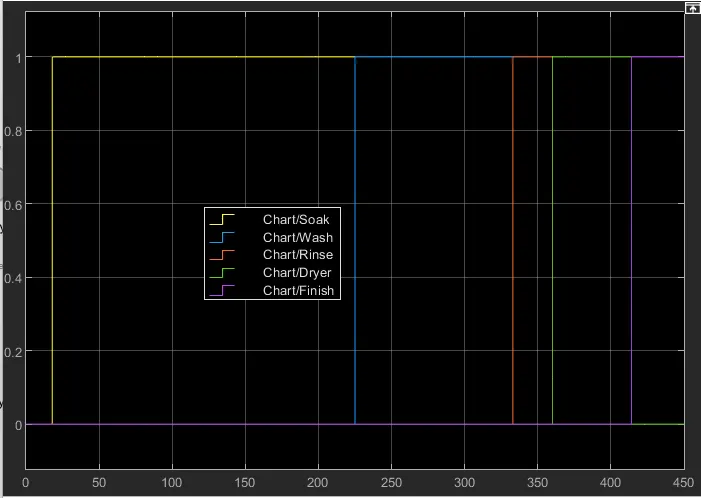
When t=5, we can see that thee first step is started
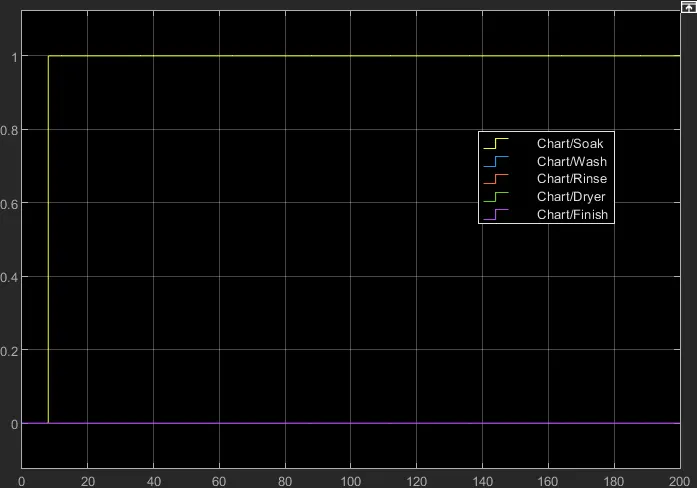
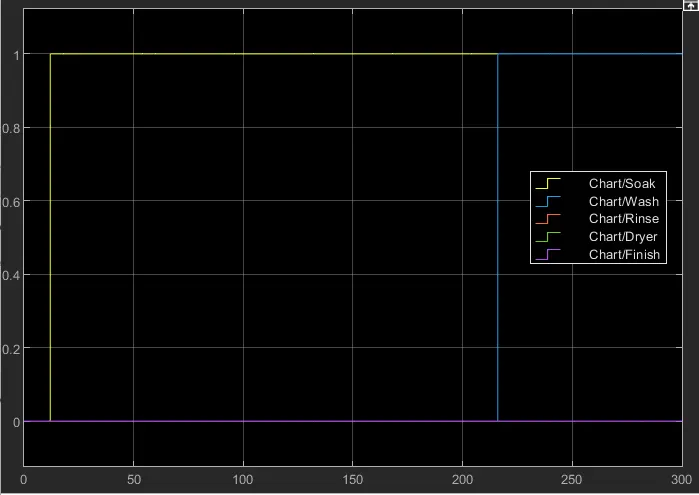
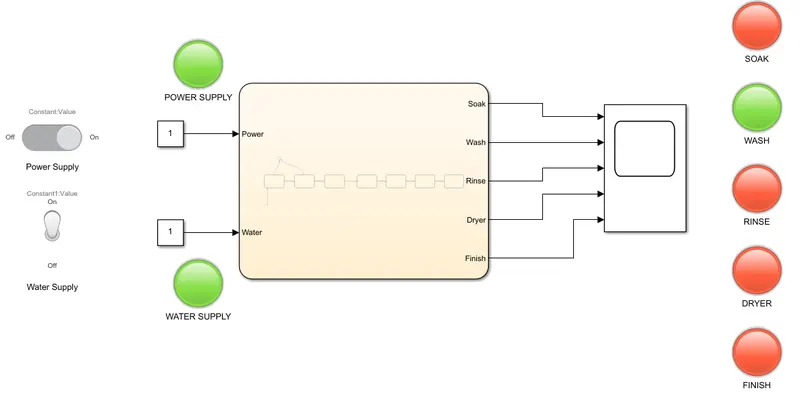
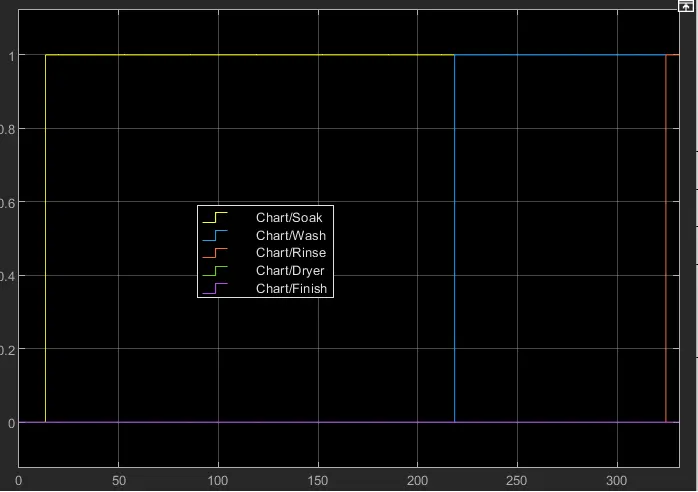
At t=250, the second step(wash) is started
When t=350, the third process is going on
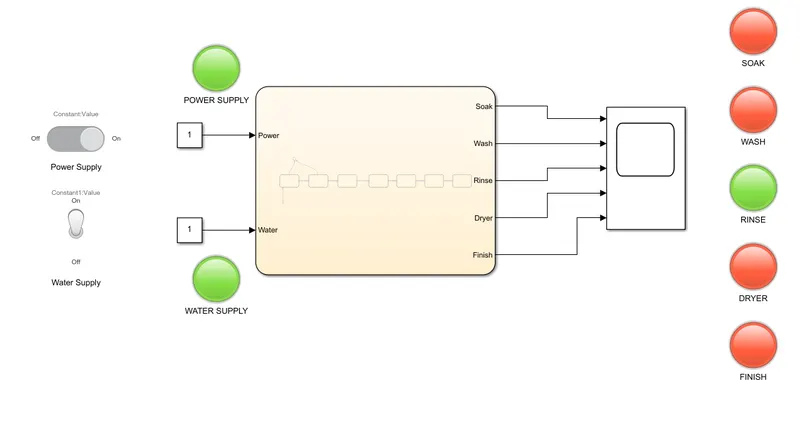
Process 4
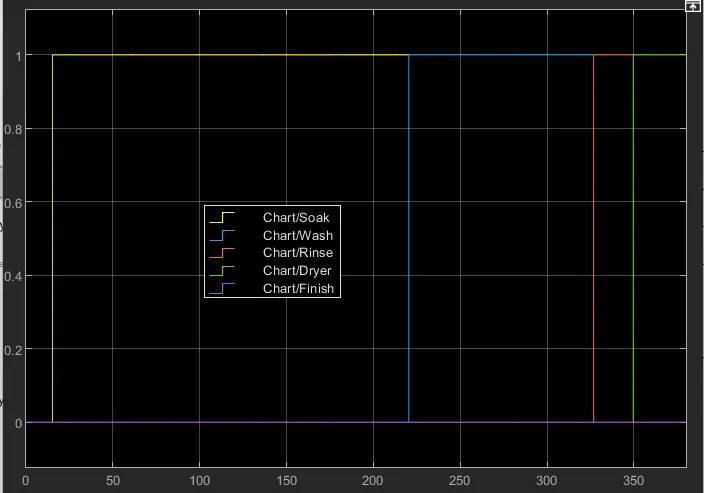
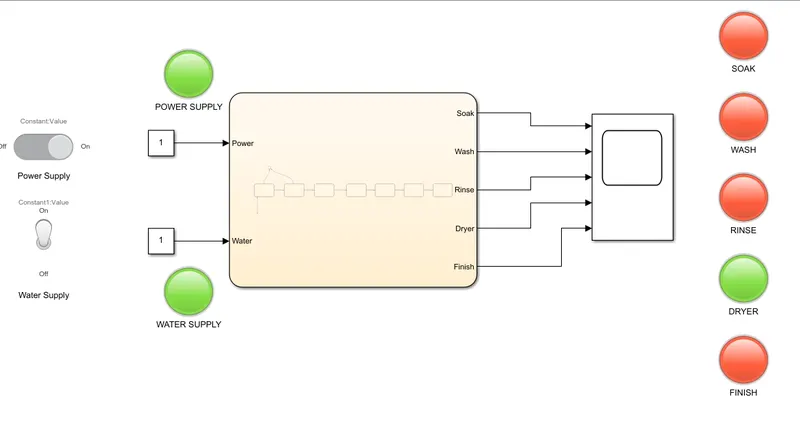
Process 5, Here all operations are completed and finish lamp is ON
2. Make a Simulink chart for the “Gear shift” logic as per below conditions:
Speed Range(kmph) Gear
0 to 15 1
16 to 25 2
26 to 40 3
41 to 60 4
Above 61 5
Give speed input while the simulation is running & display the gear number.
Aim: To create a stateflow chart to shift gears with respect to speed
Theory:
Gears are used for transmitting power from one part of a machine to another. In a bicycle, for example, it's gears that take power from the pedals to the back wheel. Similarly, in a car, gears transmit power from the crankshaft (the rotating axle that takes power from the engine) to the driveshaft running under the car that ultimately powers the wheels.Multiple number of gears connected together and they can be in different shapes and sizes.
Changing gears is about using the engine's power in different ways to match changing driving conditions. The driver uses the gearshift to make the engine generate more force or more speed depending on whether hill-climbing power, acceleration from a standstill, or pure speed is needed.
Simulink explanation
Stateflow chart: chart is designed with one state for each gear and giving minimum and maximum speed for each state
Ignition and speed are given as input data
Gear number is assigned as output data
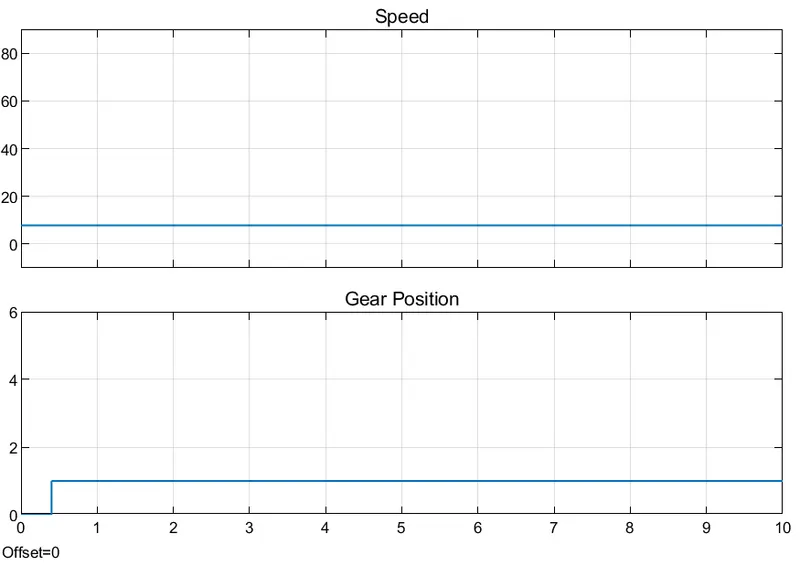
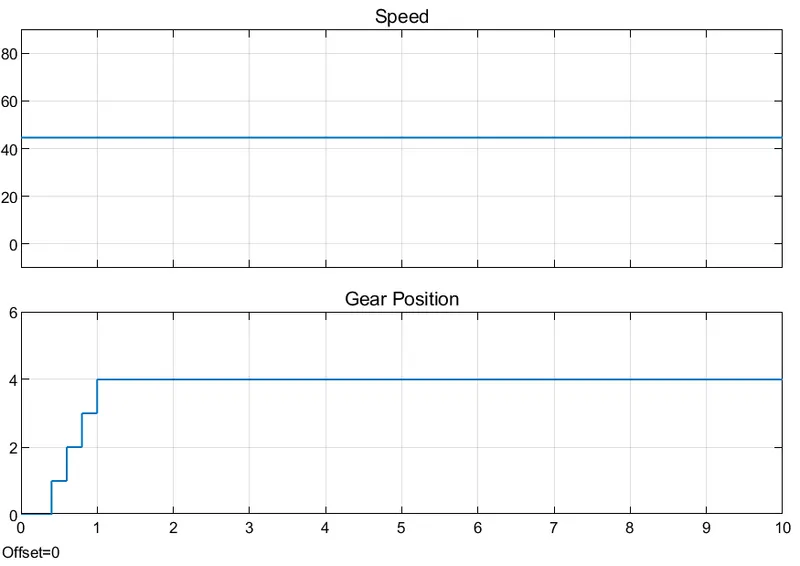
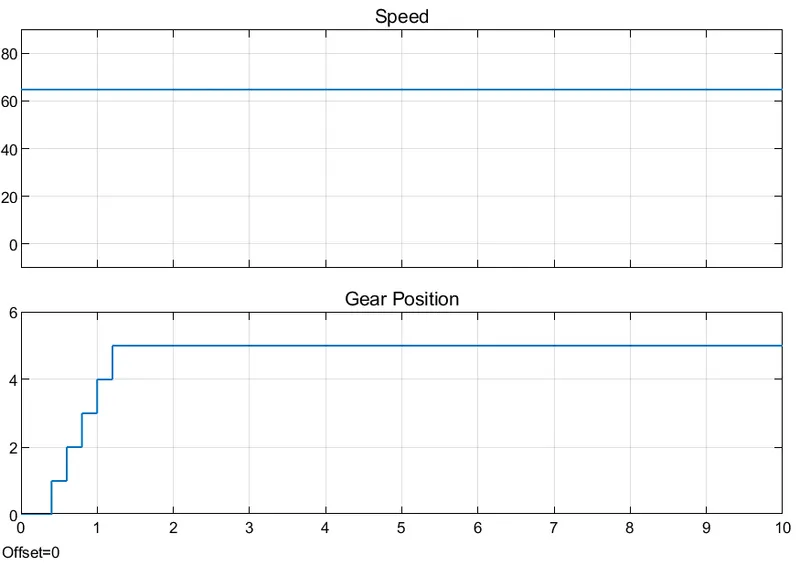
Both speed and gear position are plotted using a scope.
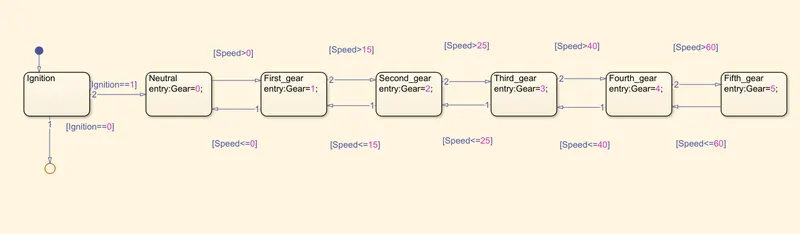
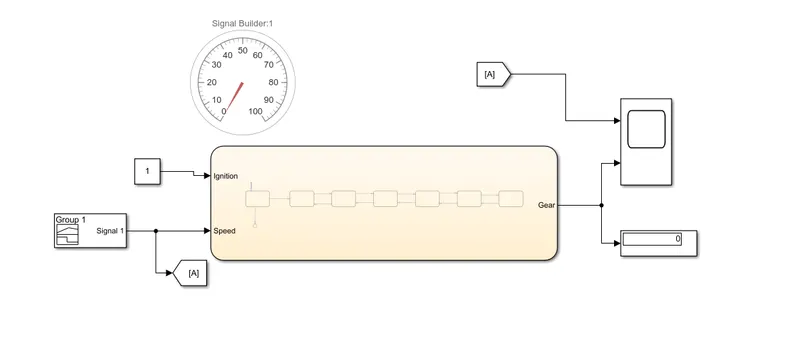
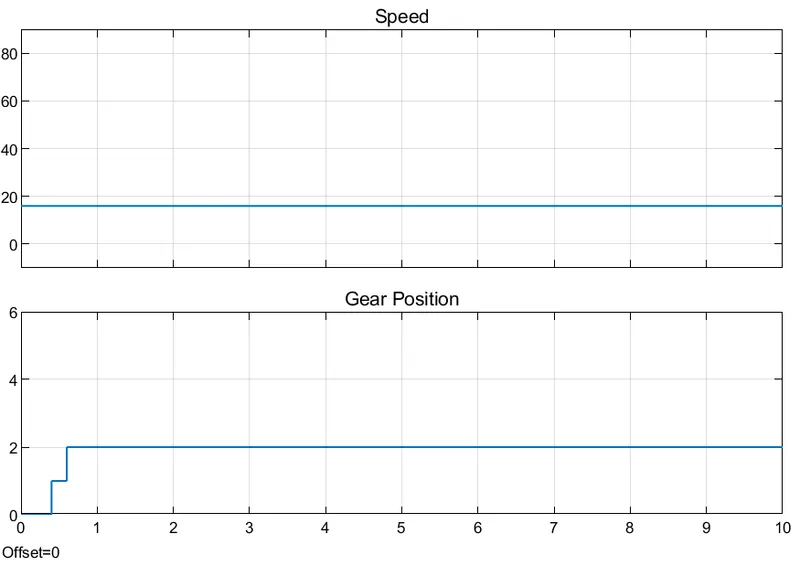
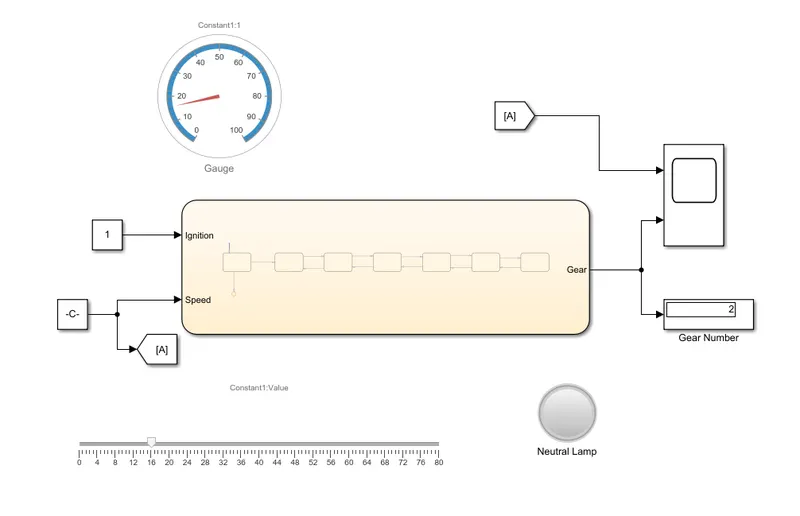
Firstly, a signal builder is used to give input to speed. the plots and block diagram are as follows
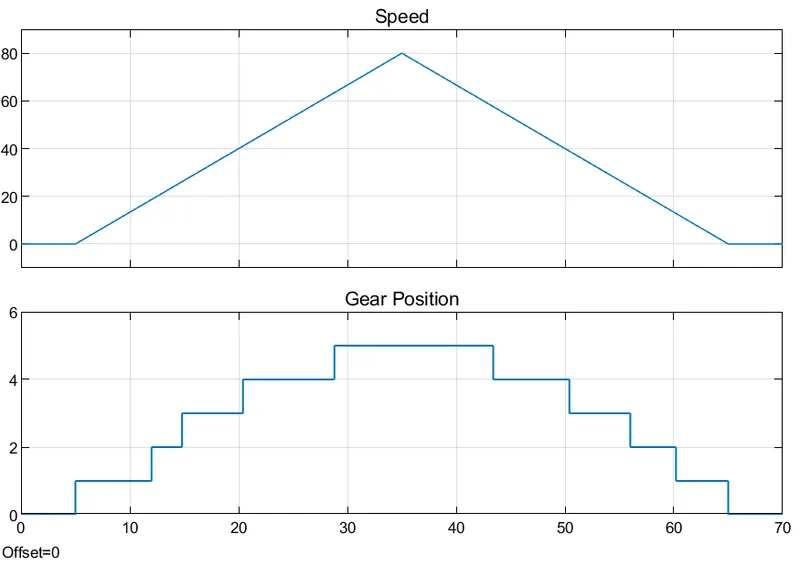
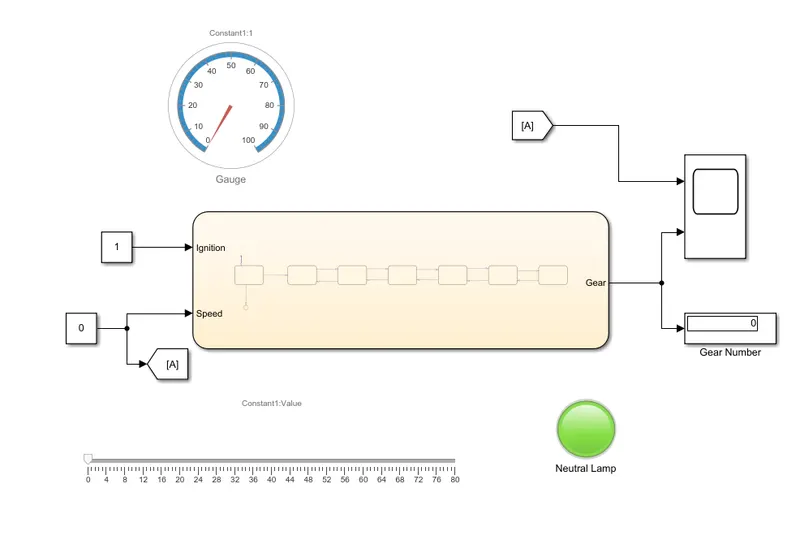
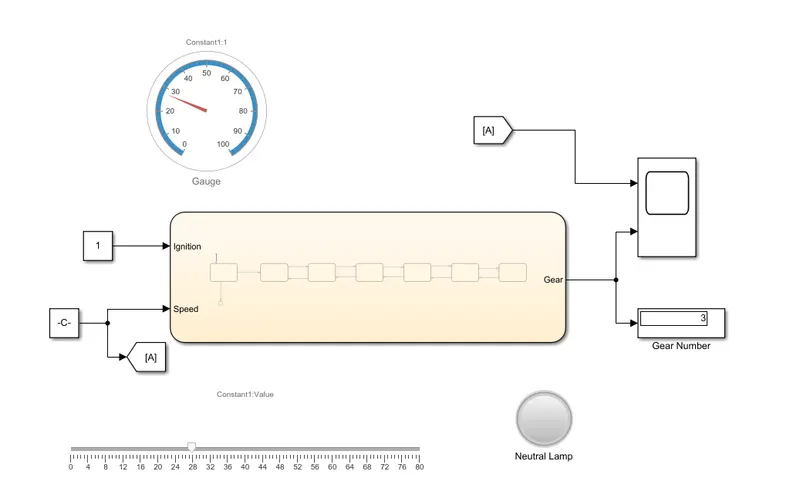
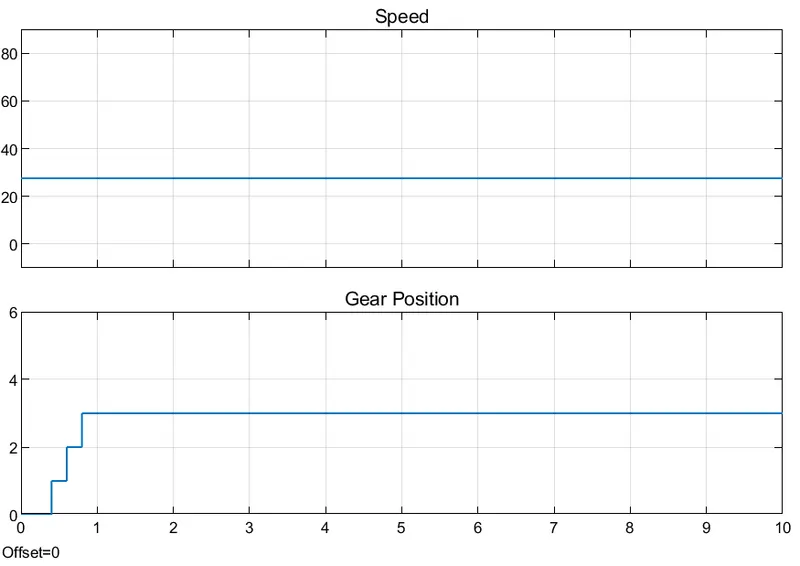
In next trial, a slider is used to vary the speed and different plots are plotted as follows
When speed =0
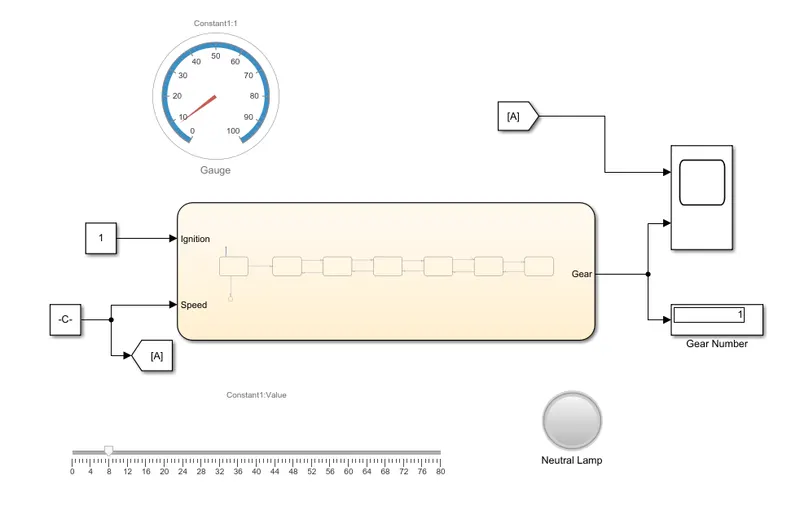
when speed =8,gear shift to first
when speed = 18, gear shift to second
when speed=28, gear shifts to third
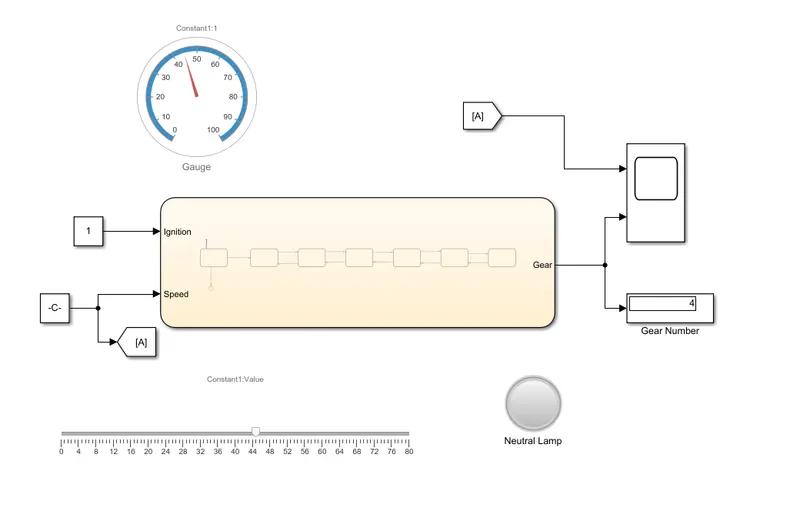
when speed=45, gear shifts ti fourth
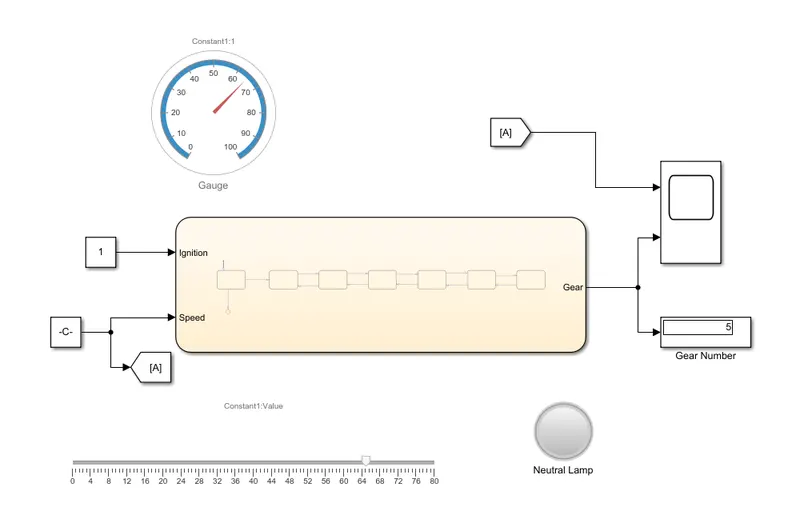
When speed=65, gear shifts to fifth
Conclusion:
Stateflow charts are a very helpful tool in designing the logic for any operation. The graphical representation makes it easier to understand.