Project 1 - Parsing NASA thermodynamic data
AIM
To extract data from a file to get the coefficients to calculate various thermodynamic parameters.
THEORY
The NASA thermodynamic data contains 14 coefficients for 53 different species. File parsing is done to extract data from the file and draw meaningful conclusions.
The knowledge of thermochemical properties, such as heat capacity, enthalpy and entropy is quite important when solving combustion-related problems. NASA came up with polynomials that can be used to evaluate thermodynamic properties such as Cp, H and S. They have also documented the co-efficient that are required to evaluate these polynomials for 1000+ species. The NASA polynomials have been evolved for more than 50 years and they are widely accepted and extensively used in various applications.
The polynomial equations used for calculating the parameters are
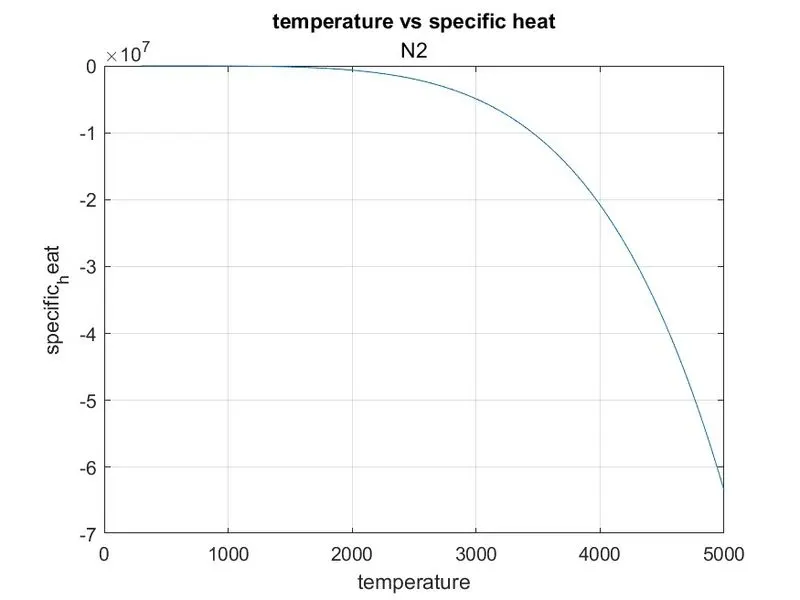
`(Cp)/R=a1+a2*T+a3*T^2+a4*T^3+a5*T^4`
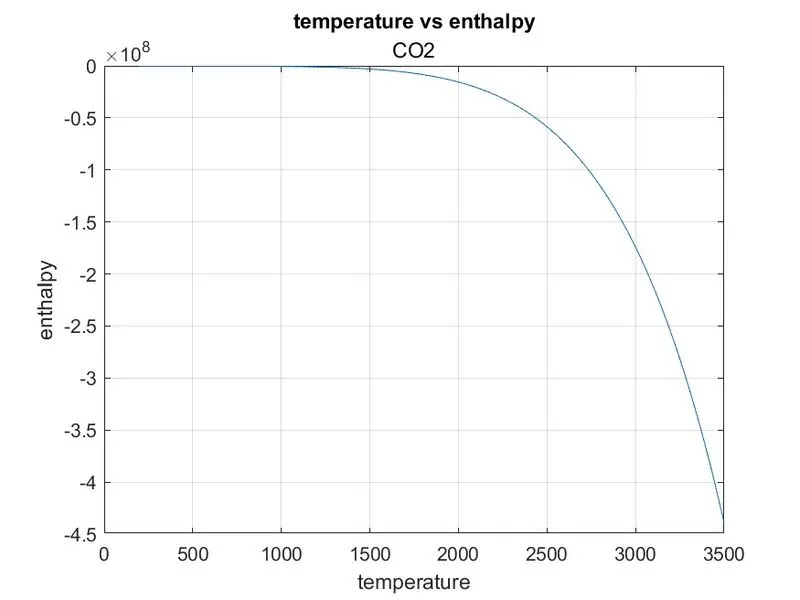
`H/(RT)=a1+a2*T/2+a3*T^2/3+a4*T^3/4+a5*T^4/5+(a6)/T`
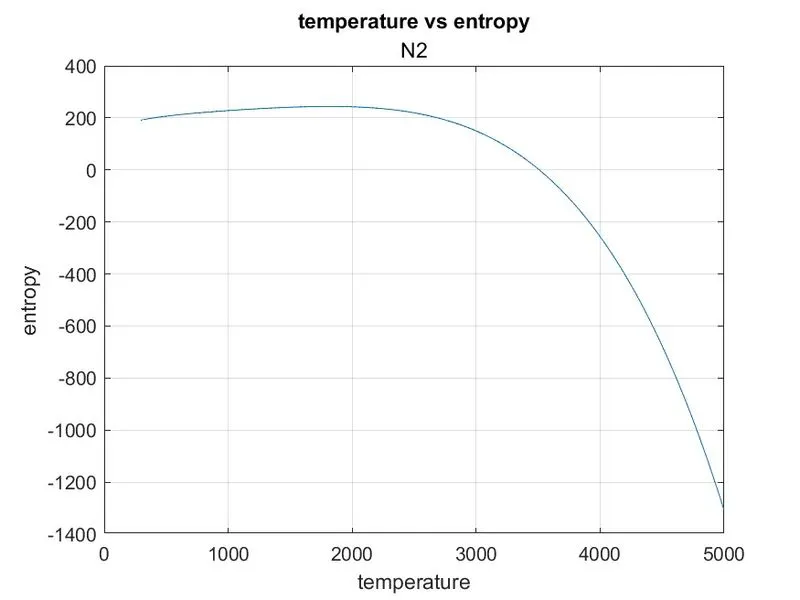
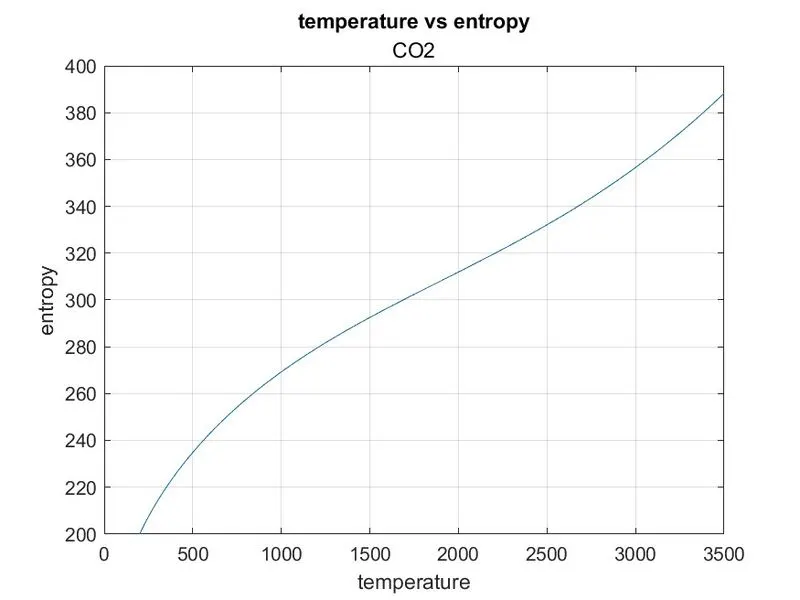
`S/R=a1*lnT+a2*T+a3*T^2/2+a4*T^3/3+a5*T^4/4+a7`
In this equation R is the universal gas constant and T is the local temperature.
CODE EXPLANATION
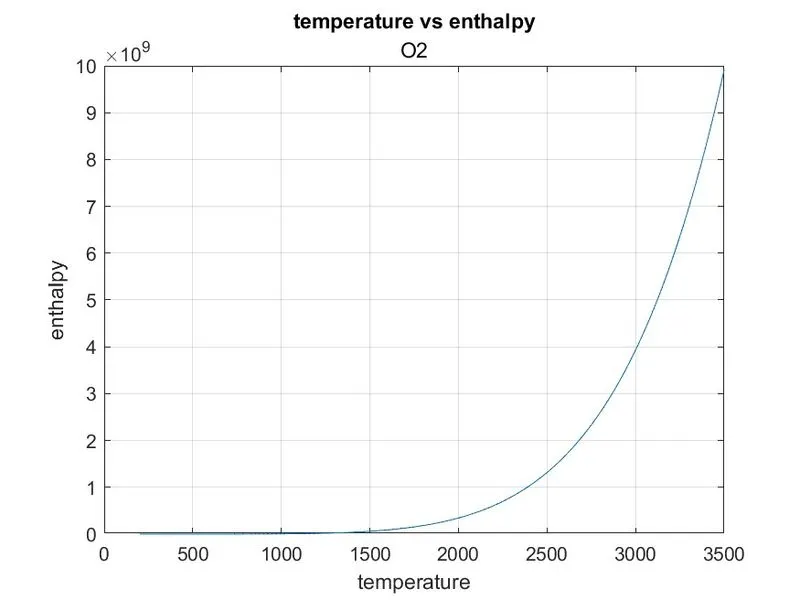
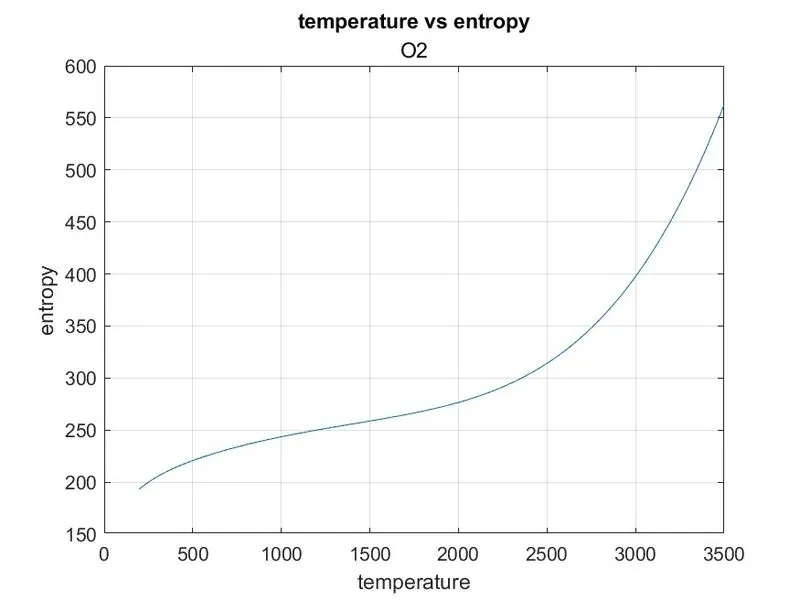
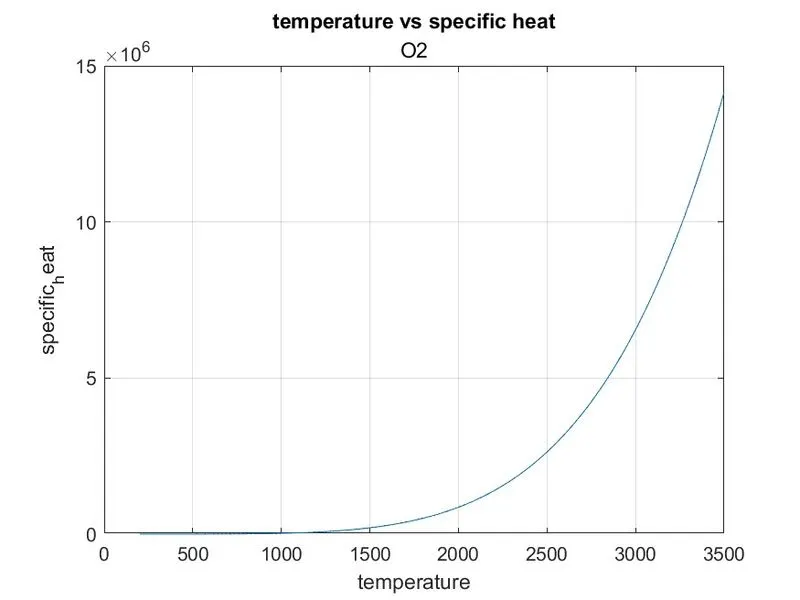
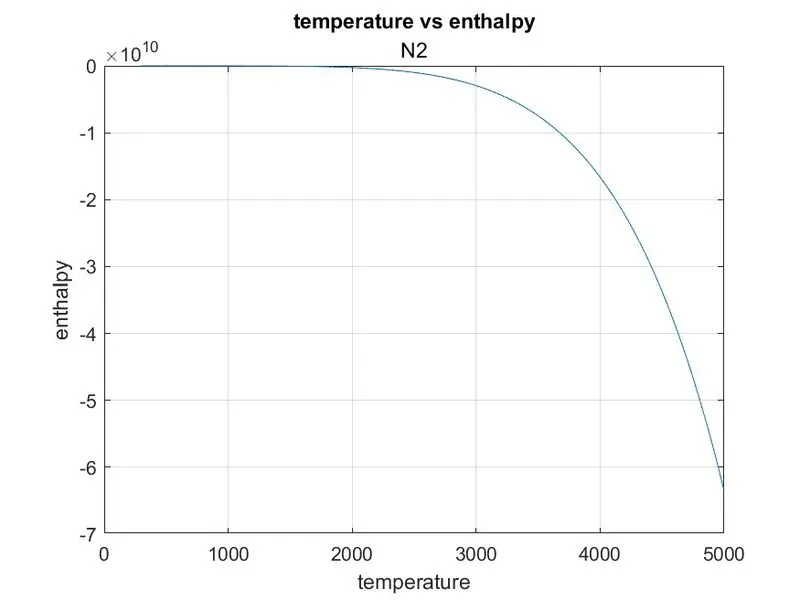
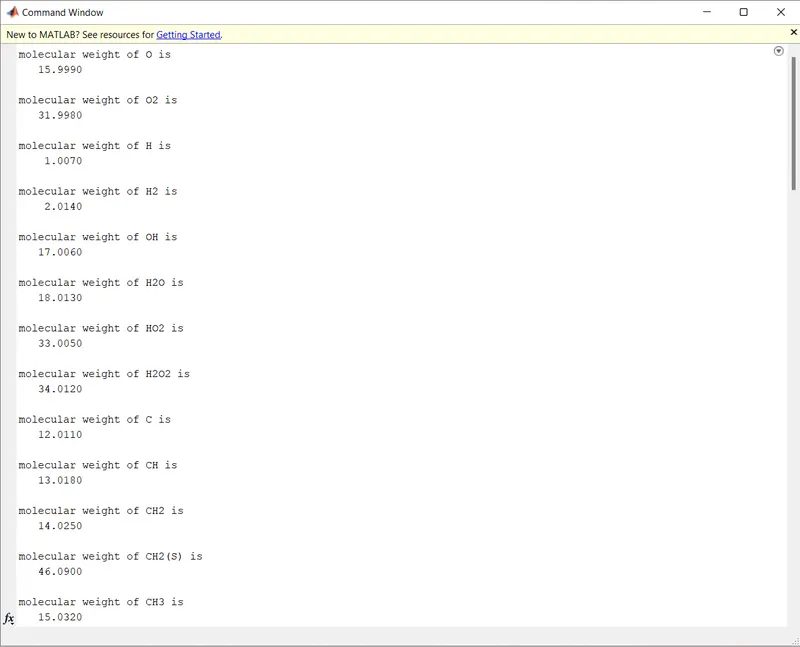
In the code, the file is opened for reading using ‘fopen’ command and fgetl command used to read the next line. The global temperature ranges in the second line is split using strsplit and the str2double command to convert it to number. The next 3 lines are skipped using fgetl command. The next line is read using fgetl and the local temperature limits are stored as numbers and the species name as string. In the next 3 lines, all the 14 coefficient of the particular species is stored in different variables. A matrix is created between local low and local high temperature with 500 different values using linspace command. A folder is created with the species name with mkdir command and cd command used to change the directory. Now the function created to calculate the specific heat, enthalpy, entropy and molecular weight are called in and the values are calculated. Now the specific heat, enthalpy and entropy are plotted against the temperature and the figures are saved in the respective folders. The molecular weight of all species are then displayed on the command window.
The explanation for the commands are given in comments in the code shown below.
clear all
close all
clc

%Reading the data file
f1=fopen("THERMO.dat", 'r');
fgetl(f1); % Reading the header

X=fgetl(f1); %reading the socond line which has global temp limits
X=strsplit(X,' '); %splitting the string with space as delimiter
lowGT=str2double(X{2});%converting the string to number and assigning variables to the values
midGT=str2double(X{3});
highGT=str2double(X{4});

for i=1:3      %skipping the next 3 lines
    fgetl(f1);
end

for j=1:53              %for loop for reading data and calculating parameters with coefficients of each species.
header=fgetl(f1);        % reading header info
y=strsplit(header,' ');    %splitting the header string
species_name=y{1};          %storing the species name
local_low_temp=str2double(y{end-3}); %converting and assigning local temp limits
local_mid_temp=str2double(y{end-1});
local_high_temp=str2double(y{end-2});

line_1=fgetl(f1);       %Reading the first line
a=strfind(line_1,'E');  %Finding the location of 'E' in the string
a1=str2double(line_1(1:a(1)+3));      %converting and storing the coefficients w.r.t the position of 'E'
a2=str2double(line_1(a(1)+4:a(2)+3));
a3=str2double(line_1(a(2)+4:a(3)+3));
a4=str2double(line_1(a(3)+4:a(4)+3));
a5=str2double(line_1(a(4)+4:a(5)+3));

line_2=fgetl(f1);       %Reading the Second line
a=strfind(line_2,'E');  %Finding the location of 'E' in the string
a6=str2double(line_2(1:a(1)+3));        %converting and storing the coefficients w.r.t the position of 'E'
a7=str2double(line_2(a(1)+4:a(2)+3));
a8=str2double(line_2(a(2)+4:a(3)+3));
a9=str2double(line_2(a(3)+4:a(4)+3));
a10=str2double(line_2(a(4)+4:a(5)+3));

line_3=fgetl(f1);           %Reading the third line
a=strfind(line_3,'E');      %Finding the location of 'E' in the string
a11=str2double(line_3(1:a(1)+3));       %converting and storing the coefficients w.r.t the position of 'E'
a12=str2double(line_3(a(1)+4:a(2)+3));
a13=str2double(line_3(a(2)+4:a(3)+3));
a14=str2double(line_3(a(3)+4:a(4)+3));


T=linspace(local_low_temp,local_high_temp,500); %dividing temperature between local low and high to 500 points
R=8.314;            %defining the value of universal gas constant

c_p=specific_heat(a1,a2,a3,a4,a5,a8,a9,a10,a11,a12,local_mid_temp,R,T); %function for specific heat

H=enthalpy(a1,a2,a3,a4,a5,a6,a8,a9,a10,a11,a12,a13,local_high_temp,R,T);  %function for enthalpy

S_e=entropy(a1,a2,a3,a4,a5,a7,a8,a9,a10,a11,a12,a14,local_mid_temp,R,T);   %function for entropy

mol_weight=Molecular_Weight(species_name);   %function for molecular weight

if not(isfolder(species_name)) %checking if the folder already exist, if not, will create the folder with species name
mkdir(species_name)
end
cd(species_name) %changingthe directory to the folder with current species name


figure(1) %plot for Temp vs cp
plot(T,c_p)
title('temperature vs specific heat',species_name)
xlabel('temperature')
ylabel('specific_heat')
grid on

figure(2)  %plot for Temp vs H
plot(T,H)
title('temperature vs enthalpy',species_name)
xlabel('temperature')
ylabel('enthalpy')
grid on

figure(3)  %plot for Temp vs S
plot(T,S_e)
title('temperature vs entropy',species_name)
xlabel('temperature')
ylabel('entropy')
grid on


saveas(1,'specific heat.jpg') %saving the figures in .jpg format
saveas(2,'entahlpy.jpg')
saveas(3,'entropy.jpg')
cd('C:\Users\Midhun\OneDrive\Desktop\Skill lync HEV\MATLAB for Mechanical Engnrs\programs\NASA File Parsing') %changing back to parent dorectory

disp(['molecular weight of',' ',species_name,' ', 'is']) %displaying the value of molecular weight in command window.
disp(mol_weight)
end

%End of code
The function for calculating specific heat is
function[c_p]=specific_heat(a1,a2,a3,a4,a5,a8,a9,a10,a11,a12,local_mid_temp,R,T)

if T>local_mid_temp
    c_p=R*(a1+a2*T+a3*T.^2+a4*T.^3+a5*T.^5);
else
  c_p=R*(a8+a9*T+a10*T.^2+a11*T.^3+a12*T.^5);
end
The function for calculating enthalpy is
function[H]=enthalpy(a1,a2,a3,a4,a5,a6,a8,a9,a10,a11,a12,a13,local_mid_temp,R,T)
if T>local_mid_temp
    H=R*T*(a1+a2*T./2+a3*(T.^2)/3+a4*(T.^3)/4+a5*(T.^5)/5+a6./T);
else
  H=R*T.*(a8+a9*T./2+a10*(T.^2)./3+a11*(T.^3)./4+a12*(T.^5)./5+a13./T);
end
The function for calculating entropy is
function[S_e]=entropy(a1,a2,a3,a4,a5,a7,a8,a9,a10,a11,a12,a14,local_mid_temp,R,T)
if T>local_mid_temp
    S_e=R*(a1*log(T)+a2*T+a3*(T.^2)/2+a4*(T.^3)/3+a5*(T.^4)./4+a7);
else
    S_e=R*(a8*log(T)+a9*T+a10*(T.^2)/2+a11*(T.^3)./3+a12*(T.^4)./4+a14);
end
The function for calculating molecular weight is
function[mol_weight]=Molecular_Weight(species_name)

elements=['H','C','N','O','S','AR'];
atomic_weight=[1.007,12.011,14.0067,15.999,32.065,39.948];
mol_weight=0;
for i=1:length(species_name)
    for j=1:length(elements)
        if strcmp(species_name(i),elements(j))
            mol_weight=mol_weight+atomic_weight(j);
            w=j;
        end
    end

n=str2double(species_name(i));
if n>1

    mol_weight= mol_weight+atomic_weight(w)*(n-1);
end
end
ERROR OBSERVED
1.
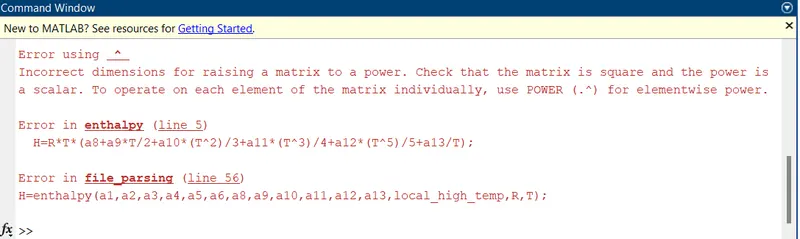
Error occured since temperature T is a matrix and dot operation is to be used. Error cleared by changing the operations.
2.
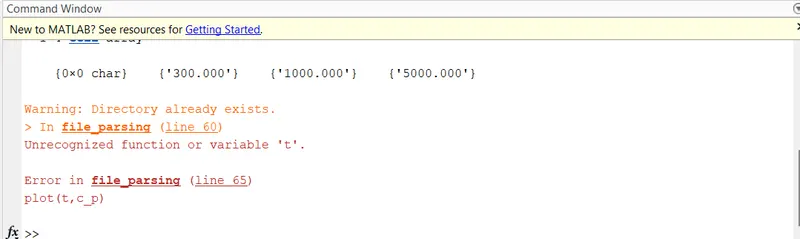
The error occured since 't' is used in the plot command instead of 'T'.
3.
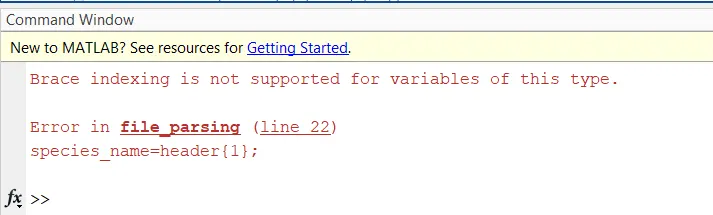
This error is observed since header is assigned to species name and header is complete line before splitting. Issue is solved by splitting the string and then assigning the first value to the species string.
4.
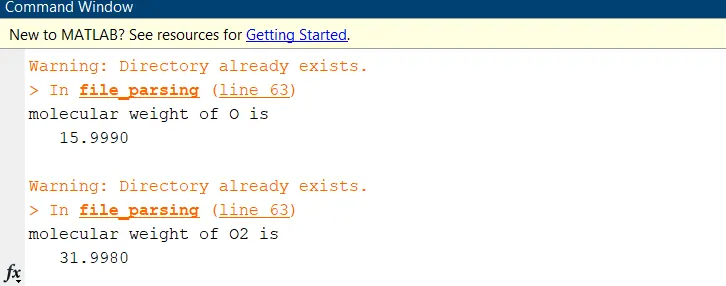
The warning for the directory keeps on coming since the folders are already exist and the code tries to create them again. This is solved by using a ifnot loop and isfolder command to check if the folder is present in the current folder and if the folder is not there, then only create the folder.
RESULTS
1. O2
2. N2
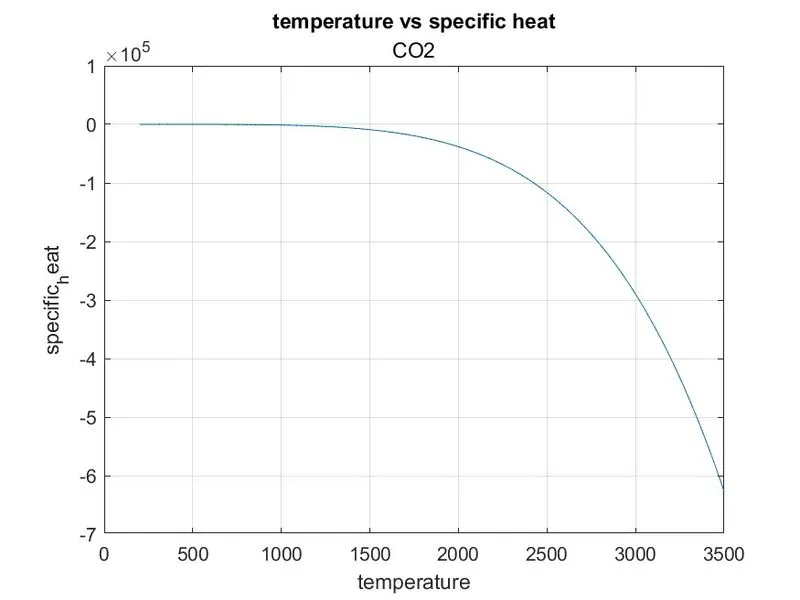
3. CO2
4. The command window showing molecular weight
5. The folders created with species names

REFERENCES
Calculating Thermochemical Properties Using The 7 Term NASA Polynomials - My Engineering World
How to check if a directory(folder) exists? - (mathworks.com)