Week - 4
AIM:
- Implement control logic of a “washing machine” using Stateflow as per given sequence:
- If the power supply is available, the system gets activated
- If the Water supply is not available, stop the process & indicate through LED
- Soaking time should be 200s followed by Washing time of 100s.
- Then rinsing happens for next 20s & dryer runs for 50s.
- After all the processes have completed turn on the finished LED
2. Make a Simulink chart for the “Gear shift” logic as per below conditions:
Speed Range(kmph) Gear
0 to 15 1
16 to 25 2
26 to 40 3
41 to 60 4
Above 61 5
Give speed input while the simulation is running & display the gear number.
THEORY:
1). Control Logic:
- Control logic is a paramount part of a software program that controls the operations of the program. The control logic answers to commands from the user, and it also acts on its own to execute automated tasks that have been structured into the program.
- It is also known as the controller and is part of the underlying software architecture developed at the same time that the program is designed and coded.
- Control logic can be modelled using a state diagram, which is a form of a hierarchical state machine. These state diagrams can also be merged with flow charts to provide a set of computational semantics for describing complex control logic.
- Control logic is the part of a controller that defines how a reactive system responds to events or conditional changes.
Applications for control logic includes:
- Supervising how to switch between distinct modes of operation.
- Plan a succession of tasks for a given
- Undergoing fault detection, isolation, and recovery logic
Common tasks for modelling control logic includes:
- Modelling hierarchical state machines for large-scale
- Adding flow charts to depict complex control logic.
- Specifying orthogonal states to illustrate systems with parallelism.
2). Finite State Machine:
- Finite state machine (FSM) is a formulation used to describe the processes during which information or tasks move from one state to another for action, according to the set of files.
- A state of transition diagram is a graphical represntation of a finite state machine.
3). Stateflow:
- 'States'and 'transitions' form the basic building blocks of a sequential logic syst
- Stateflow provides a graphical language that includesstate transition diagrams, flow charts, state transition tables, and truth tab
- We can use Stateflow to describe how MATLAB algorithms and Simulink models react to input signals, events, and time-based conditi
- A Stateflow chart can utilize MATLAB or C as the action language to implement the control We can also represent stateless flow charts.
Applications:
- Stateflow enables us to design and develop supervisory control, task scheduling, fault management, communication protocols, user interfaces, hybrid systems, etc.
Now, let us get familiar with some of the primary terms.
- States - One of the key concepts in computer programming is the idea of a state that is essentially a snapshot of the measure of various conditions in the A state stores information about the past, that is, a state reflects the input changes from the system start to the present moment.
- Action - An action is a description of the activity in a control system that is to be performed at a given moment, and has an influence on something. In some cases, one action can include several sub-activities.
- Transition - A transition indicates a change between states and is described by a condition that is needed to be fullfilled to enable the transition.
ANSWERS:
PART 1: Explanation for control logic of a “washing machine” using Stateflow.
Washing Machine:
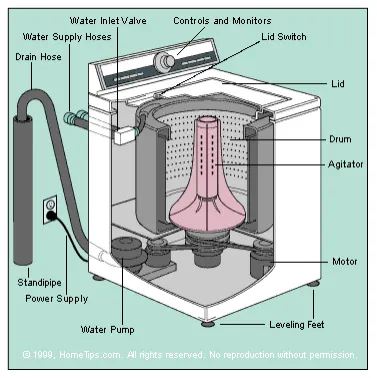
- Washing machine is the machine used to wash the various types of clothes without applying any physical efforts. It is a machine which is capable of handling various tasks like soaking, washing, rinsing, drying within a short period of time all the task performed by machine is based on the centrifugation.
- The washing machine automatically takes in the amount of water and detergent required and it also automatically sets the timer for washing, rinsing and drying as per the selected mode and the amount of clothes.
- It is a separation process that used centrifugal force to promote accelerated settling of the particle in the solid or liquid mixture.
Input Conditions:
The different states of washing machines
- Soaking - 200 seconds
- Washing - 100 seconds
- Rinsing - 20 seconds
- Drying/Spinning - 50 seconds
- Finish/Stop
Blocks used in the Model:
- Stateflow chart - For showing control logic in the washing machine model.
- Display Block - It is used to display the output result of given logic.
- Constant block - Used to give any fixed or constant value.
- Toggle Switch - It toggles the value of the connected block parameter between two values during simulation.
- Lamp - Display a color that reflects an input value.
Stateflow Logic chart:
EXPLANATION:
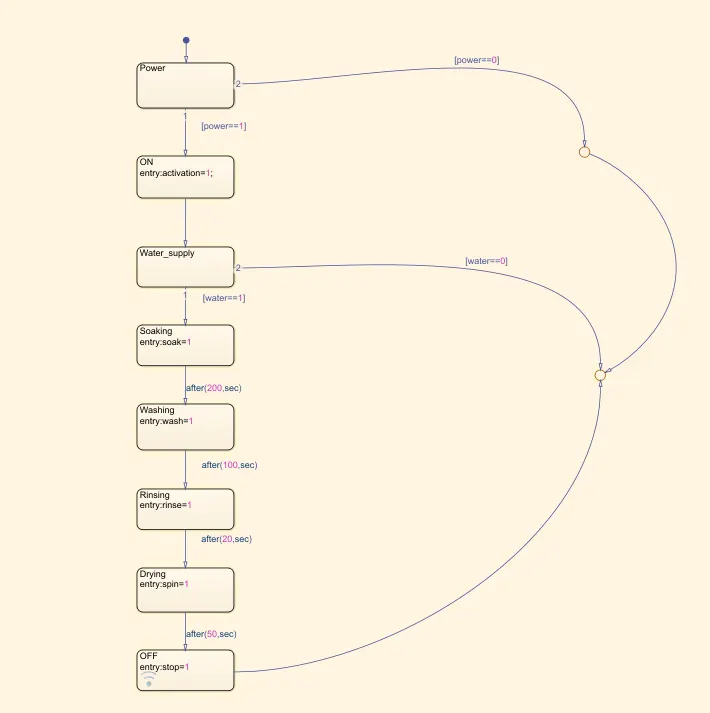
- Initially, we have created power state and after going through the power state, we have applied one condition [power==1] means if power is there, it goes to second state (ON state).
- If power is not detected, means it goes through condition [power==0], and it further goes to OFF state condition.
- As soons as power is detected, second state(ON state) got activated and it goes to third state i.e. Water_supply.
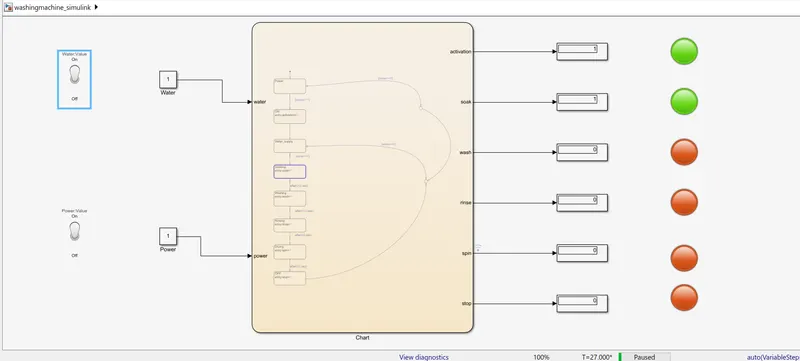
- After going through the third state(Water_supply), it goes through water condition. That means, if [water==1] condition satisfied, then it goes to soaking state for soaking operation for 200 sec. If [water==0] condition got satisfied, then it goes to OFF mode where machine stopped and stop lamp got activated.
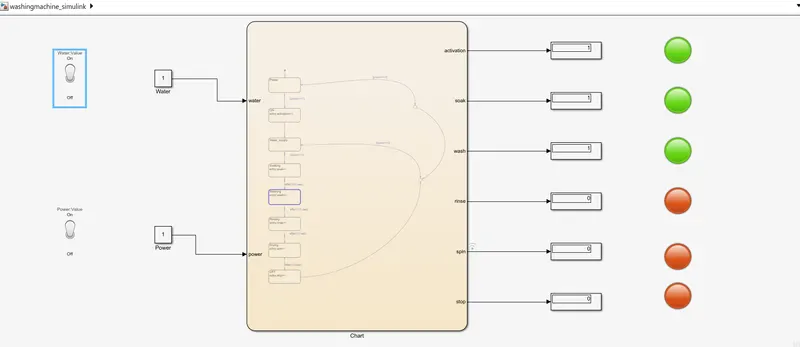
- When soaking operation done for 200 sec, it got shifted to washing state and washing is done for 100 sec.
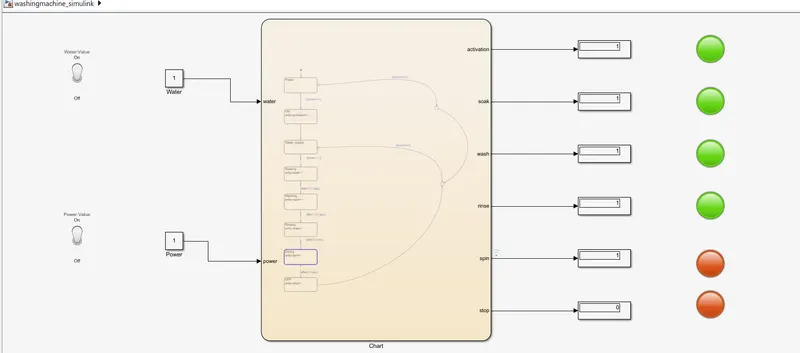
- After washing state, it goes to rinsing state for 20 sec where rinsing operation works.
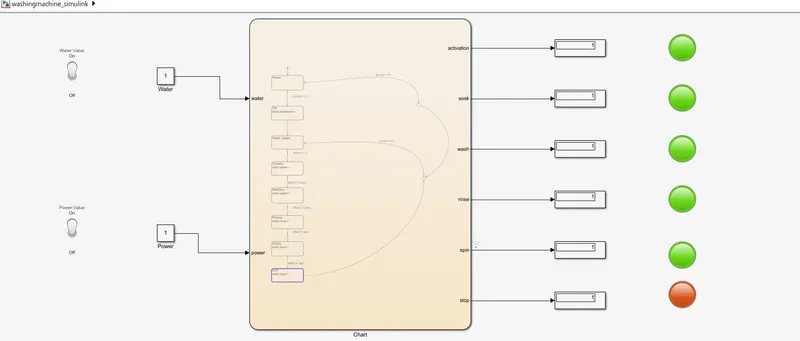
- After rinsing state got completed, it goes to drying/spinning state for 50 sec where spinning/drying process works for drying the clothes.
- After drying / spinning state got completed, then machine goes to OFF state confirming it has follwed all the washing steps and washing got completed for clothes and machine got stopped.
Simulink Model:
Before running the model
Steps:
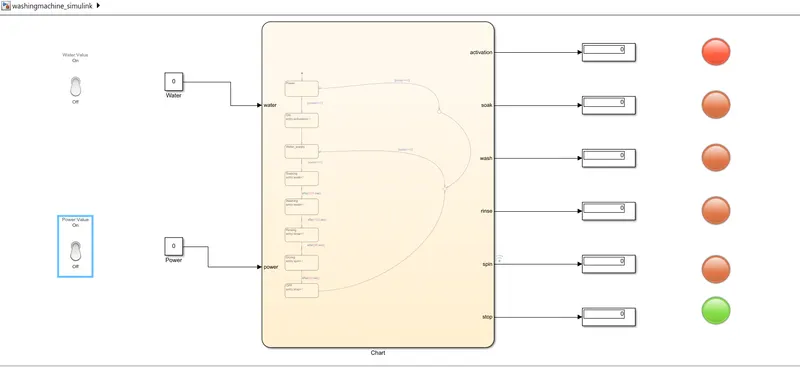
1. Power and Water supply given to the Washing machine are dependent upon the toggle switch conditions which is on or off and it is defined by the constant value 0 or 1.
2. The signal is then given to above state flow logic. If the value displayed isl for the power and water supply block then water and power supply will be given to Washing machine.
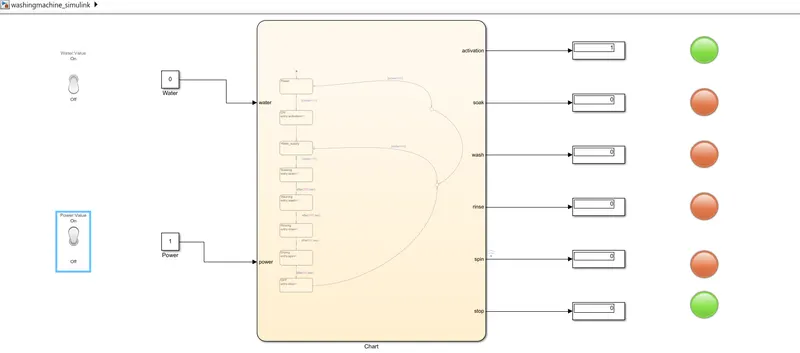
3. If the value is 0 and 1 for water and power supply respectively, then the machine will start however, the machine won't execute any washing process as one of the switches are off. It means that machine detects that water supply is not available and goes to OFF state to turn OFF the machine.
4. Also, if the value is 0 for water and power supplt respectively, then the machine will not even start because of no power input was provided.
5. When both power and water supply are at 1 then the soaking process starts and run for 200 sec, after this washing process will start and it lasts for further 100 sec.
6. Thereafter, the rinsing process starts and lasts for 20 sec. Thereafter, the drying process is started for 50 sec which the water supply is cut off and drying of clothes will execute.
7. After completing all the washing tasks, the washing machine goes to OFF state indicating that all tasks completed and turns off the machine and stop lamp got activated.
8. For all the different process or states of the machine, the lamp indicates green for working and red for not working. However, for stop process (OFF state) we have given red color as true condition. So, that when machine goes to OFF state. This all gives a better idea to user, now which process is going on in the Washing machine.
Different working condition of the washing machine:
1). Water supply OFF and Power OFF
2). Water supply OFF and Power ON
3). Soaking
4). Washing
5). Rinsing
6). Drying
PART 2: Simulink chart for the “Gear shift” logic
THEORY:
- A Gear stick/Gear lever/Gearshift or shifter, more formally known as a transmission lever, is a metal lever attached to the transmission of an
- The term Gear stick mostly refers to the shift lever of a manual transmission, while in an automatic transmission, a similar lever is known as a gear
- A gear stick will normally be used to change gear whilst depressing the clutch pedal with the left foot to disengage the engine from the drivetrain and wheels. Automatic transmission vehicles, including hydraulic (torque converter) automatic transmissions, automated manual and older semi-automatic transmissions (specifically clutchless manuals), like VW Autostick, and those with continuously variable transmissions, do not require a physical clutch pedal.
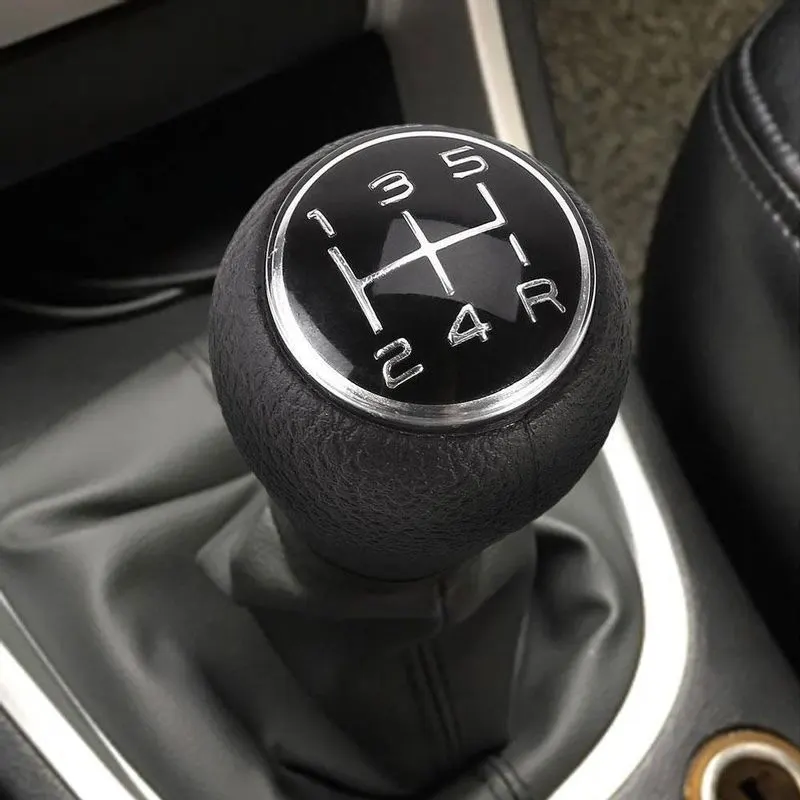
- A knob, variously called Gear knob, shift knob, gear shift knob or stick shift knob, forms the handle for the gear Typically the gear knob includes a diagram (shown in fig.2) of the shift pattern of the gear selection system, i.e. the positions to which the gear stick should be moved when selecting a gear.
- This shift pattern is the most common five-speed shift This layout is reasonably intuitive because it starts at the upper left and works left to right, top to bottom, with reverse at the end of the sequence and toward the rear of the car.
Input conditions given for Gear-shifting model :-
|
Speed |
Gear |
|
0-15 |
1 |
|
16-25 |
2 |
|
26-40 |
3 |
|
41-60 |
4 |
|
60-onwards |
5 |
Blocks used in the model:
- Slider - It is used to tune the values of the connected block parameter during simulation.
- Constant block - Provides fixed values
- Display - It is used to display the output values of the model.
- Scope - Used to visualize output waveform.
- Vertical Slider Block - It is used to to deflect the gear number.
Stateflow Chart :
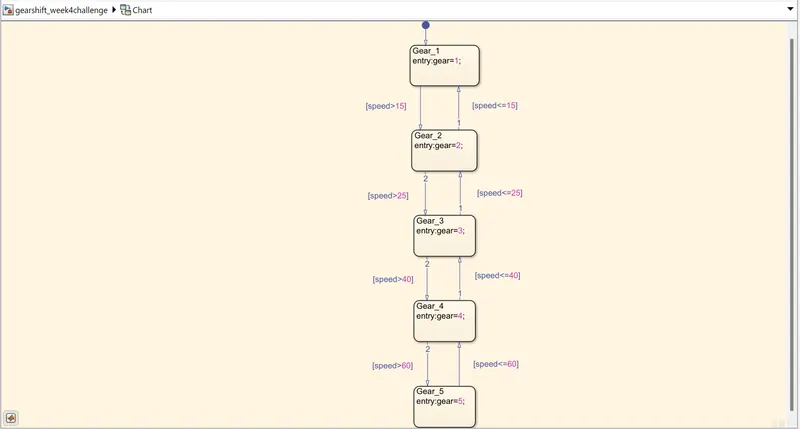
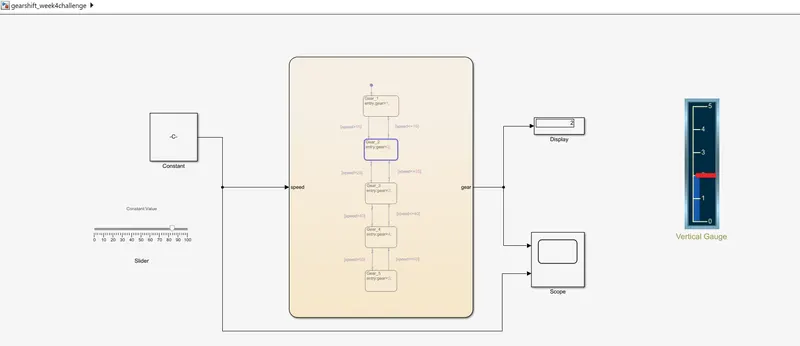
- Initially, we have created first state(Gear_1) and in this, we have given a condition such that if input speed>15 then the gear got shifted to second gear. That means, if (speed<=15) condition satisfied then the car remains in the first gear only.
- When the (speed >15 condition) got satisfied then the car got shifted to second gear(Gear_2 state). Then the car remains in the second gear until speed goes above 25 unit.
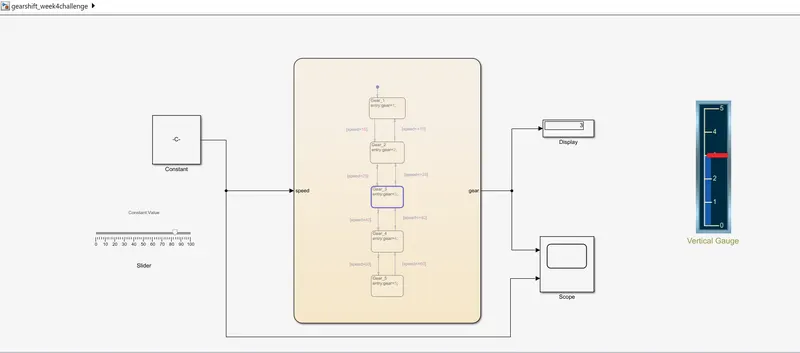
- When (speed >25 condition) got satisfied then the car shifted to third state(Gear_3). Further, if speed falls to 25 and below 25 unit, the car got again shifted to second gear.
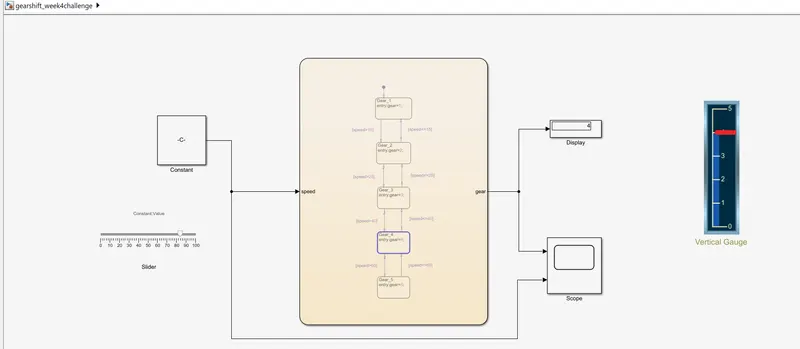
- Furthermore, if (speed >40 condition) got satisfied then the car shifted to fourth state(Gear_4). Further, if speed falls to 40 and below 40 unit, the car got again shifted to third gear.
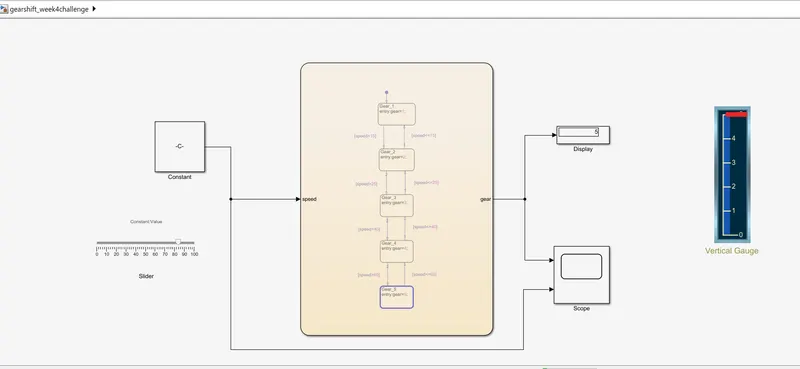
- Also,if (speed >60 condition) got satisfied then the car shifted to fifth state(Gear_5). Further, if speed falls to 60 and below 60 unit, the car got again shifted to fourth gear.
- If the speed remains to be higher/greater than 60 unit then the car will remain in fifth gear only untill there is any drop in speed of the car.
Simulink Model:
EXPLANATION:
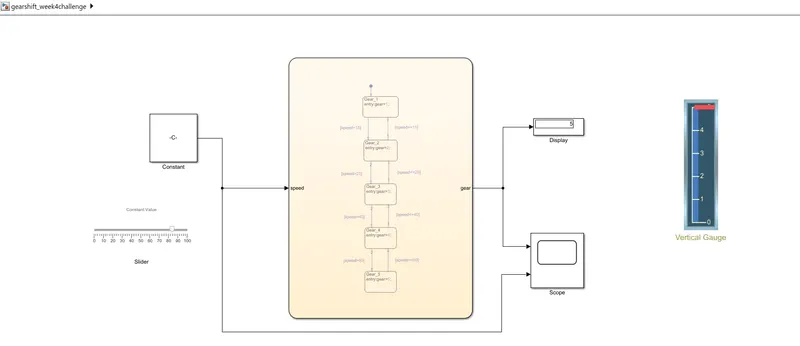
- Initially, we have taken Slider block so that we can vary our speed input during simulation.
- We have connected the slider block to the constant block(speed) and that block is further connected to contol logic so that gear shifting of car can be achieved by varying the speed input.
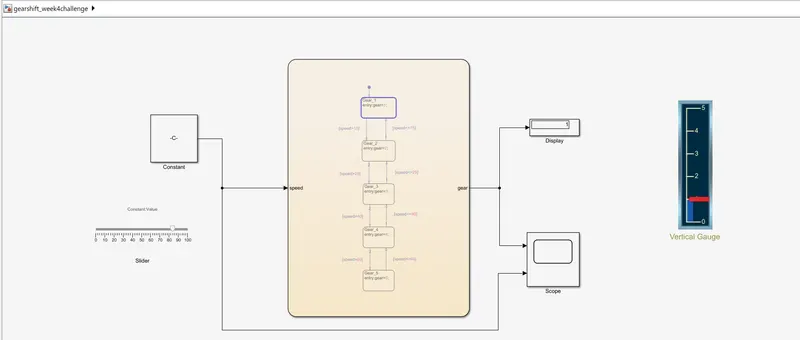
- Hence, when we increase the speed by moving the slider then automatically as per our control logic and given condition, the corresponding gear number was displayed at the output. We have used display block at the output of control logic chart to record the gear number for particular instance of speed.
- Further, we have also used vertical gauge block and renamed as gear shifting indicator. We have internally connected that Gear shifting indicator block to display block so that gear number can be correspondingly deflected.
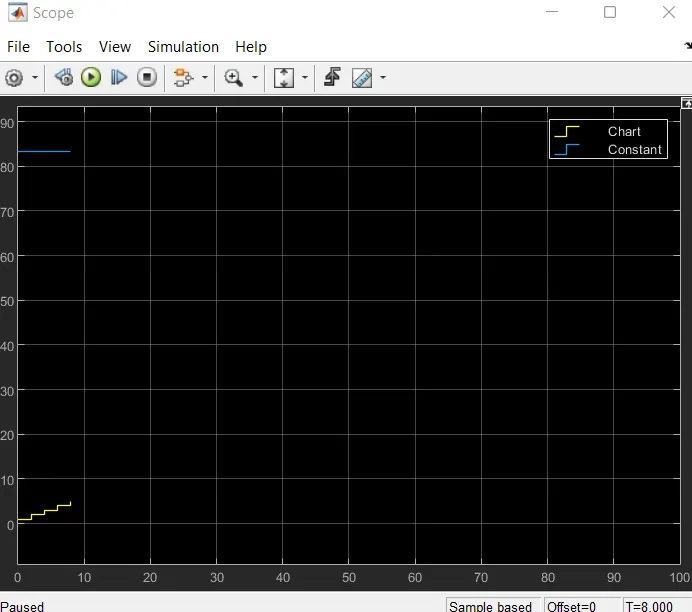
- Also, we have used scope block to visualise the output(i.e. Gear number & input i.e. Speed).
For Gear 1
For Gear 2:
For Gear 3:
For Gear 4:
For Gear 5:
Output Graph:
Conclusion:
From the above graph we observed the gear shifting of the car took place as per the given speed condition.