Week 4.1 - Genetic Algorithm
AIM:
To study about Genetic algorithm and to calculate the global maxima of Stalagmite function using MATLAB
OBJECTIVE:
- To write a code in Matlab to optimise the Stalagmite function and find the global maxima of the function
PROGRAMME:
1).Stalagmite function
function [f] = stalagmite(input_vector)

x = input_vector(1);
y = input_vector(2);

f1 = (sin(5.1*pi*x+0.5))^6;
f2 = (sin(5.1*pi*y+0.5)).^6;
f3 = exp(-4*log(2)*((x-0.0667)^2)/0.64);
f4 = exp(-4*log(2)*((y-0.0667)^2)/0.64);

f = -(f1*f2*f3*f4);

end
2). Programme to find the Global maxima
clear all
close all
clc

% x array
x = linspace(0,0.6,150);
% y array
y = linspace(0,0.6,150);
% Number of cases
n = 50;

% Creating a 2D mesh
[xx, yy] = meshgrid(x,y);

% Evaluating a Stalagmite function
for i = 1:length(xx)
    for j = 1:length(yy)
        input_vector(1) = xx(i,j);
        input_vector(2) = yy(i,j);
        f(i,j) = stalagmite(input_vector);
    end
end

% Study 1 : Statstical Behaviour

tic
for i = 1:n
    [inputs,fopt(i)] =ga(@stalagmite,2);
    xopt(i) = inputs(1);
    yopt(i) = inputs(2);
end

study1_time = toc;

figure(1)
subplot(2,1,1)
hold on
surface(xx,yy,-f)
shading interp
xlabel('X-axis')
ylabel('Y-axis')
title('Statistical Behaviour with Unbound inputs')
plot3(xopt,yopt,-fopt,'Marker','o','MarkerSize',5,'MarkerFaceColor','r')
subplot(2,1,2)
plot(-fopt)
xlabel('No of Iterations')
ylabel('Function Maximum')

% Study2 : Stastical behaviour with upper and lower bounds

tic
for i = 1:n
    [inputs,fopt(i)] = ga(@stalagmite,2,[],[],[],[],[0;0],[1;1]);
    xopt(i) = inputs(1);
    yopt(i) = inputs(2);
end
study2_time = toc;

figure(2)
subplot(2,1,1)
hold on
surfc(xx,yy,-f)
shading interp
xlabel('X-axis')
ylabel('Y-axis')
title('Stastical behaviour with upper and lower bounds')
plot3(xopt,yopt,-fopt,'marker','o','MarkerSize',5,'MarkerFaceColor','r')
subplot(2,1,2)
plot(-fopt)
xlabel('No of Iterations')
ylabel('Function Maximum')

% Study3 : Stastical Behaviour with Increasing iterations of GA

options = optimoptions('ga');
options = optimoptions(options,'Populationsize',300);

tic
for i = 1:n
    [inputs,fopt(i)] = ga(@stalagmite,2,[],[],[],[],[0;0],[1;1],[],[],options);
    xopt(i) = inputs(1);
    yopt(i) = inputs(2);
end
study3_time = toc;

figure(3)
subplot(2,1,1)
hold on
surfc(xx,yy,-f)
shading interp
xlabel('X-axis')
ylabel('Y-axis')
title('Stastical Behaviour with Increasing iterations of GA')
plot3(xopt,yopt,-fopt,'marker','o','MarkerSize',5,'MarkerFaceColor','r')
subplot(2,1,2)
plot(-fopt)
xlabel('No of Iterations')
ylabel('Function Maximum')
EXPLANATION:
- X array and Y array are defined using the linspace command to create values at equal intervals
- 2D mesh of x and y arrays are created using MESHGRID command and the number of iterations code should perform is defined by the variable 'n'
- To define stalagmite function FOR loop is used, the input vector values of xx and yy are defined and stalagmite function for these input vectors are defined
- Following the inputs, now the results of the 3 cases of genetic algorithm should be calculated.
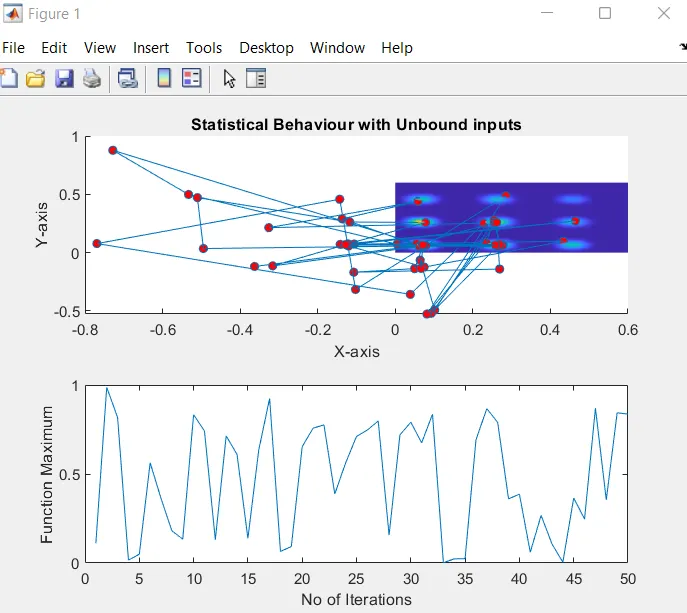
- In 1st case study the maximum value pf the function is calculated with no restrictions, no bounds and no limits, where as for loop is used and ga syntax is used to assign values for inputs and optimum max values.
- The stalagmite function is called in the ga syntax and number of variables are 2.
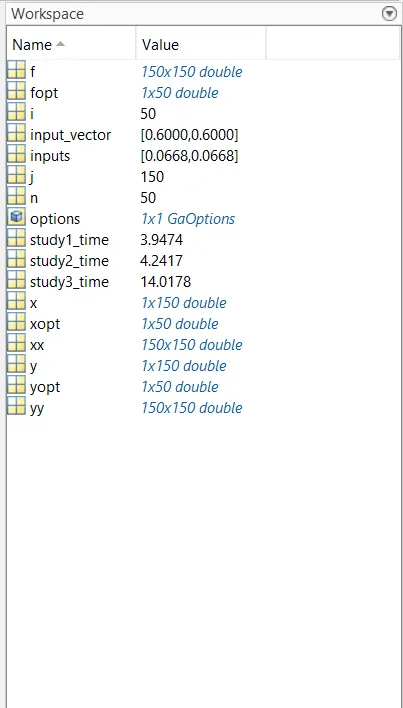
- To know the time taken for 50 iterations TIC and TOC commands are used before and after the for loops respectively
- The function is plotted using surfc command, to neglect the gridlness of the surface shading interp command is used and then followed by subplot which is used to plot multiple plots on same figure which divides the figure in grid of 2x1 and axes to be plavced at 1
- the plot3 command plots the 3D points at xopt, yopt and optimum value of the function with O shaped are red colour, then followed by values of optimum function 'fopt' are also polotted for 50 iterations.
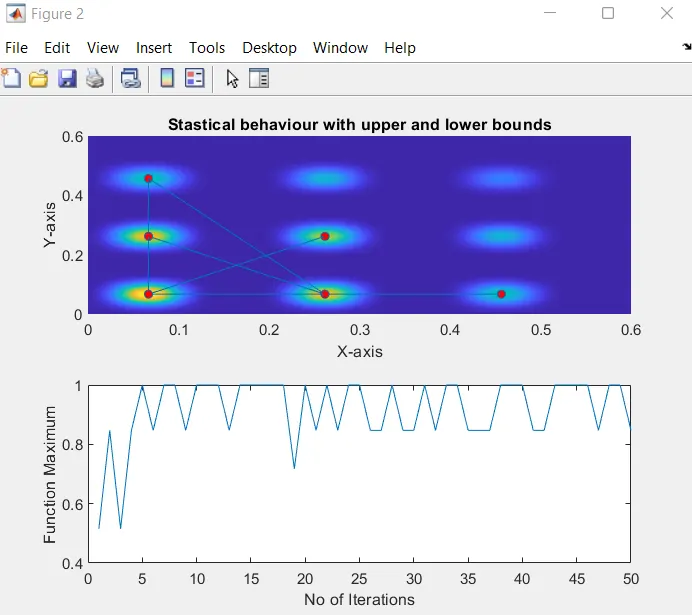
- The results of the above cases wll be different for each time and to get the same value we should restrict the programme with specific bounds namely upper and lower bounds.
- For the 2nd case the codding and plotting is same as of the 1st case, ga syntax is optimised by providing lower and upper limits.
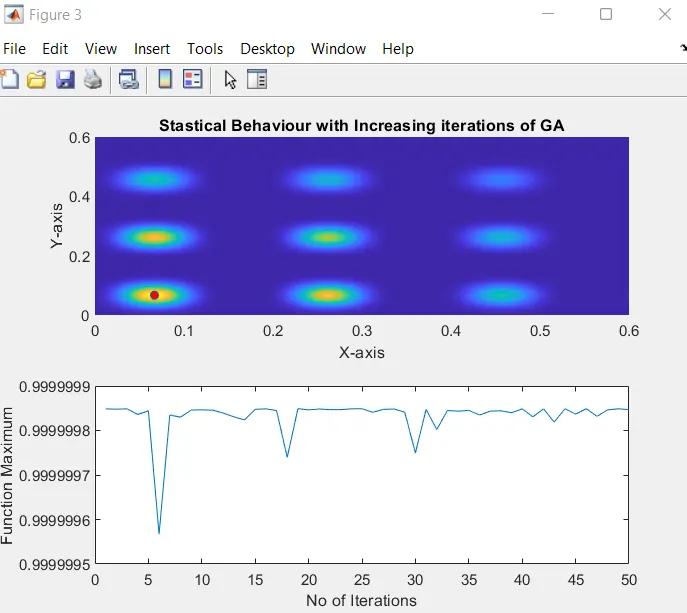
- For case 3 number of iterations is increased to 300, so the syntax, options = optimoptions('solver name','name','value) is used which returns with named parameter Population with altered values 300
- The syntax ga contains option term and the rest of the code is same for 1st and 2nd case.
ATTACHMENTS:
RESULTS:
Thus the the programme is coded to find the Global maxima by optimising the stalagmite function.