Week - 4
Task--> 1
Aim: - ‘To implement the control logic of a washing machine using state flow in Simulink’
Objectives:
- To implement the control logic of a washing using state flow as per given sequence,
- If the power supply is available the system gets activated.
- If the water supply is not available, stop the process & indicate the through LED.
- Soaking time should be 200s followed by Washing time of 100s.
- Then rinsing happens for next 20s & dryer runs for 50s
- After all the processes have completed turn on the finished LED.
Theory:
Centrifugation is a separation process which uses the action of centrifugal force to promote accelerated settling of particles in a solid-liquid mixture. The washing machine consists of centrifuge for this purpose. A centrifuge is a piece of equipment that puts an object in rotation around a fixed axis, applying a force perpendicular to the axis of spin that can be very strong.
Processes in Washing Machine
- Soaking
- Washing
- Rinsing
- Drying
MODEL: -
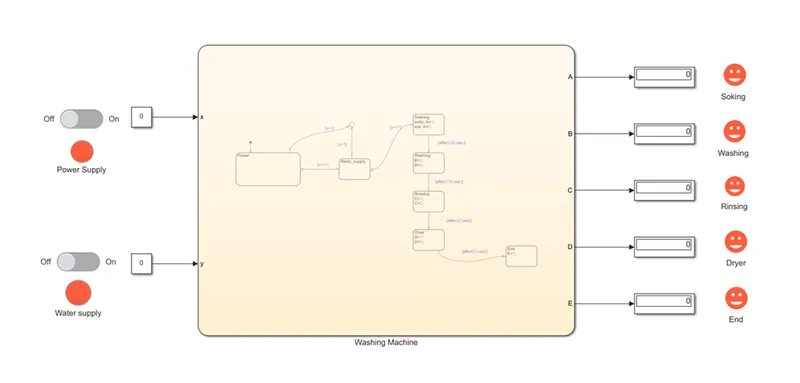
Chart Diagram: -
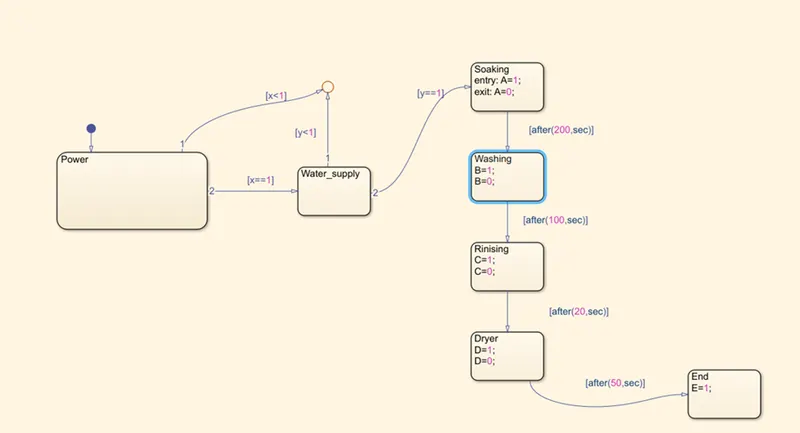
Parameters: -
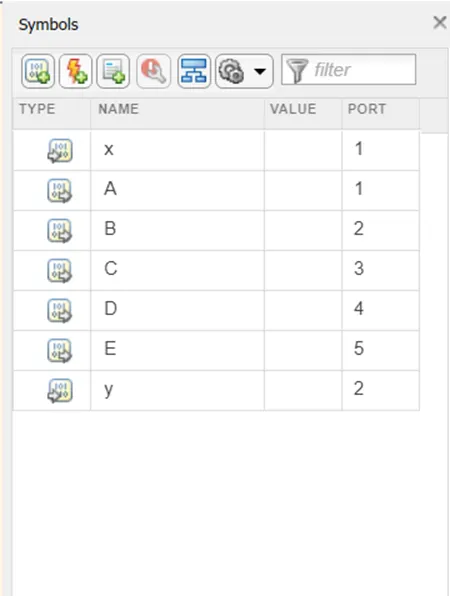
Blocks used,
- Chart
- Constant block
- Slider switch
- Displays
- Lamps
Description
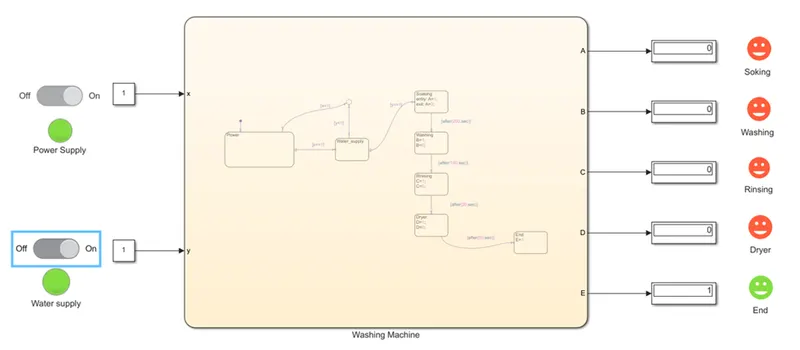
- Power and Switch inputs were controlled by the Switch block. These two inputs were directed to the Chart block.
- State blocks were used inside charts to create a state flow according to the given criteria.
- The POWER input is got as input in the chart and directed to the POWER State from there, if Power==1(Which is power supply in ON), it is directed to the next WATER block. or if Power==0 (Power supply is OFF), it directed to the junction.
- Next state is WATER and from that if Water==1(Water supply is ON) it moves to the next stage or if Water==0(Water supply is OFF) then it is directed to the junction.
- Next to water is SOAKING state, entry is given as 1, while exit is LED is made to glow which is connected to this state.
- After 200 sec, it is directed to Washing state, and after 100sec it is directed to Rinsing state and after 20sec, to Drying state and after 50sec, it is ended to End state.
Result
- If the water supply is not available, stop the process & indicate the through LED.
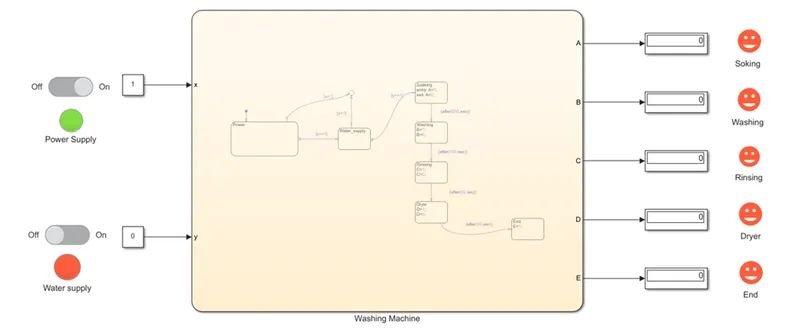
- After all the processes have completed turn on the finished LED.
Conclusion:
By above all result the simulation run successfully with all condition are satisfied. After the completion of the all process the finished LEB lamp was on
*****************************************************************************************************************************
*****************************************************************************************************************************
Task --> 2
Aim: - To make a Simulink chart for the “Gear shift” logic
Speed Range(kmph) Gear
0 to 15 1
16 to 25 2
26 to 40 3
41 to 60 4
Above 61 5
Give speed input while the simulation is running & display the gear number.
Theory: -
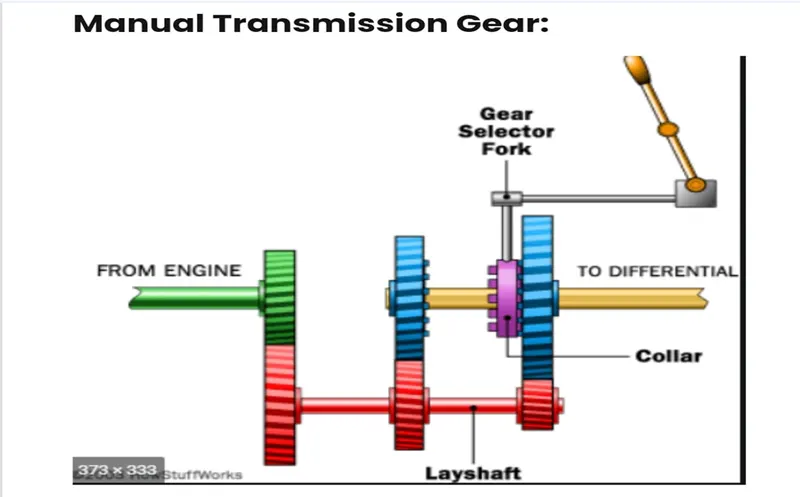
As shown in the above figure, Manual transmission has synchronous gears or continuously meshed gears are kept. (In Automatic Transmission Planetary gears are used) Based on the speed requirement the gear is shifted using the Gear knob, which in turn makes the collar gear to get meshed with the appropriate gears. The output shaft is connected to the collar gear, hence whichever gear gets meshed with the collar gear will be the output shaft.
During the gear shifting process, it is mandatory that the input shaft is disengaged from the engine. This is done with the help of the clutch plate (Torque convertor in case of the Automatic Transmission).
Model:-
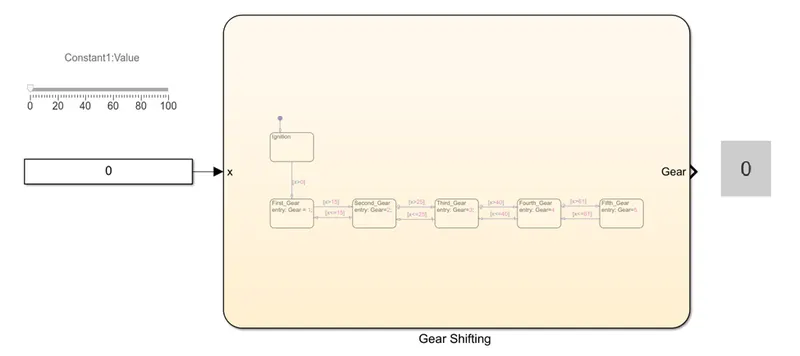
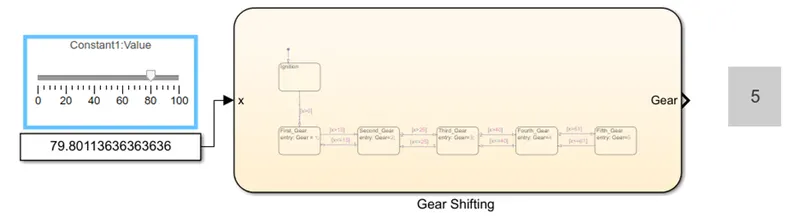
Chart Diagram: -
Blocks are used,
- Constant
- Chart
- Display
- Slider
Explanation:
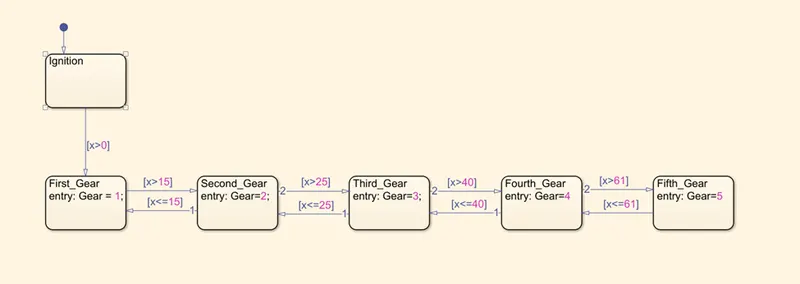
- For the gear shifting, we have used 'CHART BLOCK' to deny the gear shift logic for the conditions given above.
- First, we have defined 5 states namely 'Gear I', 'Gear 2', 'Gear 3', 'Gear 4', 'Gear 5'.
- Now to shift from one state to another we have defined the conditions of the speeds as mentioned above.
- We have also defined values inside the states which represent that when that particular state is going on it will display the value that is defined in it. This will help to see that which is gear is the vehicle when at a particular speed.
- We have defined speed as input for the chart as the gears change only on basis of speed and variable 'G1 till 5' is the defined output of the chart as it tells us, which gear is the vehicle in. That means if the input is matched for each gear, it is 1 and if not it 0.
- Now to give speed as input we have used a 'Signal Builder Block', where we have defined the different speeds.
7.Now according to these speeds, the gears in the chart block will change. To indicate this change in gears we have used display.
8.Now when we run the model, we get the above results, thus represents the shifts in gears at different speeds.
Result:
- 0 to 15 kmph in 1st gear
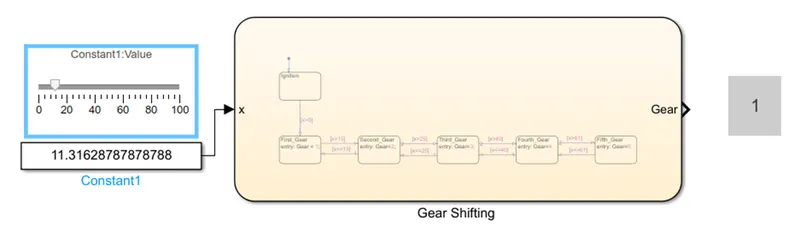
- 16 to 25 kmph in 2st gear
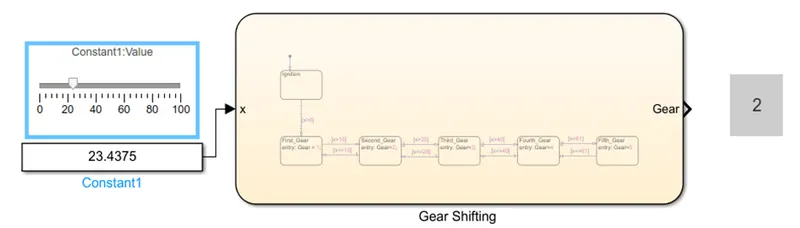
- 26 to 40 kmph in 3st gear
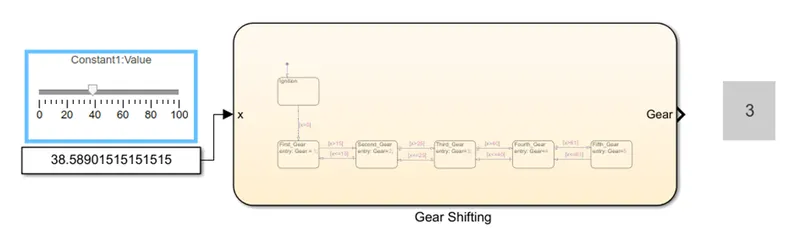
- 41 to 60 kmph in 4st gear
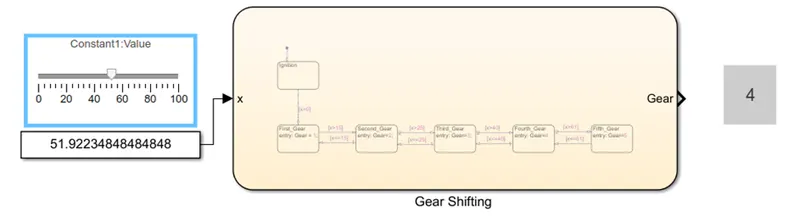
- Above 61 kmph in 5st gear
Conclusion:
By above all result the simulation run successfully with all condition are satisfied. The result will show after speed got changed the gear also changing,