Project 1 - Parsing NASA thermodynamic data
Aim:
- To write MATLAB program to extract the 14 co-efficient from NASA thermodynamic data file and to calculate the enthalpy, entropy and specific heat for all the species in the given date,
- To Plot the graphs of all species and find the molecular mass of each species,
- To Save the plots as images with appropriate names and dump them in separate folders for each species with suitable name.
Description:
- The FIRST 7 coefficients are HIGH-temperature coefficients and the SECOND 7 coefficients are LOW-temperature coefficients.
- Also use the LOCAL TEMPERATURE RANGES which is unique for each individual species, not the GLOBAL TEMPERATURE RANGE.
Formula used to calculate the enthalpy, entropy and specific heat,

where R = universal gas constant = 8.314
T = Temperature,
%% Writing code for Nasa data

close all
clear all
clc

% reading the header form thermo date
f1 = fopen ('THERMO.dat','r');
line1 = fgetl(f1);
% reading the header form the file
tline = fgetl(f1);
A = strsplit(tline,' ');
gobal_low_temp =  str2num(A{2});
gobal_mid_temp =  str2num(A{3});
gobal_high_temp =  str2num(A{4});

% reading the comments form the file
for i = 3:5
    comments_line = fgetl(f1);
end

for j = 1:53
    x = fgetl(f1);
    [species, remain] = strtok(x);
    local_temp = strfind(remain,'.');
    t1 = str2double(remain(local_temp(1)-4:local_temp(1)+3));
    t2 = str2double(remain(local_temp(3)-4:local_temp(3)+3));
    t3 = str2double(remain(local_temp(2)-4:local_temp(2)+3));

    %species name = strtok(a);
    l1 = fgetl(f1);
    l2 = fgetl(f1);
    l3 = fgetl(f1);
    sp1  = strfind(l1,'E');
    sp2  = strfind(l2,'E');
    sp3  = strfind(l3,'E');

    % high temprature co - effiicents
    a1 = str2double(l1(1:sp1(1)+3));
    a2= str2double(l1(sp1(1)+4:sp1(2)+3));
    a3= str2double(l1(sp1(2)+4:sp1(3)+3));
    a4= str2double(l1(sp1(3)+4:sp1(4)+3));
    a5= str2double(l1(sp1(4)+4:sp1(5)+3));
    a6 = str2double(l2(1:sp2(1)+3));
    a7= str2double(l2(sp2(1)+4:sp2(2)+3));

    % Low temprature co - effiicents
    a8= str2double(l2(sp2(2)+4:sp2(3)+3));
    a9= str2double(l2(sp2(3)+4:sp2(4)+3));
    a10= str2double(l2(sp2(4)+4:sp2(5)+3));
    a11 = str2double(l3(1:sp3(1)+3));
    a12= str2double(l3(sp3(1)+4:sp3(2)+3));
    a13= str2double(l3(sp3(2)+4:sp3(3)+3));
    a14= str2double(l3(sp3(3)+4:sp3(4)+3));


    % calulating the molecular weight

   molecular_weight = Mollweight(species);
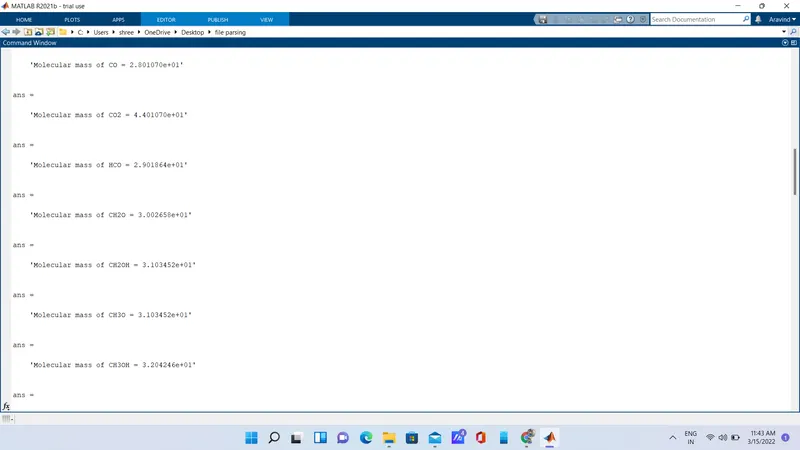
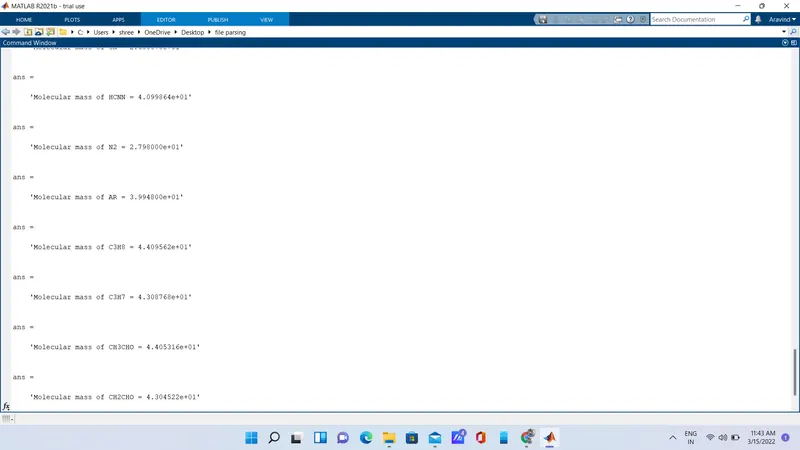
    sprintf('Molecular mass of %s = %d',species, molecular_weight)


    %% claculating the specific heat, enthalpy, and entropy
    %creating temprature array
    T = linspace(t1,t3,1000);
    R = 8.314;

    for k = 1:length(T)

        if T(k)>t2
            % high temp
            cp = (a1+a2.*T+a3.*T.^2+a4.*T.^3+a5.*T.^4)*R;
            H = (a1+(a2.*T)/2 + (a3.*T.^2)/3+(a4.*T.^3)/4+(a5.*T.^4)/5+(a6./T))*R.*T;
            S = a1.*log(T)+a2.*T+(a3.*T.^2)/2+(a4.*T.^3)/3+(a5.*T.^4)/4+ a7;
        else
            %low temp
            cp = (a8+a9.*T+a10.*T.^2+a11.*T.^3+a12.*T.^4)*R;
            H = (a8+(a9.*T)/2 + (a10.*T.^2)/3+(a11.*T.^3)/4+(a12.*T.^4)/5+(a13./T))*R.*T;
            S = a8.*log(T)+a9.*T+(a10.*T.^2)/2+(a11.*T.^3)/3+(a12.*T.^4)/4+ a14;

        end

    end
    %%ploting
    % Temprature V/S Specific heat
    figure(1)
    plot(T,cp,'LineWidth',3,'Color','g');
    title(species);
    xlabel('Temperature');
    ylabel('Specific Heat');
    grid on
    title(sprintf('Temprature V/S Specific heat for %s', species));

    % Temprature V/S Enthalpy
    figure(2)
    plot(T,H,'LineWidth',3,'Color','b');
    title(species);
    xlabel('Temperature');
    ylabel('Enthalpy');
    grid on
    title(sprintf('Temprature V/S Enthalpy for %s', species));

    % Temprature V/S Entropy
    figure(3)
    plot(T,S,'LineWidth',3,'Color','r');
    title(species);
    xlabel('Temperature');
    ylabel('Entropy');
    grid on
       title(sprintf('Temprature V/S Entropy for %s', species));
    mkdir(species)
    cd(species)

    saveas(1,'spheat.jpg');
    saveas(2,'enthalpy.jpg');
    saveas(3,'entropy.jpg');
    cd ..

end
fclose(f1)
Procedure of code written,
- Using the fopen command in read mode
- Sto open the NASA.dat file
- Fgetl command is used to get access the line in the file,
- To get the necessary information such as global temperature, strsplit command is used to split the all 3 temperatures, and it converted into numbers by using str2num command
- Loop is used to get header of the program, I,e. 3 line of the file,
- Extracting the local temperature for all species by creating the array,
- Loop are used to extract the date of the whole coefficient of polynomials, with help of the str2double command and with some basic command,
- Temperature array created to defined local low temperature to local high temperature,
- And given the R value as 8.314 (universal gas constant,
- Calculation done through the given formulas for cp,H,S,
- 3 different graphs are plotted for cp,H,S,
- Function is written for calculating the molecular wight of the whole species, strcmpi command is used to compare the strings,
Result,
molecular weight in cammond,
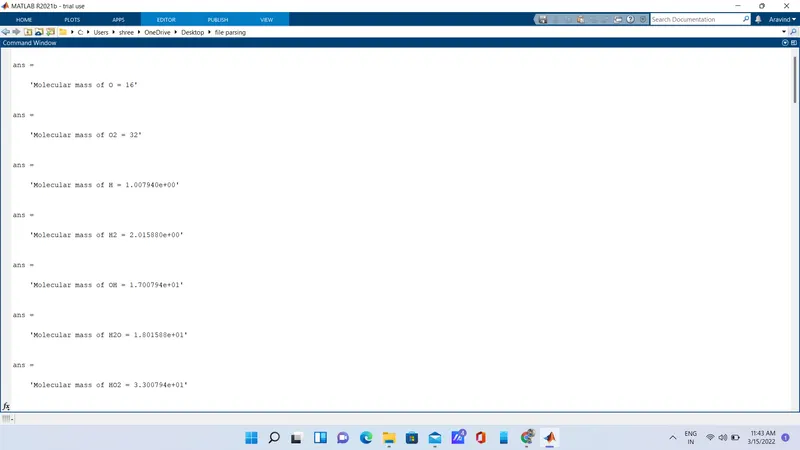
saved folder,

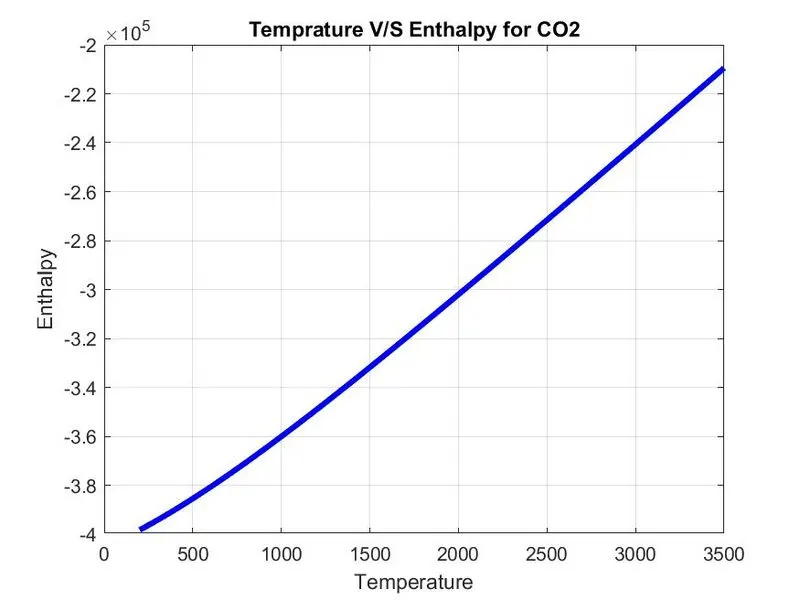
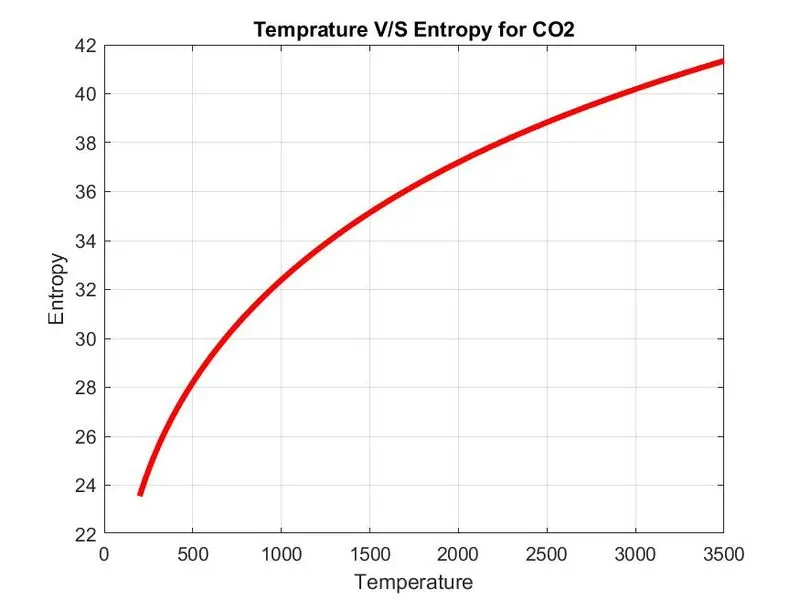
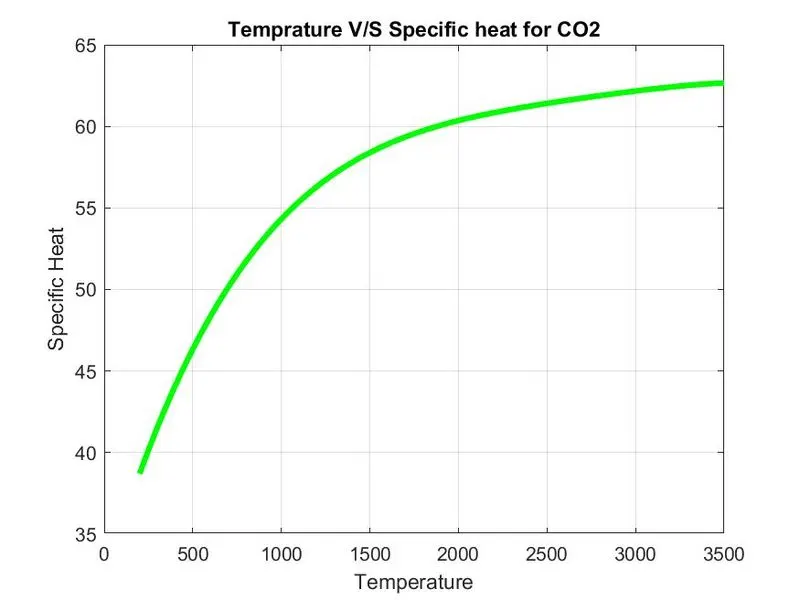
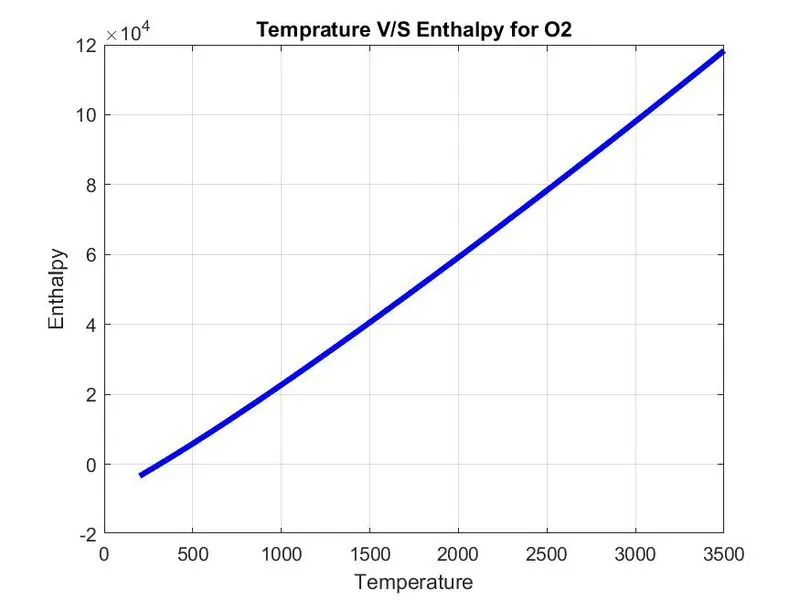
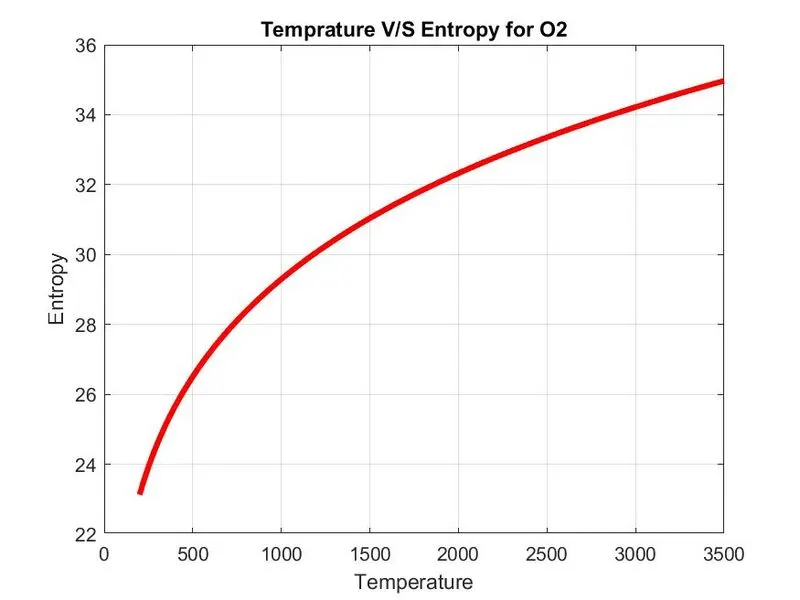
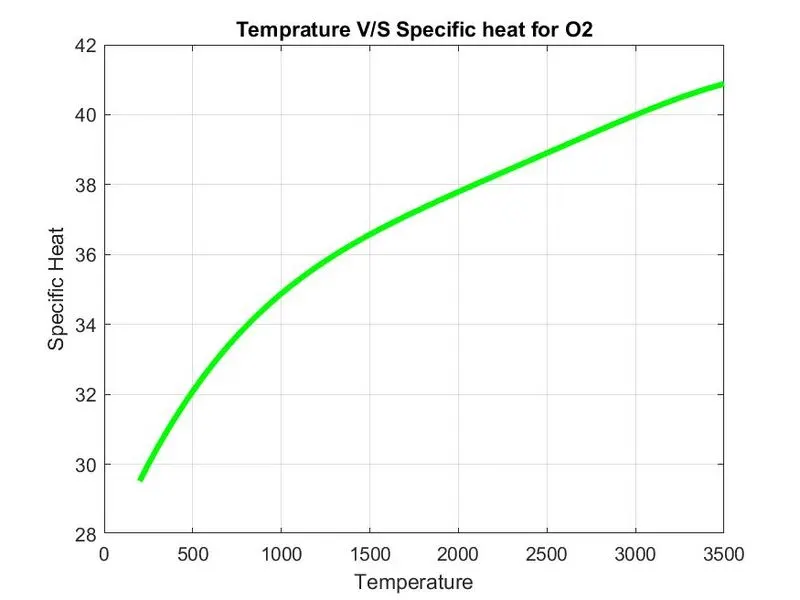
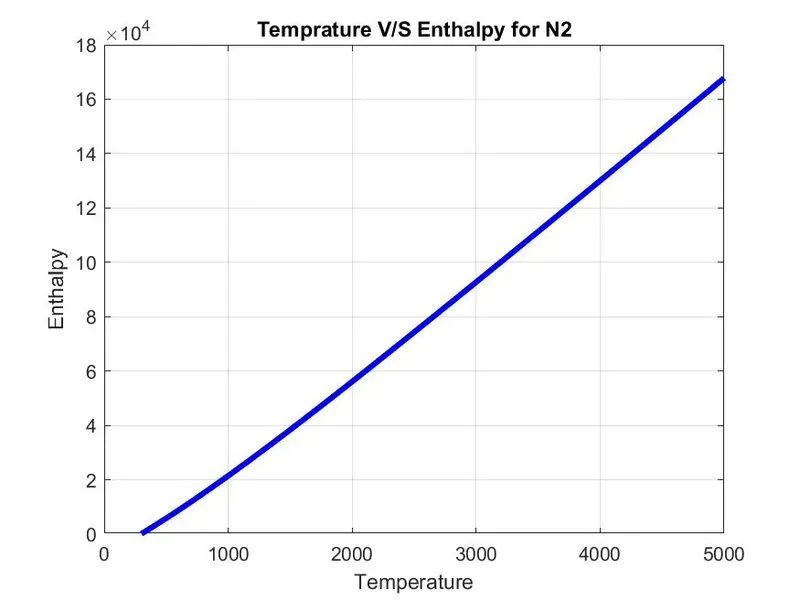
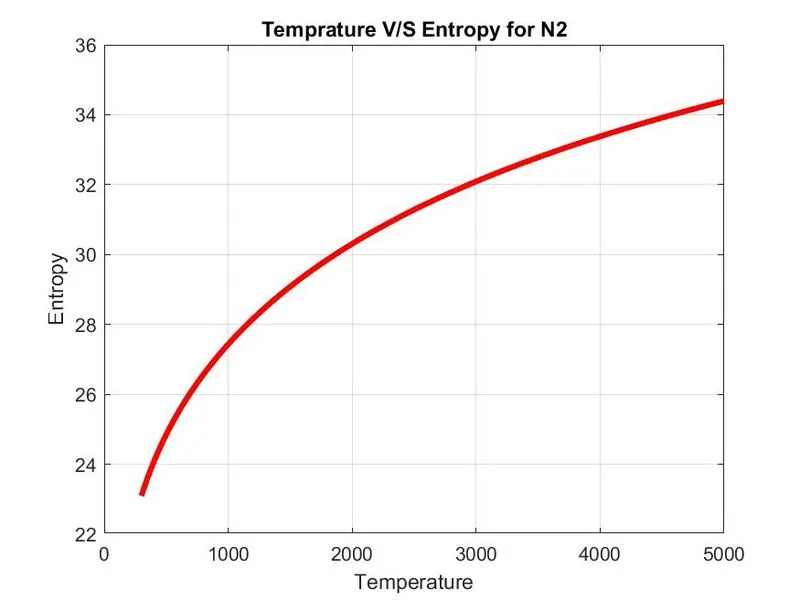
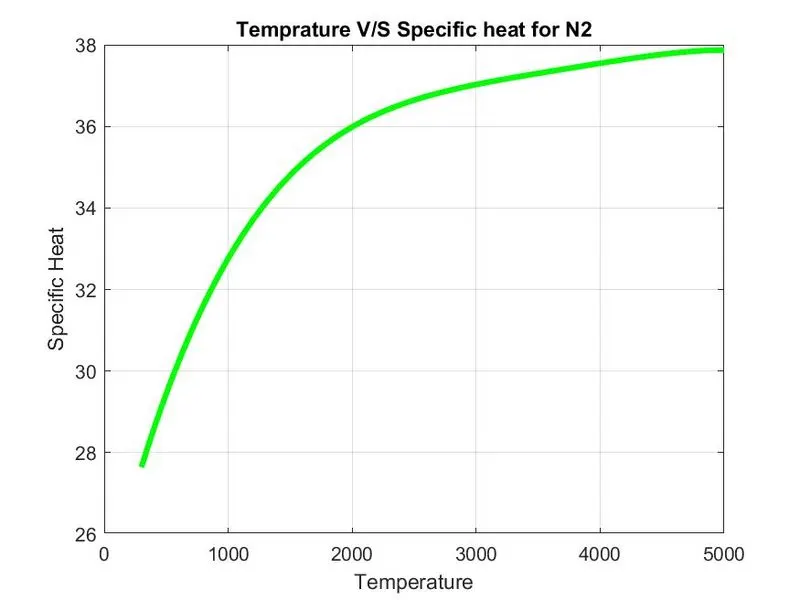
plotting result, o2, n2, co2
plots of O2
plots for N2
Plots of Co2