Week - 4
1. Logic control of washing machine using state flow
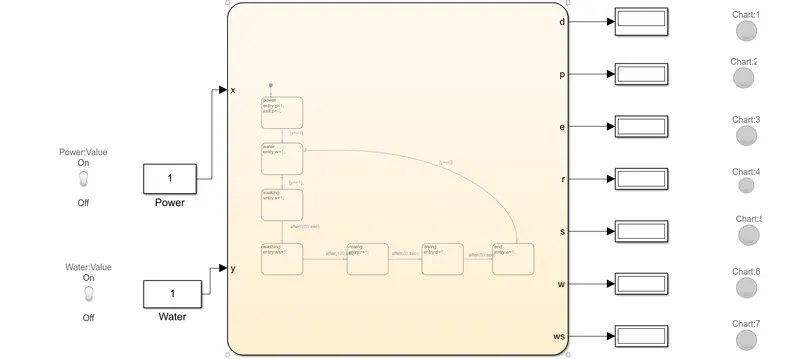
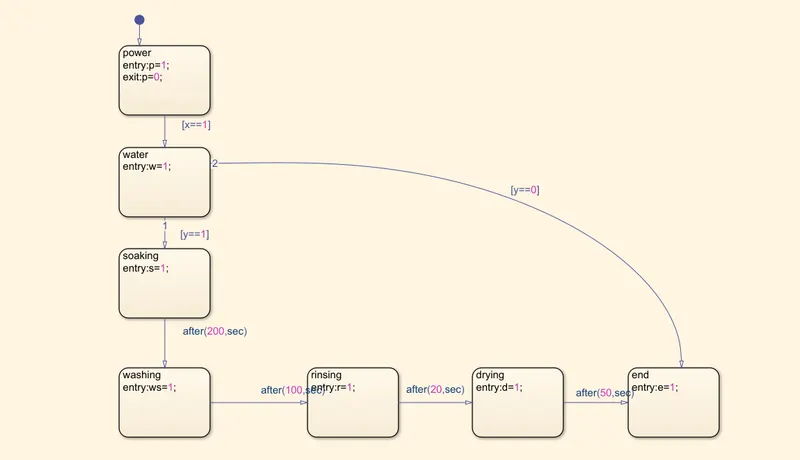
The above diagram shows the state flow of a different process.
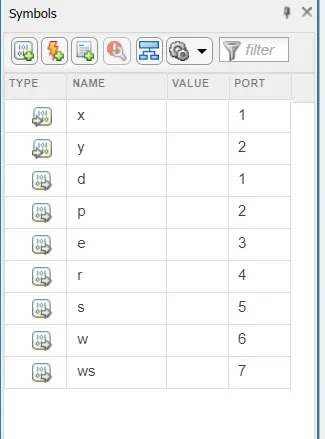
The above diagram shows that X and Y are input,d,p,e,r,s,w, was are output.
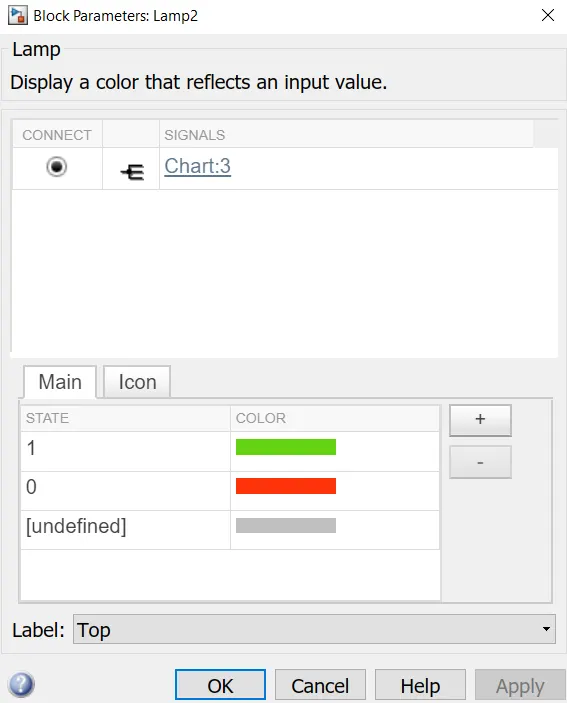
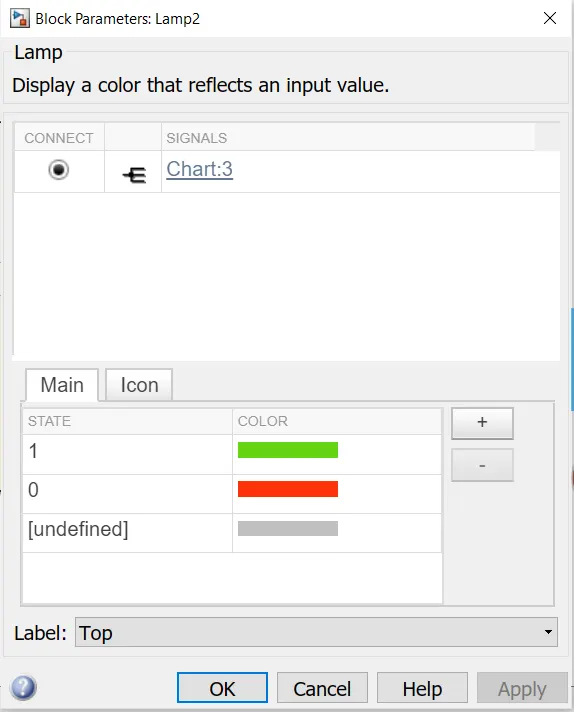
Above shows the condition of lamp when input 1 is give it shows green and when o is given as input red is shown.
OUTPUT -
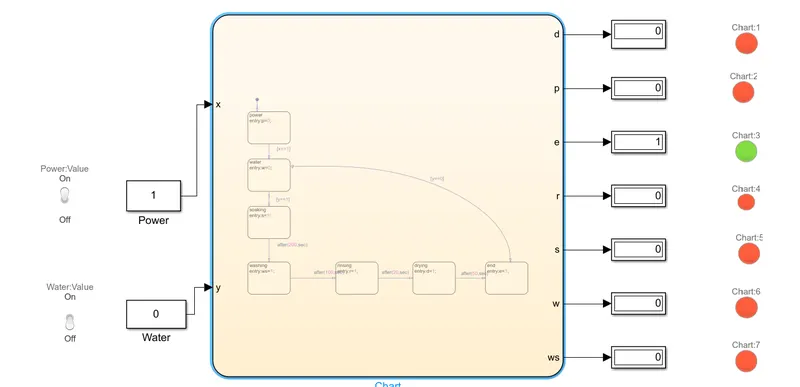
When the water supply not given the process will end which is shown in the diagram and is indicated by the green colour.
2. Simulink chart for the “Gear shift” logic as per condition
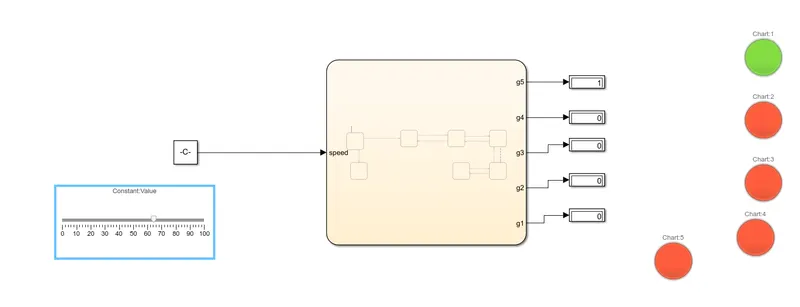
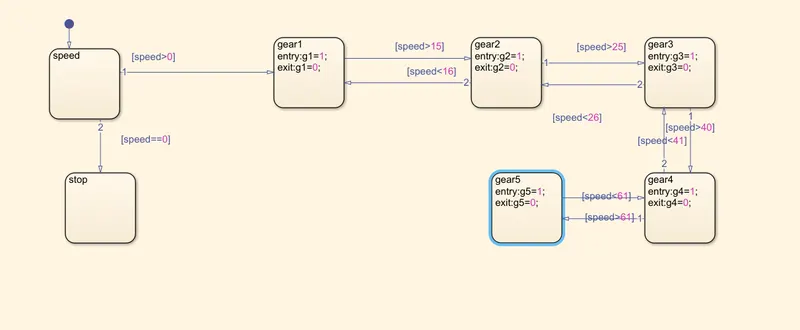
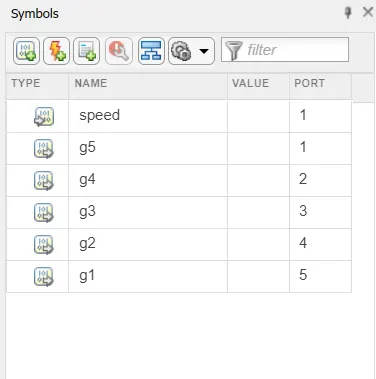
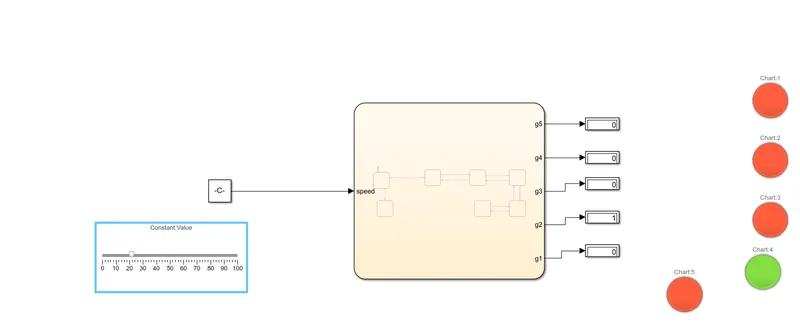
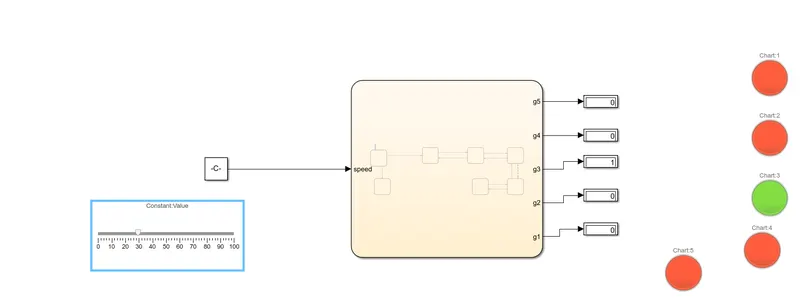
The below figure is the Simulink chart for the gear shift. A slider is used to vary the speed according to different conditions. Speed is the given input and g1,g2,g3,g4,g5 are the different gears and output.
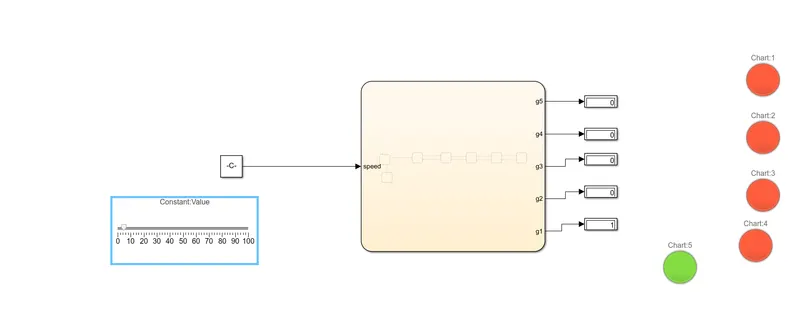
The green lamp input shows 1 as green input and 0 as red input
When the speed is between 16 and 25 the below result is shown and shows that the gear is shifted to gear 2
When the speed is between 26 and 40 the below result is shown and shows that the gear is shifted to gear 3
When the speed is between 41 and 60 the below result is shown and shows that the gear is shifted to gear 4
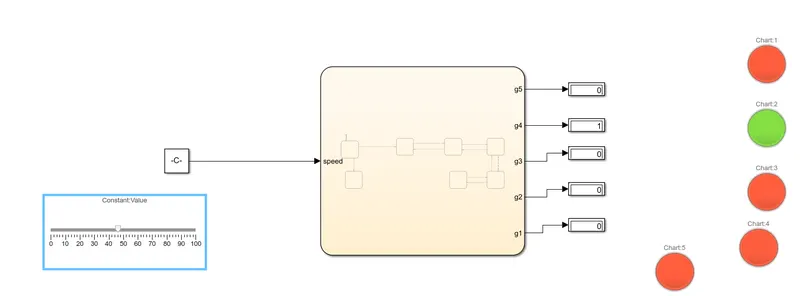
When the speed is above 61 the below result is shown and shows that the gear is shifted to gear 5