Week - 4
AIM :
1.To Implement control logic of a “washing machine” using Stateflow.
2. To Make a Simulink chart for the “Gear shift” logic.
OBJECTIVE :
- To Implement control logic of a “washing machine” using Stateflow as per given sequence:
- If the power supply is available, the system gets activated
- If the Water supply is not available, stop the process & indicate through LED
- Soaking time should be 200s followed by Washing time of 100s.
- Then rinsing happens for next 20s & dryer runs for 50s
After all the processes are completed turn on the finished LED.
SIMULINK MODEL :
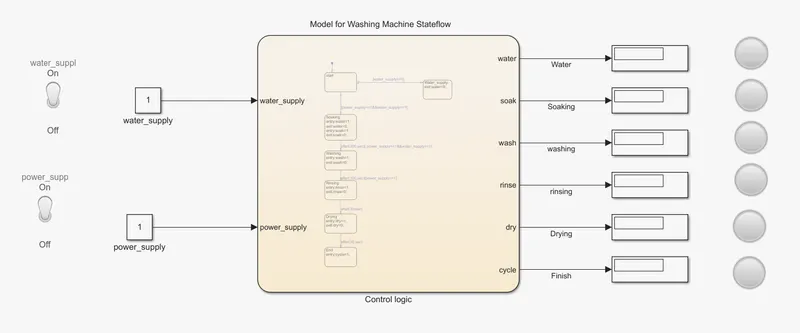
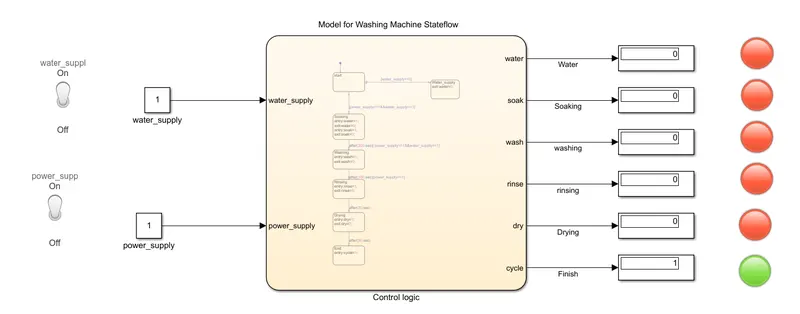
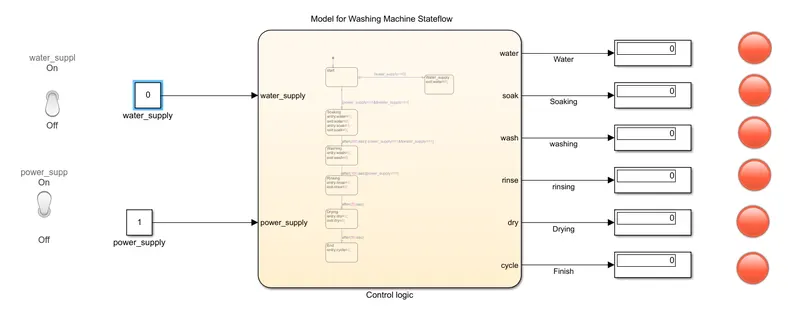
fig:Simulink Model to implement Control logic of Washing machine using Stateflow
conditions:1.When the Lamp shows Green the task is in process
2.when the Lamp shows Red the task ends.
CHART DIAGRAM:
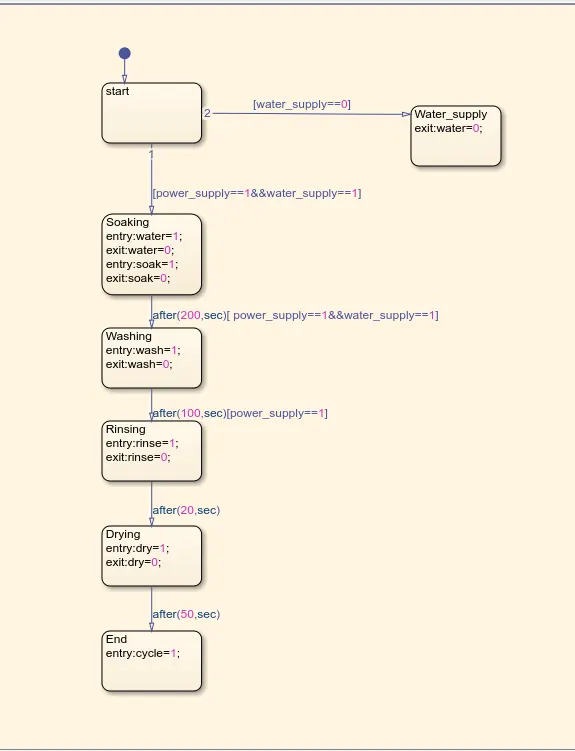
CONTROL LOGIC For Washing machine using Stateflow
EXPLANATION :
A Stateflow chart is a graphical representation of a finite state machine consisting of a State,Transitions & Data.
Control Logic:1.STATE
Automatic Washing machine Switches i:e (Changing from one Operating State to another) between different operating states.on a Condition of Time delay.
Here, the Different operating states are ,Start,Filling Water,Washing,Rinsing,Spinning,Drying and cycle Finish.
2.TRANSITION :The transition occurs if the condition defining the change is true.i.e If the Boolean expression in ( START) has a value of 1 when the ON state of POWER SUPPLY AND WATER SUPPLY is active. otherwise (START) equals 0. i.e OFF.The process Stops and LED indicates.
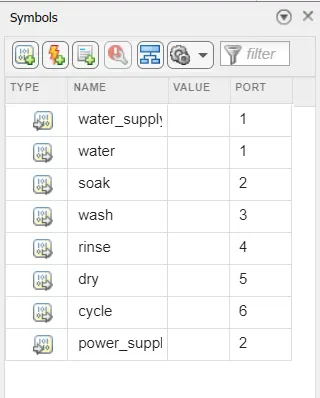
3.DATA :The DATA implies that the input and output conditon to decide State Transition.
Here,The Inputs Are WATER SUPPLY AND POWER SUPPLY.
The Output parameters are WATER,SOAK,WASH,RINSE,DRY,CYCLE.
CONDITION 1:
- If the power supply and water supply is available , the system gets activated And the Cycle is Finished.The Green Lamp is activated indicating the cycle is finished.
CONDITION 2:
- If the Water supply is not available i.e water supply in OFF condition, the process is not activated &Red lamp indicate through LED.
CONDITION 3:
- Soaking time should be 200s followed by Washing time of 100s.
- When the process starts the water supply and power supply is in On state and the Washing machine starts indicating green lamp and by the changing state for Soaking the time delay is 200s followed by Washing time of 100s.The Green Lamp indicates Soaking in Process.
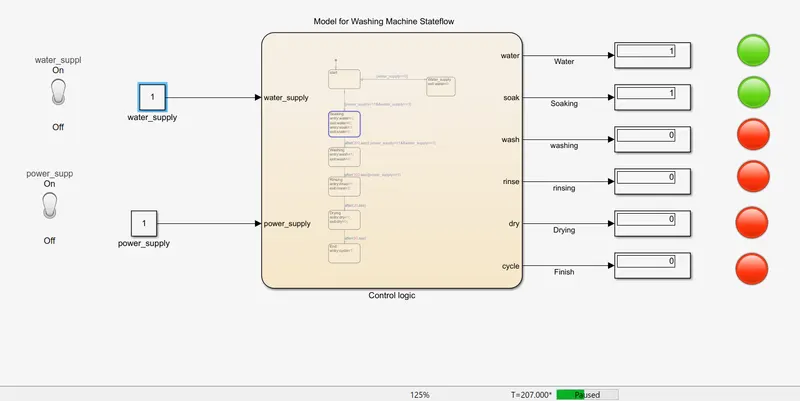
The Run Time for the Washing machine is 450 seconds.
OBJECTIVE 2 :
2. To Make a Simulink chart for the “Gear shift” logic as per below conditions:
Speed Range(kmph) Gear
0 to 15 1
16 to 25 2
26 to 40 3
41 to 60 4
Above 61 5
For a Given speed input while the simulation is running & to display the gear number.
SIMULINK MODEL :
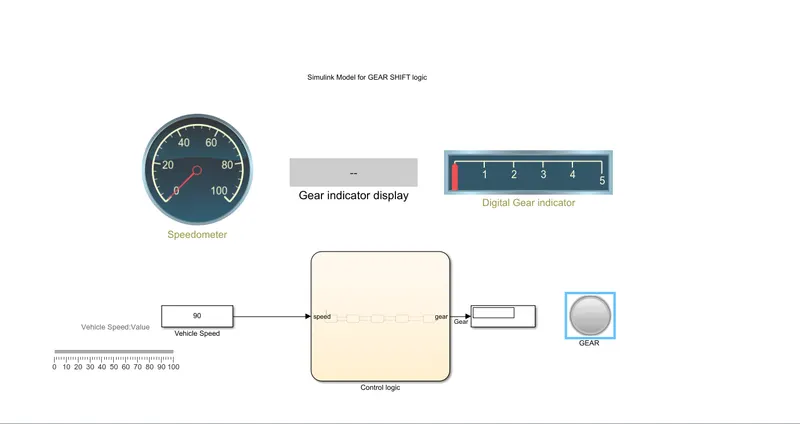
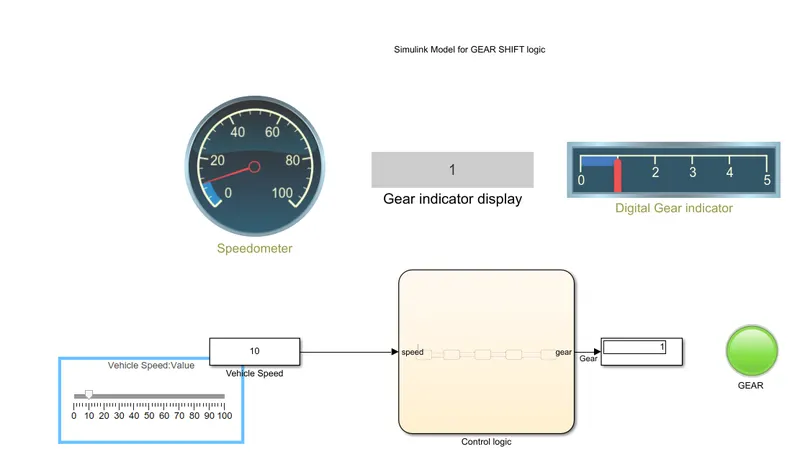
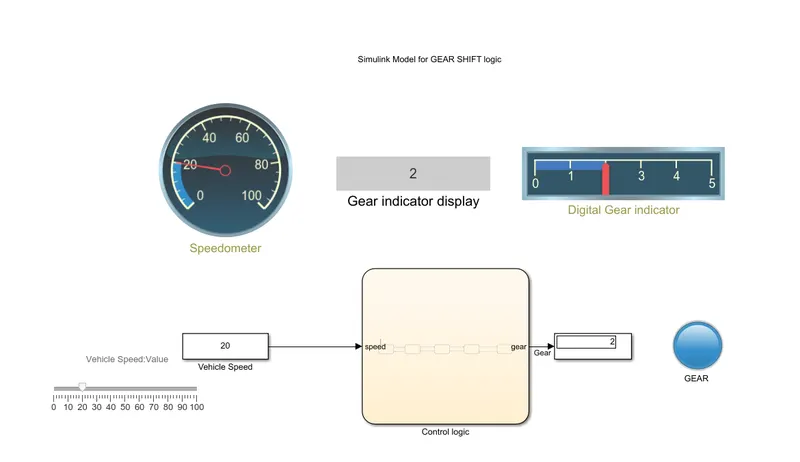
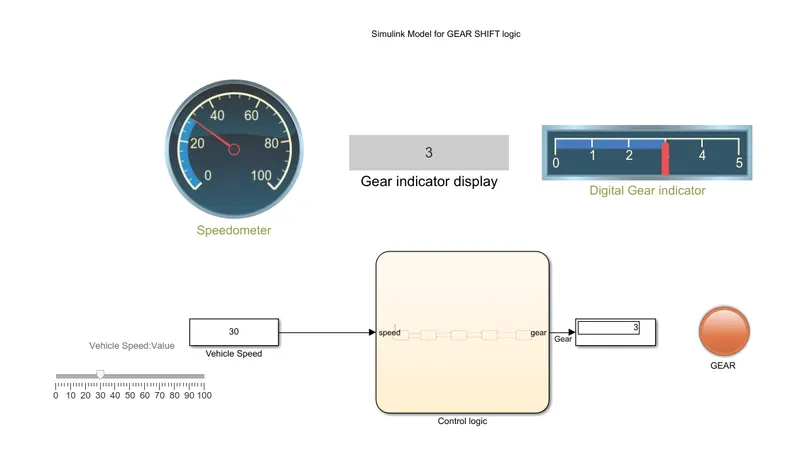
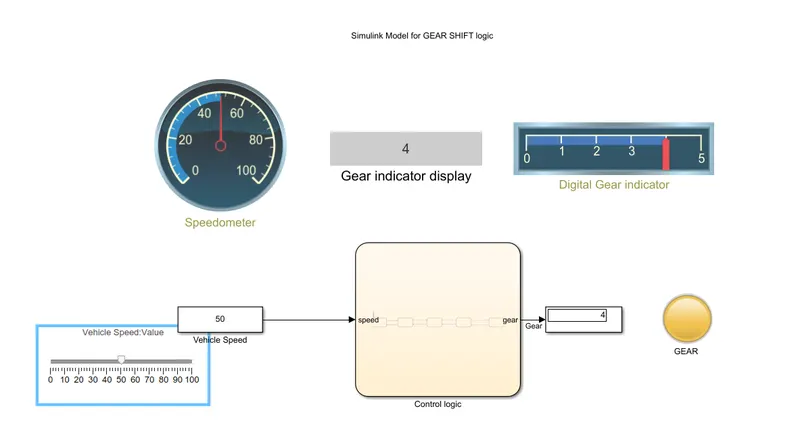
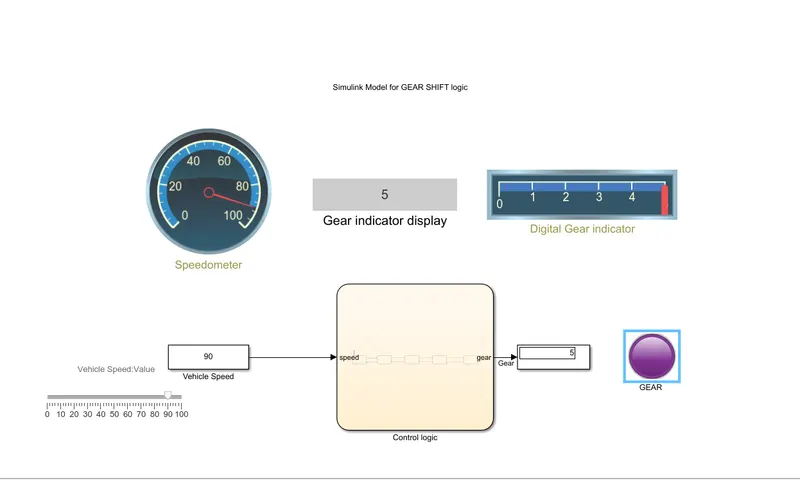
Fig: Simulink model & chart for the “Gear shift” using stateflow.
BLOCKS USED :
SPEEDOMETER :It is used to display the speed.
GEAR INDICATOR DISPLAY:Display signal values as text.
DIGITAL GEAR INDICATOR:Display an input value on a customized gauge.To display the active gear digitally.
SLIDER:Set value to tune parameters or variables is used to change the Vehicle speed.
LOGIC : Based on the sensed value of speed the gear is shifted accordingly.Here the logic is shift up and shift down made by the driver. If speed>Speed Range or speed<Speed range determines the Shift in Gear
Speed Range(kmph) Gear control logic
0 to 15 1 if speed<15
16 to 25 2 if speed<25
26 to 40 3 if speed<40
41 to 60 4 if speed<60
Above 61 5 if speed>60
CHART DIAGRAM :
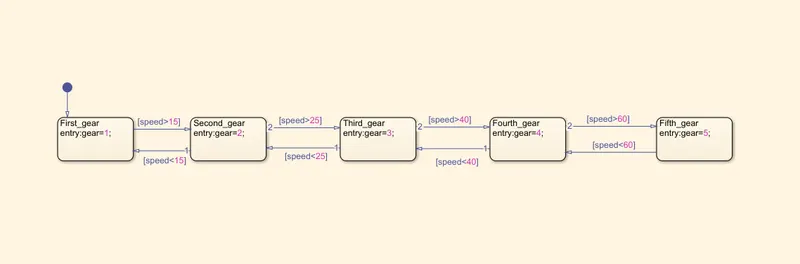
Control Logic for Gear Shift
EXPLANATION :
In a Stateflow chart,it combine states, transitions, and data to implement a finite state machine. This Stateflow chart presents a simplified model of the logic to shift gears in a five-speed automatic transmission system of a car. The chart represents each gear position by a state, shown as a rectangle labeled First_gear,Second_gear,Third_gear,Fourth_gear,Fifth_gear. Like the gears they represent, these states are exclusive, so only one state is active at a time.
The arrow on the left of the diagram represents the default transition and indicates the first state to become active. When you execute the chart, this state is highlighted on the canvas. The other arrows indicate the possible transitions between the states. To define the dynamics of the state machine, we associate each transition with a Boolean condition or a trigger event. this chart monitors the speed of the car i.e 80 km/hr and shifts to a different gear i.e gear 5 when the speed crosses a fixed threshold. During simulation, the highlighting in the chart changes as different states become active.
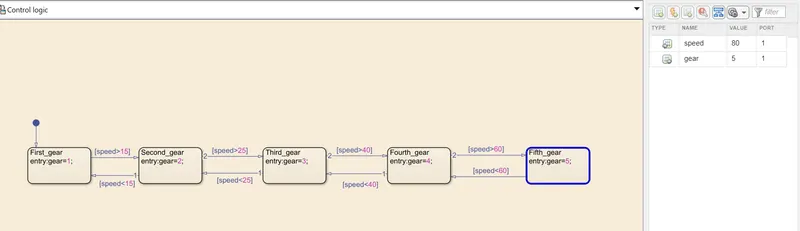
fig:indicates highlighting in the chart changes the different states become active.
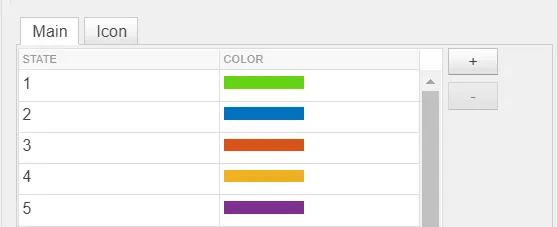
LAMP :
Displays a color that reflects an input value.
Here, some of the color indicates the gear from First to Fifth Gear as given below,
OUTPUT/RESULT :
Speed Range(kmph) 0 to 15 Gear 1