Project 1 - Parsing NASA thermodynamic data
AIM : To Write a MATLAB Code for Parsing NASA Thermodynamics Data, with polynomials that can be used to evaluate thermodynamic properties such as Cp, H and S.And also They have given the co-efficients that are required to evaluate these polynomials for 1000+ species.
OBJECTIVE :1.To Write a function that extracts the 14 co-efficients and calculates the enthalpy, entropy and specific heats for all the species in the data file.
2.To Calculate the molecular weight of each species and display it in the command window.
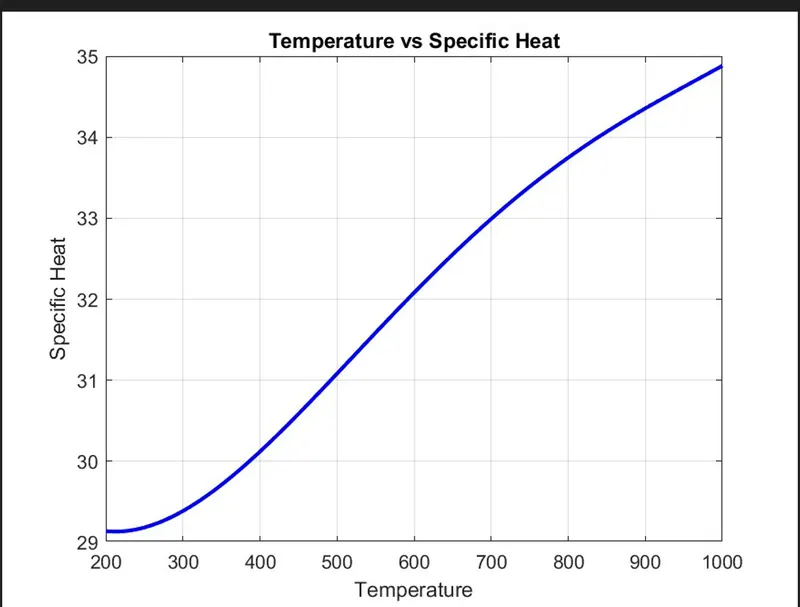
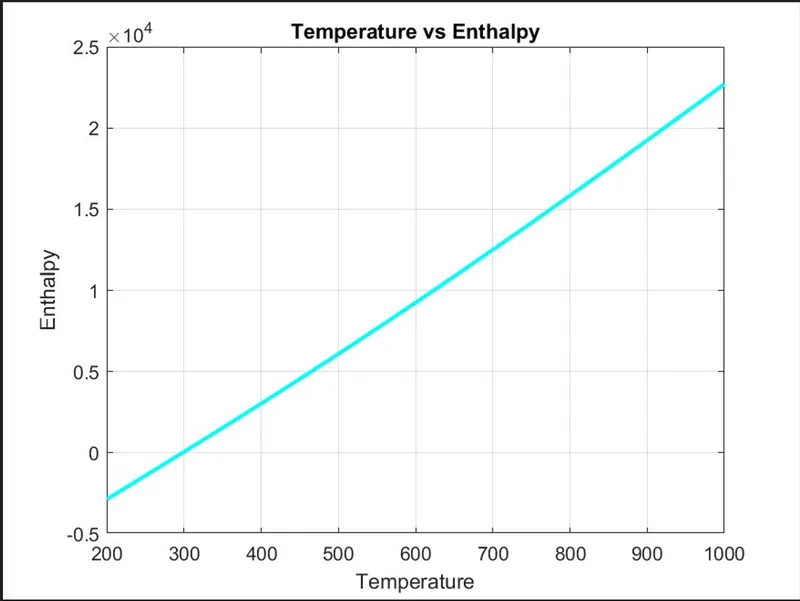
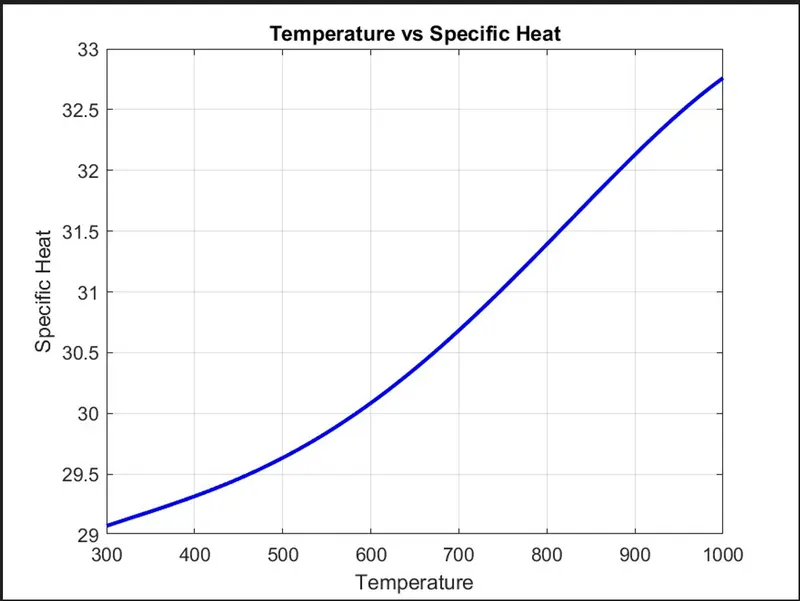
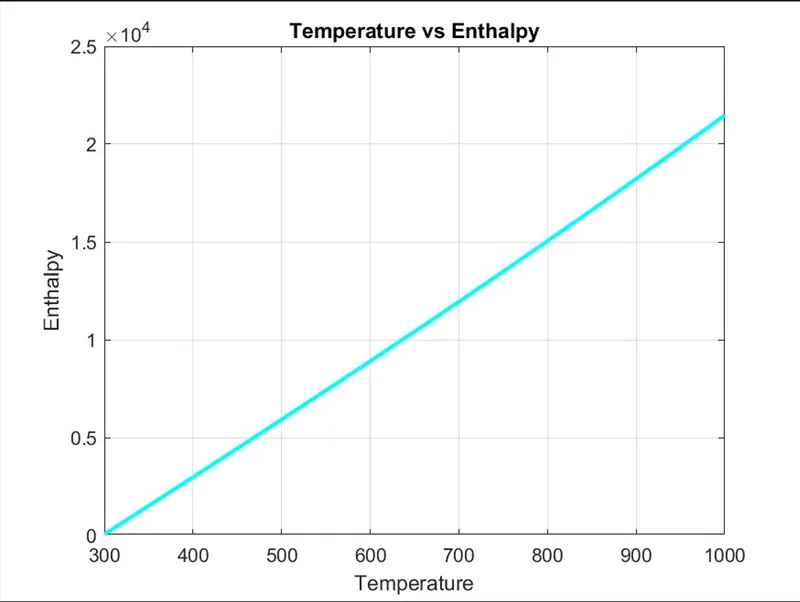
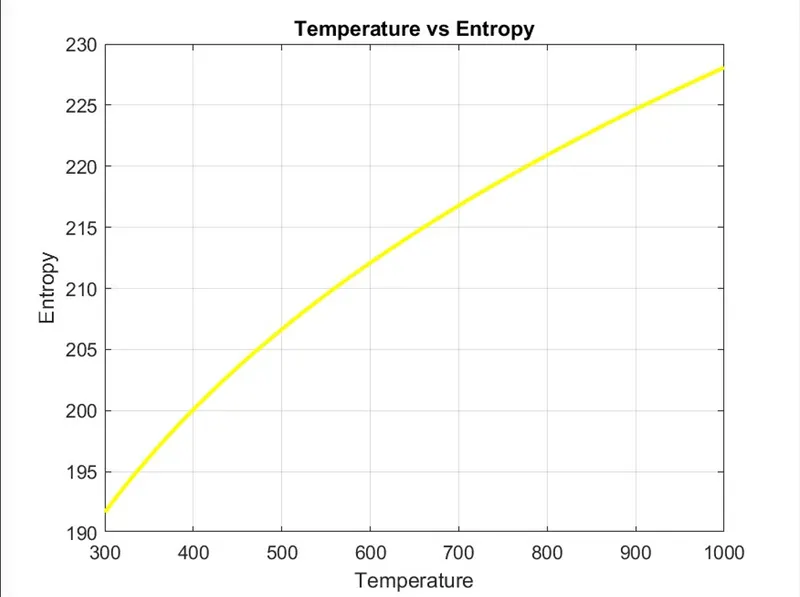
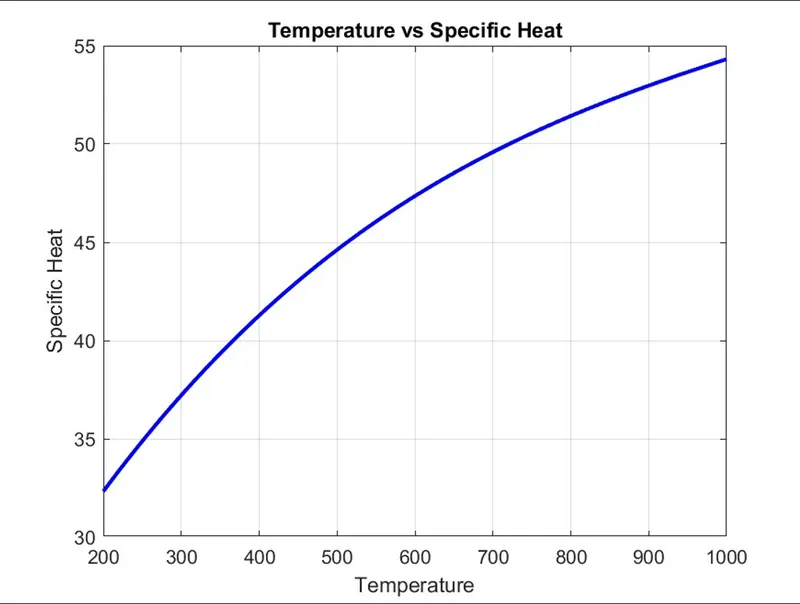
3.To Plot the Cp, Enthalpy and Entropy for the local temperature range (low temperature : high temperature) specific for each species.
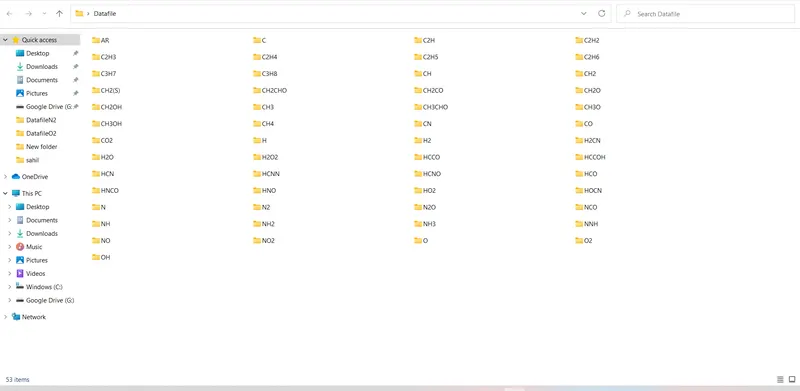
4.To Save the plots as images with appropriate names and dump them in separate folders for each species with suitable name. All these should be generated automatically.
5. To Write The main program taking the "THERMO.dat" file as an input and generate Cp, H and S plots.
THEORY :
Specific Heat is the amount of heat required by unit mass of the system for unit rise in temperature .In this process, pressure and volume play dominant roles.Therefore the specific heat can be measured in two ways,by keeping constant volume or constant pressure.The specific heat measured by keeping volume constant(cv). Similarly, the specific heat measured by keeping pressure constant called specific heat at constant pressure (cp).
ENTHALPY of a system is the energy in terms of sum of internal energy and flow energy. For a system of unitmass, the specific enthalpy (h) is given by ,as shown in below equation.
ENTROPY is a function of state of a system.Itis an external property and is reversible.it is denoted by s .its unit is j/k.
The formula to calculate Specific heat, Enthalpy,Entropy is given below,

Where R is the universal gas constant And T is the temperature( Local temperature is considered).
MATLAB CODE FOR SPECIFIC HEAT,ENTHALPY,ENTROPY AND MOLECULAR WEIGHT :
SPECIFIC HEAT :
function[c_p]=specific_heat(a1,a2,a3,a4,a5,a6,a7,a8,a9,a10,a11,a12,a13,a14,local_temp1,local_temp2,local_temp3,R,T)
if (T>local_temp2)
    c_p = R .*(a1+(a2.*T)+(a3.*(T.^2))+(a4.*(T.^3))+(a5.*(T.^4)));
else
     c_p = R .*(a8+(a9.*T)+(a10.*(T.^2))+(a11.*(T.^3))+(a12.*(T.^4)));
end
ENTHALPY :
function[H] = enthalpy(a1,a2,a3,a4,a5,a6,a7,a8,a9,a10,a11,a12,a13,a14,local_temp1,local_temp2,local_temp3,R,T)
if(T>local_temp2)
    H = (a1+((a2.*T)/2)+((a3.*(T.^2))/3)+((a4.*(T.^3))/4)+((a5.*(T.^4))/5)+(a6./T)).*R.*T;
else
    H = (a8+((a9.*T)/2)+((a10.*(T.^2))/3)+((a11.*(T.^3))/4)+((a12.*(T.^4))/5)+(a13./T)).*R.*T;
end
ENTROPY :
function[S] = entropy(a1,a2,a3,a4,a5,a6,a7,a8,a9,a10,a11,a12,a13,a14,local_temp1,local_temp2,local_temp3,R,T)
if(T>local_temp2)
    S=((a1.*log(T))+(a2.*T)+((a3.*(T.^2))/2)+((a4.*(T.^3))/3)+((a5.*(T.^4))/4)+(a7)).*R;
else
    S=((a8.*log(T))+(a9.*T)+((a10.*(T.^2))/2)+((a11.*(T.^3))/3)+((a12.*(T.^4))/4)+(a14)).*R;
end
MOLECULAR WEIGHT :
function[M]=molecular_wt(species_name)
atomic_mass = [15.999 1.008 12.011 14.007 39.948];
elements = ['O' 'H' 'C' 'N' 'A'];
mol_wt = 0;

for i=1:length(species_name)
    for j=1:length(elements)
        if strcmpi(species_name(i),elements(j))
            mol_wt=mol_wt+atomic_mass(j);
            z=j;
        end
    end
   T=str2double(species_name(i));
    if(T>1)
        mol_wt=mol_wt+(atomic_mass(z)*(T-1));
    end
end
M=mol_wt
end
MAIN MATLAB CODE :
clear
close all
clc
% reading the file thermo.dat and opening the file
fid=fopen('THERMO.dat','r');
fgetl(fid)  ;  %reading the 1st line
tline=fgetl(fid);    %reading the second line

% converting the strings to numbers
A = strsplit(tline,' ');
global_low_temp = str2double(A{2});
global_mid_temp = str2double(A{3});
global_high_temp = str2double(A{4});

% skipping the lines 3 to 5
for i=3:5
    fgetl(fid)
end

%using for loop for extracting all the co-efficient for 53 species
for i=1:53

tline_1 = fgetl(fid);  %reading the species line
species_1 = strsplit(tline_1,' ');
species_name =species_1{1};
B =strfind(tline_1,'G');
local_temp=tline_1(B+4:length(tline_1));
species_line=strsplit(local_temp,' ');

% extracting the local temperature

local_temp1 = str2double(species_line{1}) ;
local_temp2 = str2double(species_line{2});
local_temp3 = str2double(species_line{3});

% finding the co-efficients
L2 = fgetl(fid);
a  = findstr(L2,'E');
a1 = str2double(L2(1:a(1)+3));
a2 = str2double(L2(a(1)+4:a(2)+3));
a3 = str2double(L2(a(2)+4:a(3)+3));
a4 = str2double(L2(a(3)+4:a(4)+3));
a5 = str2double(L2(a(4)+4:a(5)+3));

L3 = fgetl(fid);
b  = findstr(L3,'E');
a6 = str2double(L3(1:b(1)+3));
a7 = str2double(L3(b(1)+4:b(2)+3));
a8 = str2double(L3(b(2)+4:b(3)+3));
a9 = str2double(L3(b(3)+4:b(4)+3));
a10 = str2double(L3(b(4)+4:b(5)+3));

L4 = fgetl(fid);
c  = findstr(L4,'E');
a11= str2double(L4(1:c(1)+3));
a12= str2double(L4(c(1)+4:c(2)+3));
a13= str2double(L4(c(2)+4:c(3)+3));
a14= str2double(L4(c(3)+4:c(4)+3));

%inputs
R=8.314; % universal gas constant
T=linspace(local_temp1,local_temp3,200);

% creating the new folder
mkdir('C:\Users\91897\Desktop\Datafile',species_name)

%to calculate specific heat
c_p = specific_heat(a1,a2,a3,a4,a5,a6,a7,a8,a9,a10,a11,a12,a13,a14,local_temp1,local_temp2,local_temp3,R,T);
% to calculate enthalpy
H = enthalpy(a1,a2,a3,a4,a5,a6,a7,a8,a9,a10,a11,a12,a13,a14,local_temp1,local_temp2,local_temp3,R,T);
% to calculate entropy
S = entropy(a1,a2,a3,a4,a5,a6,a7,a8,a9,a10,a11,a12,a13,a14,local_temp1,local_temp2,local_temp3,R,T);

% plotting temperature vs specific heat
figure (1)
plot(T,c_p,'color','b','linewidth',2)
grid on
title('Temperature vs Specific Heat')
xlabel('Temperature')
ylabel('Specific Heat')

% plotting temperature vs Enthalpy
figure(2)
plot(T,H,'color','c','linewidth',2)
grid on
title('Temperature vs Enthalpy')
xlabel('Temperature')
ylabel('Enthalpy')

% plotting temperature vs entroy
figure(3)
plot(T,S,'color','y','linewidth',2)
grid on
title('Temperature vs Entropy')
xlabel('Temperature')
ylabel('Entropy')

%changing the directory
mkdir(['C:\Users\91897\Desktop\Datafile',species_name])  % make a new folder
cd(['C:\Users\91897\Desktop\Datafile',species_name])   % change current folder

% saving the figure to respective folder
saveas(figure(1),'Cp vs T.jpg')  % save figure to specific file format to jpg format
saveas(figure(2),'H vs T.jpg')
saveas(figure(3),'S vs T.jpg')
cd ..

% calculating the molecular  weight
M=molecular_wt(species_name);
K=sprintf('%s mol_wt=%f',species_name,M);
disp(K)
end
CODE EXPLANATION :
STEP 1 :Starting The MATLAB Code with Clear all,close all and clc.
reading the file THERMO.dat and opening the file using the fopen command and assining the variable as fid, Filename.
fgetl(fid), Reading the first line line from file, removing newline characters.
tline reads one line of text from the device connected to the serial port object,obj and returns the data to tline. This returned data includes the terminator with the text line.
Finding the Global Temperature from line 2 and converting strings to numbers.
skipping the line 3 to 5.
Extracting the Local Temperature by reading the species line.
STEP 2:Finding the Co-efficients by using the command strfind which helps to find the variable E in the Line 2 and finding the co-efficients. and converting them to strings to double precision values .
Simlarly finding all the 14 co-efficient for High Temperature Co-efficient and Low Temperature co-efficient.
STEP 3: Defining the inputs R and T using local Temperatures.
Creating the Newfolder using mkdir command in C drive Desktop datafile folder with 53 species_name.
STEP 4:Calculating the Specific heat, Enthalpy,Entropy by defining function as above written code to calculate C_p,H,S.
STEP 5:
Screenshot of the window where all the folders are saved.
RESULT/OUTPUT :
PLOT FOR O2: plot of Temperature vs Specific Heat
Plot of Temperature vs Enthalpy
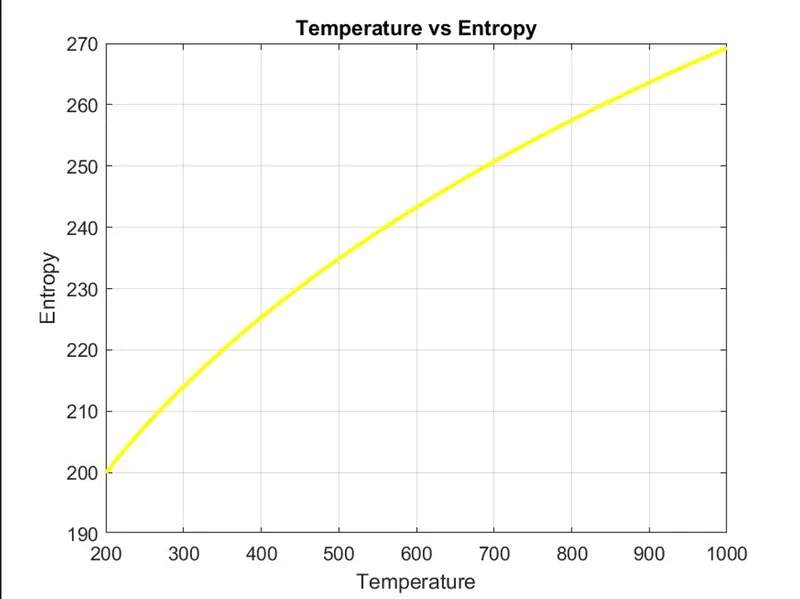
Plot of Temperature vs Entropy
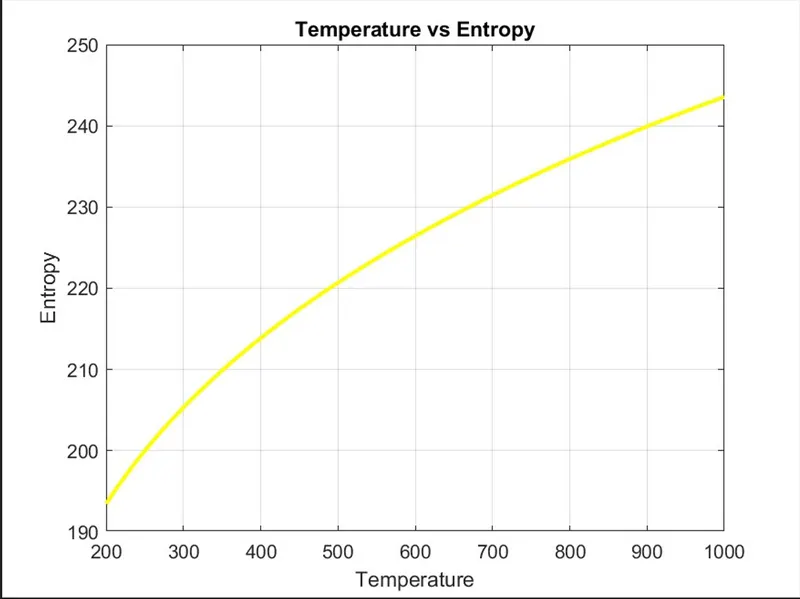
PLOT FOR N2 : Plot of Temperature vs Specific Heat
Plot of Temperature vs Enthalpy
Plot of Temperature vs Entropy
PLOT FOR CO2 : Plot of Temperature Vs Specific Heat
Plot of Temperature vs Enthalpy
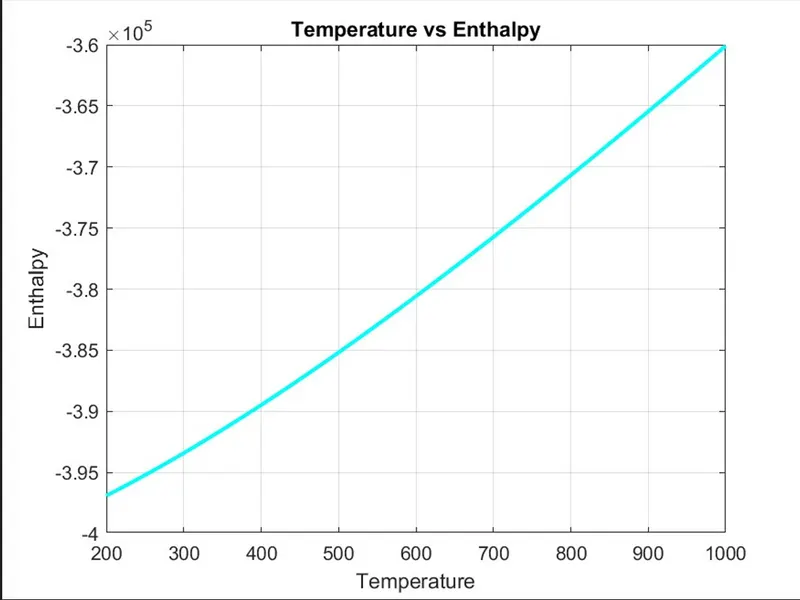
Plot of Temperature vs Entropy
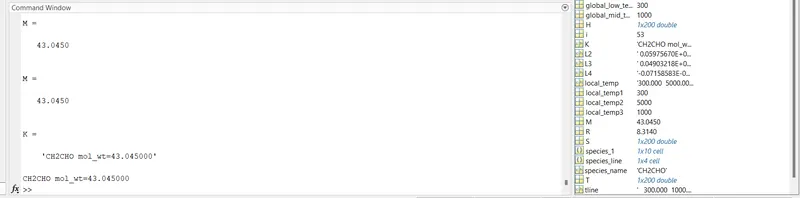
2.Molecular Weight for each Species names:
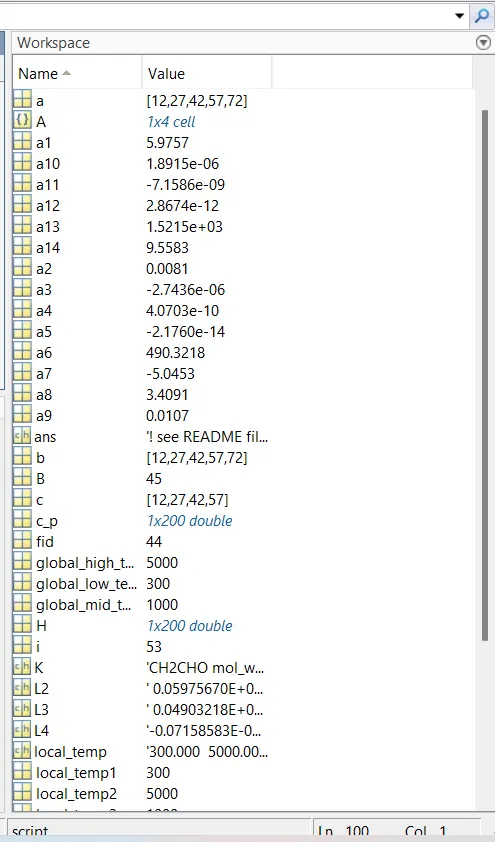
3.Workspace Memory to show the values of co-efficient :
ERRORS/MEASURE FOR ERROR :
1.
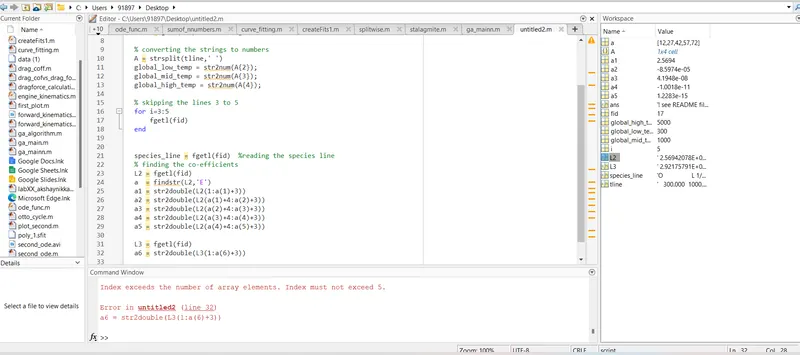
The error index exceeds the number of array element . Index must not excced 5 is cleared by changing the variable a(6) to the Line 3 by b(1).
2.
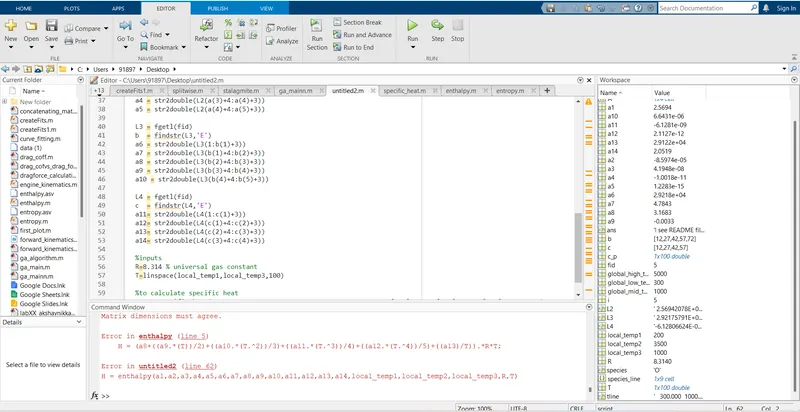
Error in Enthaply line 5 is cleared by using the element wise operatoras there was a typo in the function code.
3.
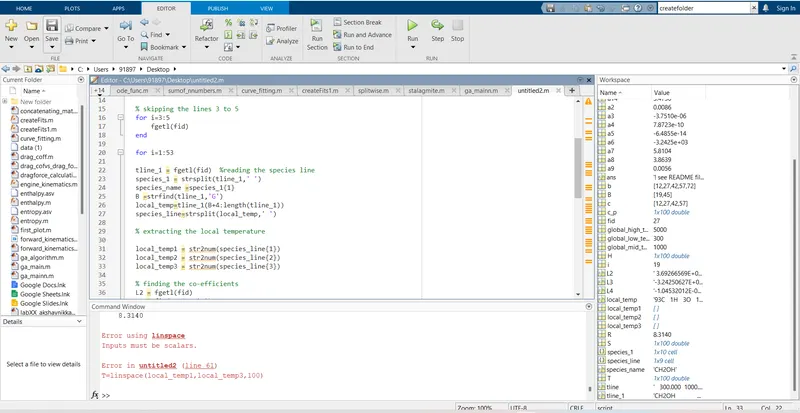
The error is cleared by changing the str2num to str2double for double precission value.
CONCULSION :
- A Main program is written for a function that extracts the 14 co-efficients and calculates the enthalpy, entropy and specific heats for all the species in the data file.
- Molecular weight of each species is calculated and displayed in the command window.
- Graph is Plotted for the Cp, Enthalpy and Entropy for the local temperature range (low temperature : high temperature) specific for each species.
- Screenshot of the window where all the folders are saved is shown in the above output.
- Plots for o2, N2 and Co2 species are plotted.