Week - 4
Aim
- Implement control logic of a “washing machine” using Stateflow as per given sequence:
- If the power supply is available, the system gets activated
- If the Water supply is not available, stop the process & indicate through LED
- Soaking time should be 200s followed by Washing time of 100s.
- Then rinsing happens for next 20s & dryer runs for 50s
After all the processes have completed turn on the finished LED
2. Make a Simulink chart for the “Gear shift” logic as per below conditions:
Speed Range(kmph) Gear
0 to 15 1
16 to 25 2
26 to 40 3
41 to 60 4
Above 61 5
Give speed input while the simulation is running & display the gear number.
Objective-1
- Implement control logic of a “washing machine” using Stateflow as per given sequence:
- If the power supply is available, the system gets activated
- If the Water supply is not available, stop the process & indicate through LED
- Soaking time should be 200s followed by Washing time of 100s.
- Then rinsing happens for next 20s & dryer runs for 50s
After all the processes have completed turn on the finished LED
Methodology
Theory
Control logic
It is a basic part of a software program that controls the operations of the program. It is the basic logic which define how the program should beheave. Control logics can be created with the state diagrams, which is a form of hierarchial state machine. These state diagrams along with the flow charts can create complex control logics. Its applications includes supervising how to switch between distinct modes of operations, Plan a succession of task for a given system and undergoing fault detection, isolation and recovery logic.
State Flow
State flow provides a graphical language that includes state transition diagrams, state transition tables, flow charts and truth tables. we can use state flow to describe how Matlab algorithams and Simulink models react to input signals, events and time based conditions. State flow enable us to design and develop supervisory control, fault management, task scheduleing, user interface, communication protocols, hybrid systems etc.
Operations in Washing machine
Soaking : After power and water supply is avilable soaking process started and soaking of cloths will happened for 200 sec. It is a wetting process of cloths.
Washing : The soaking followed by the washing process. During this cloths are washed for 100 sec using soap or detergents.
Rinsing : The washing of cloths followed by the rinsing process. During this the washed cloths are rinsed using fresh water inorder to remove the remaining residues from the cloths. 20 sec will taken for this process.
Drying : The rinsing process followed by drying process, during which the water from the wet cloths removed. It will take 50 sec time to complete.
Simulink Model
Components Used
- Toggle switch
- constant block
- Stateflow charts
- Display
- Lamp
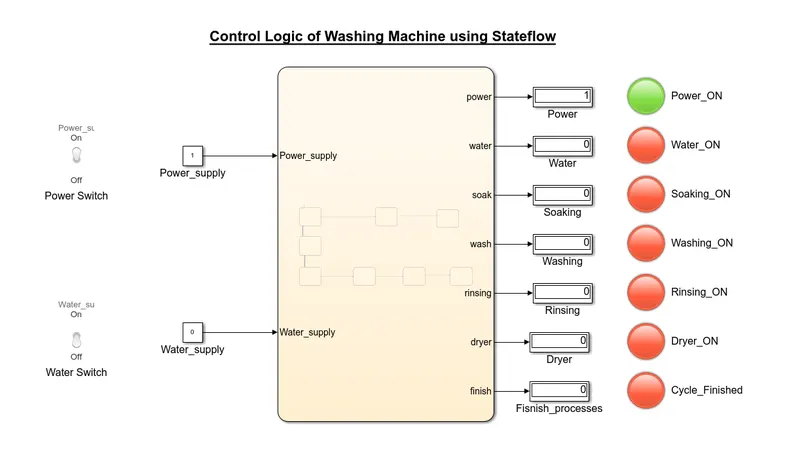
Stateflow Chart (Control Logic Sequence)
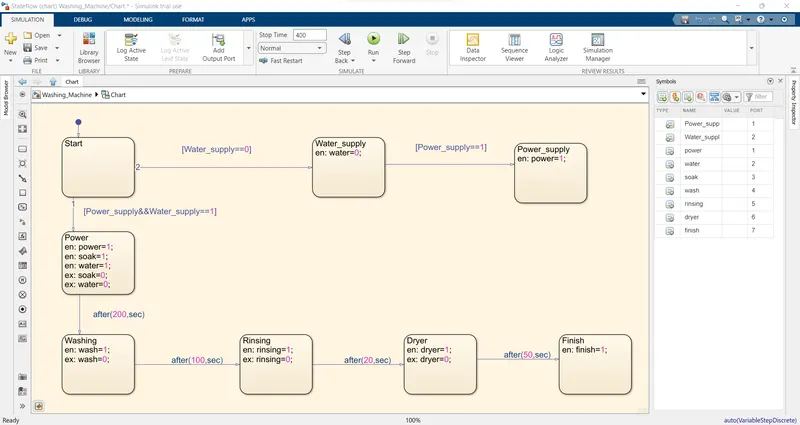
- Open the simulink double click on the blank page and search for the chart block to create stateflow chart.
- Double click on chart block to go inside to activate chart mode.
- Then from the tool box on the leftmost side called Object palette select the state tool which is a rectangular box then click on the chart canvas. A ractangular box with name 'first' will be created.
- Just by right clicking on the state and draging new states can be created. Necessary state names and state actions can be write inside the box which is shown in above pic.
- 'en' represent the entry action- This action occures at the moment when the state is active. ie at the time of entry into the state.
- 'ex' represent the exit action- This action occures at the moment when the chart transition out side the state. ie at the time of exit from the state.
- Move the mouse pointer to the boundary of state, a plus sign will appear then click and drag the mouse to draw the transition line on which the condition for transition of one state to another state is mentioned. conditions are put inside a square bracket.
- After entering the state it exicute the entry action mentioned inside the state and then check for the transition condition to exit from the that state and enter the new state. Immidiately after exiting from the state it exicute the exit conditions present inside the state.
- Go to symbol pane option under the simulation tab in the tool bar and assign what are the input variables and output variables which is shown right side of the above pic. Here the Power_supply and Water_supply are assigned as inputs and power, water, soak, wash, rinsing, dryer and finish are asssigned as outputs.
Output
If the power supply is available, the system gets activated
- If the power supply is there the system gets activated and the power_ON button will become green and due to the lack of water supply the whole process is stoped. so other lamps become red as shown above.
If both water supply and power supply is avilable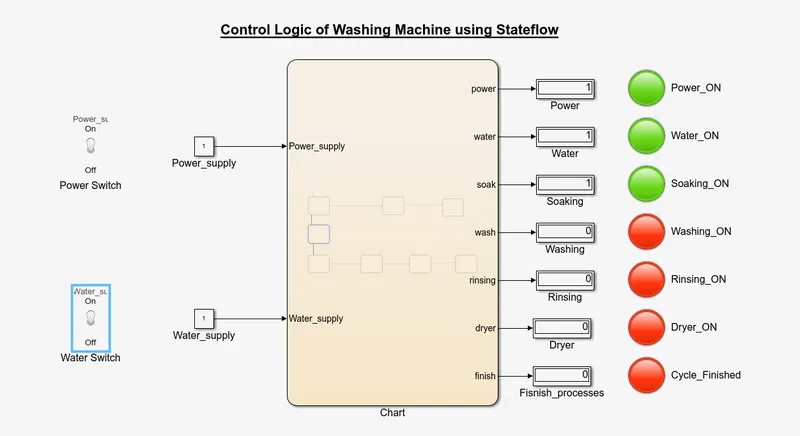
- Both power and water lamp become green and the soaking get started and the soaking lamp turn green until soaking process completed. After 200 sec soaking completed and the water and soaking lamp become red.
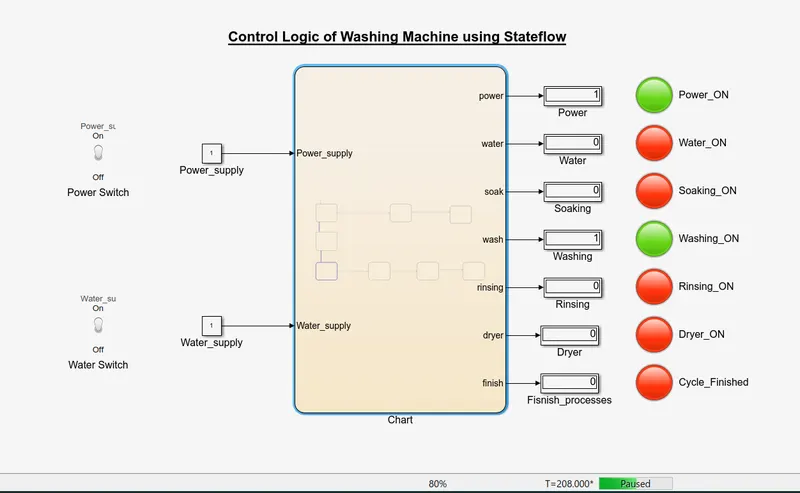
- After 200 sec Washing started and the washing switch become green and the water and soaking lamp become red. Washing is carried out for 100 sec and after that light become red.
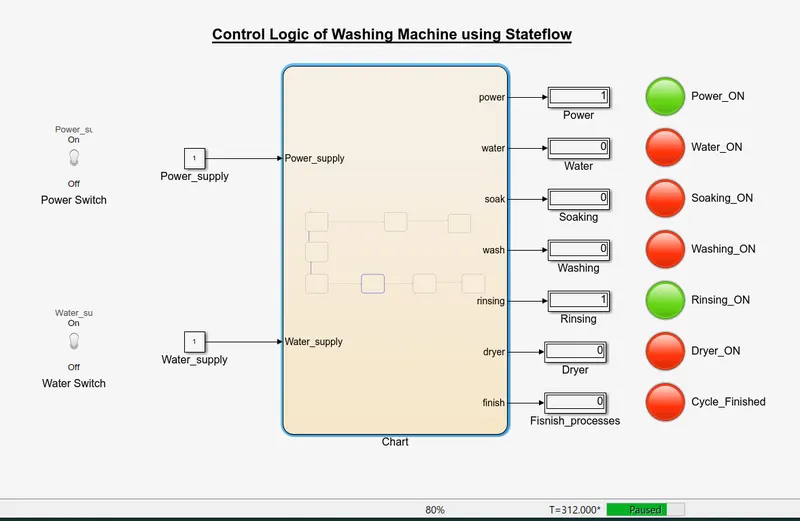
- After 100 sec wasing stops and the lamp become red and the rinsing process start. So the lamp become green. Rinsing is for 20 sec and after that it stops and the green light become red.
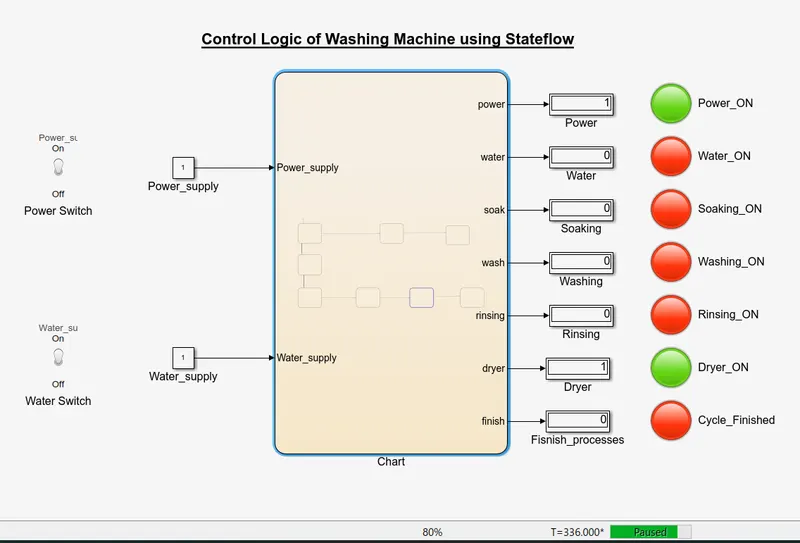
- After 20 sec rinsing lamp become red and the drying process get started and the dryer lamp become green for 50 sec and after that the entire washing process become finished and the cycle_finished lamp become green.
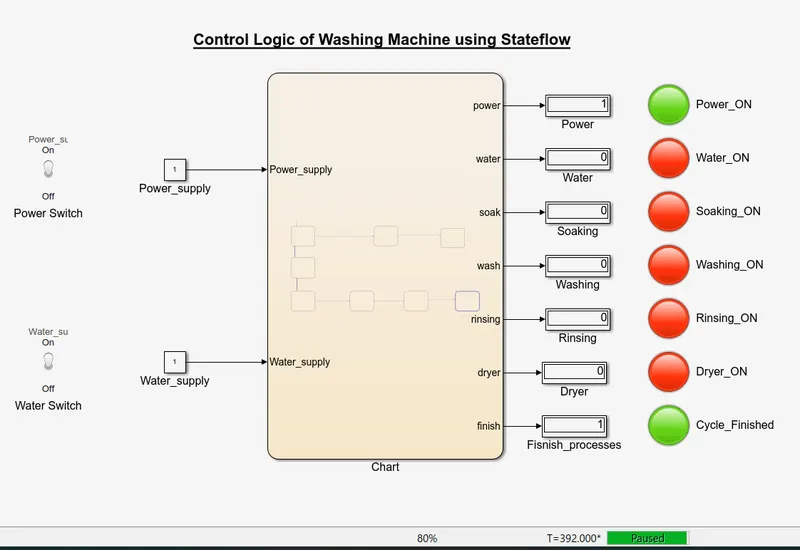
- After 50 sec drying process the entire washing process become completed and cycle_finished lamp turn to green as shown above.
Conclusion
- The objective to create a control logic of a washing machine using stateflow and the conditions mentioned in the objectives are achived successfully.
Objective-2
2. Make a Simulink chart for the “Gear shift” logic as per below conditions:
Speed Range(kmph) Gear
0 to 15 1
16 to 25 2
26 to 40 3
41 to 60 4
Above 61 5
Give speed input while the simulation is running & display the gear number.
Theory
Gear System
Gear systems are the devices to transfer rotory motion from one place to another. By using gears rotational motions can be converted to translational motion as well as rotational motion itself. Gears are teathed wheel, ie it has teath around its periphery.
Gear Transmission
Gears are used for transmissin of power in machines. In vehicles gear systems used to trnsfer power from engine to wheels accordance with the gear ratios. By shifting from one gear having a perticular gear ratio to another gear having different gear ratio we can change the speed and torque of the vehicle. There is specified speed ranges for shifting of gears to carryout power trnsmission efficiently. As the speed of the vehicle increases gear should shift from first to 2nd, 2nd to 3rd, 3r to 4th etc...and the reversal should be done while decreaseing the speed.
Control logic
It is a basic part of a software program that controls the operations of the program. It is the basic logic which define how the program should beheave. Control logics can be created with the state diagrams, which is a form of hierarchial state machine. These state diagrams along with the flow charts can create complex control logics. Its applications includes supervising how to switch between distinct modes of operations, Plan a succession of task for a given system and undergoing fault detection, isolation and recovery logic.
State Flow
State flow provides a graphical language that includes state transition diagrams, state transition tables, flow charts and truth tables. we can use state flow to describe how Matlab algorithams and Simulink models react to input signals, events and time based conditions. State flow enable us to design and develop supervisory control, fault management, task scheduleing, user interface, communication protocols, hybrid systems etc.
Simulink Model
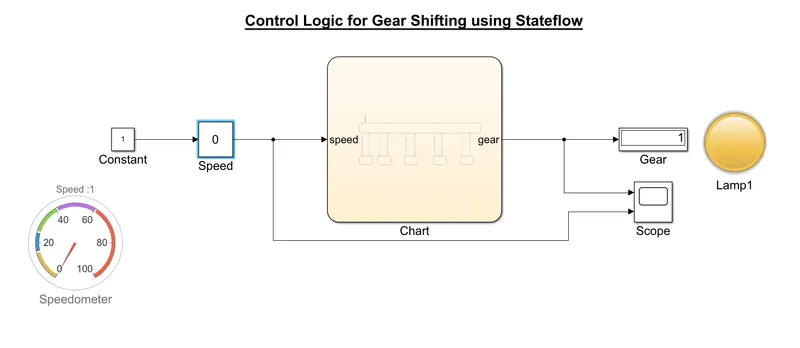
Components Used
- Stateflow chart
- Constant block
- Speedometer Gauge block
- Slider gain block
- Display block
- Scope
- Lamp
Conditions
| Speed Range(Kmph) | Gear | Lamp Colour |
| 0 to 15 | 1 | Yellow |
| 16 to 25 | 2 | Blue |
| 26 to 40 | 3 | Green |
| 41 to 60 | 4 | Violet |
| above 61 | 5 | Red |
Stateflow Chart (Control Logic Sequence)
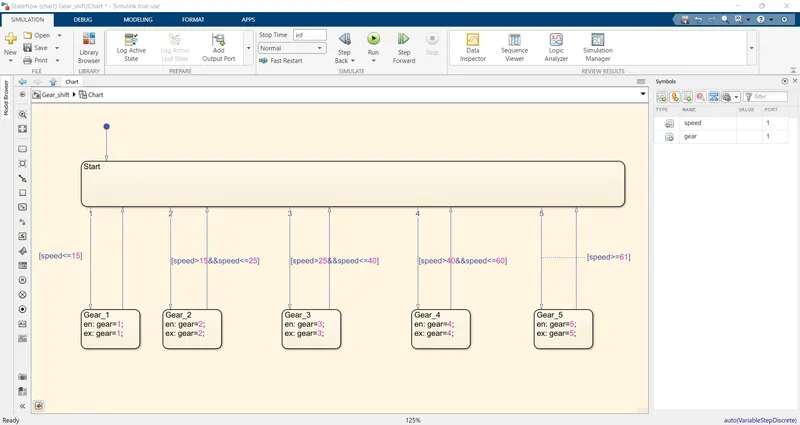
- Open the simulink double click on the blank page and search for the chart block to create stateflow chart.
- Double click on chart block to go inside to activate chart mode.
- Then from the tool box on the leftmost side called Object palette select the state tool which is a rectangular box then click on the chart canvas. A ractangular box with name 'first' will be created.
- Just by right clicking on the state and draging new states can be created. Necessary state names and state actions can be write inside the box which is shown in above pic.
- 'en' represent the entry action- This action occures at the moment when the state is active. ie at the time of entry into the state.
- 'ex' represent the exit action- This action occures at the moment when the chart transition out side the state. ie at the time of exit from the state.
- Move the mouse pointer to the boundary of state, a plus sign will appear then click and drag the mouse to draw the transition line on which the condition for transition of one state to another state is mentioned. conditions are put inside a square bracket.
- After entering the state it exicute the entry action mentioned inside the state and then check for the transition condition to exit from the that state and enter the new state. Immidiately after exiting from the state it exicute the exit conditions present inside the state.
- Go to symbol pane option under the simulation tab in the tool bar and assign what are the input variables and output variables which is shown right side of the above pic. Here the speed is given as input and gear is output.
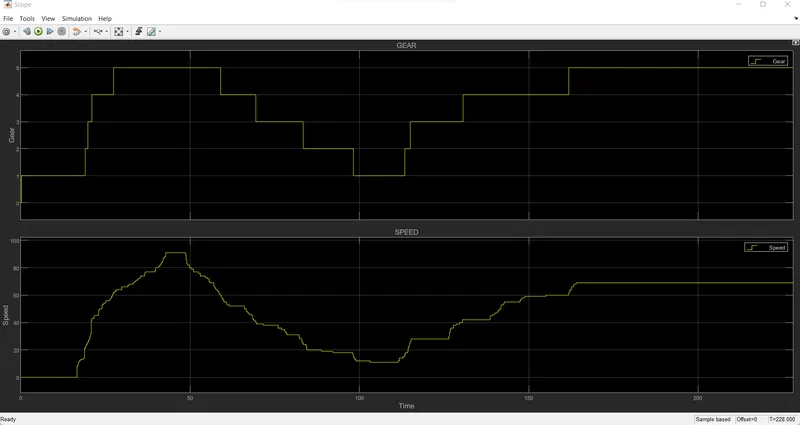
- Here put the stop time infinity and run the system. By using a slider gain block increase and decrease the speed and observe the changes in the gear shifting.
- In the stateflow chart as the speed changes it check which speed condition satisfy the condition provided in the chart and then enters to the respective state and exicute the action given in it.
Output
First gear during 0 to 15 Kmph Speed range
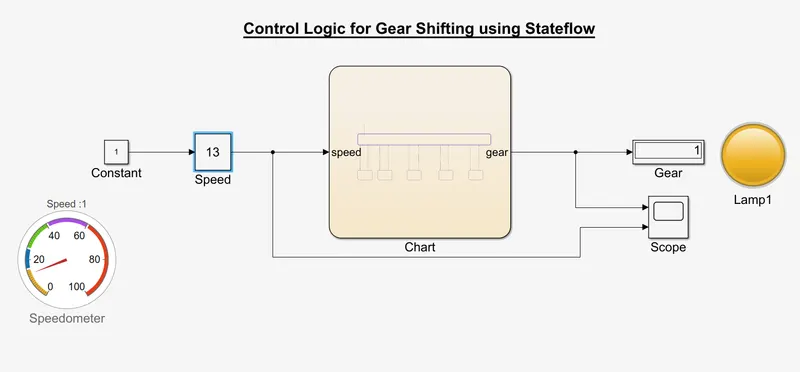
- Stop time provided as infinity and run the simulink. Using slider gain block adjust the speed and make it to 13 Kmph. At output display the gear number displayed as 1 and lamp colour become yellow.
2nd gear during 16 to 25 Kmph Speed range
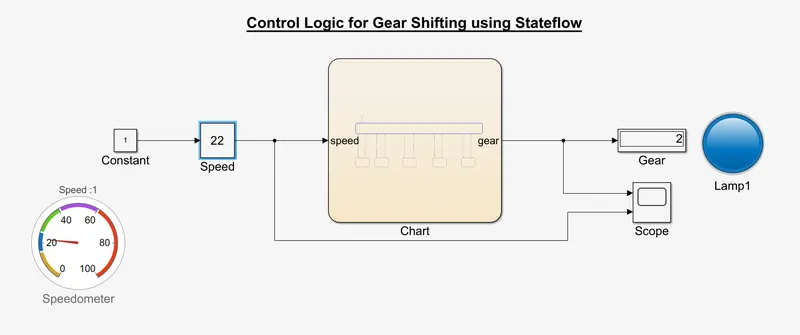
- Using slider gain block adjust the speed and make it to 22 Kmph while running the simulation. At output display the gear number displayed as 2 and lamp colour become blue.
3rd gear during 26 to 40 Kmph Speed range
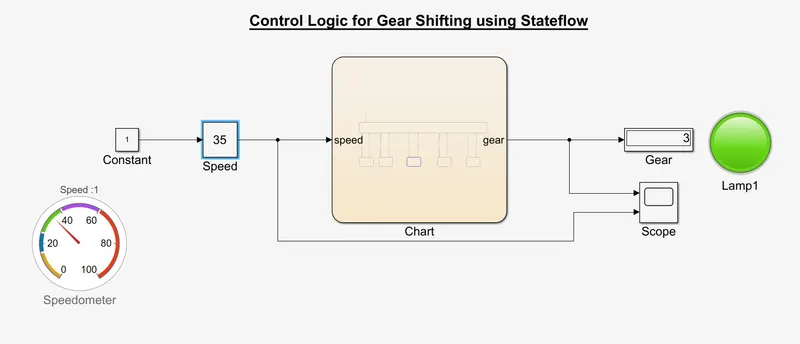
- Using slider gain block adjust the speed and make it to 35 Kmph while running the simulation. At output display the gear number displayed as 3 and lamp colour become green.
4th gear during 41 to 60 Kmph Speed range
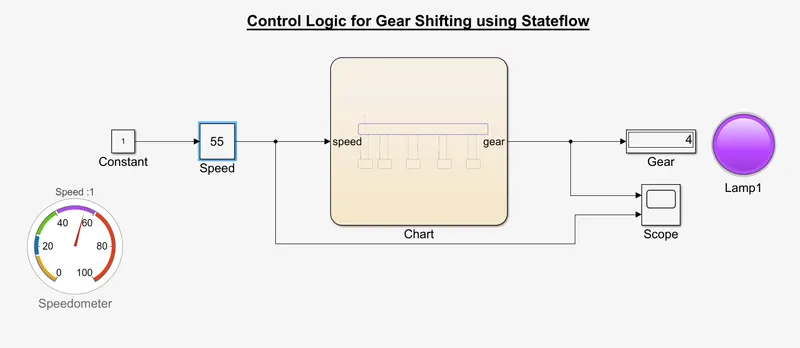
- Using slider gain block adjust the speed and make it to 55 Kmph while running the simulation. At output display the gear number displayed as 4 and lamp colour become violet.
5th gear during above 60 Kmph Speed range
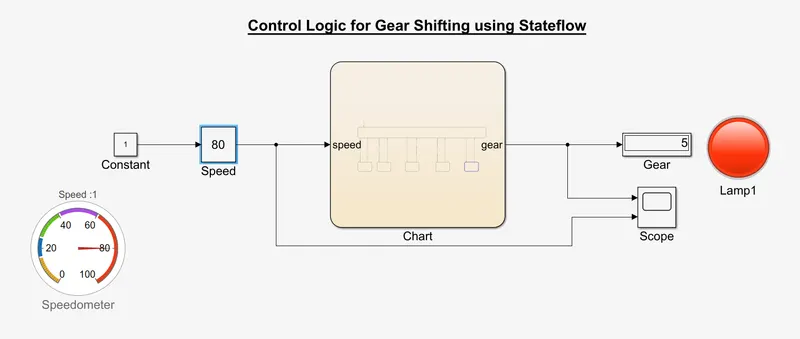
- Using slider gain block adjust the speed and make it to 80 Kmph while running the simulation. At output display the gear number displayed as 5 and lamp colour become red.
Scope Output
Conclusion
- The objective to produce a control logic of gear shifting mechanism using stateflow chart completed successfully.
- Helps to understand the working of stateflow chart and control logic.
- Changes in the gear shift based on speed variation was displayed successfully while running the simulation.