Project 1 - Parsing NASA thermodynamic data
Aim
- Write a function that extracts the 14 co-efficients and calculates the enthalpy, entropy and specific heats for all the species in the data file NASA thermodynamic data
Objectives
- Write a function that extracts the 14 co-efficients and calculates the enthalpy, entropy and specific heats for all the species in the data file NASA thermodynamic data using below formula. (The FIRST 7 coefficients are HIGH-temperature coefficients and the SECOND 7 coefficients are LOW-temperature coefficients.)
-
Calculate the molecular weight of each species and display it in the command window.
-
Plot the Cp, Enthalpy and Entropy for the local temperature range (low temperature : high temperature) specific for each species.
-
Save the plots as images with appropriate names and dump them in separate folders for each species with suitable name. All these should be generated automatically.
Methodology
Equations
`C_p/R=a_1+a_2*T+a_3*T^2+a_4*T^3+a_5*T^4`
`H/(RT)=a_1+(a_2*T)/2+(a_3*T^2)/3+(a_4*T^3)/4+(a_5*T^4)/5+a_6/T`
`S/R=a_1*lnT+a_2*T+(a_3*T^2)/2+(a_4*T^3)/3+(a_5*T^4)/4+a_7`
Here R is the universal gas constant, T is the temeprature.
`C_p` - Specific heat, it is amount of heat required to rise the temperature of unit mass of the substance by 1 celsius degree. unit is jule per kiligram per kelvin [J/KgK]
H - Enthalpy, it is an energy-like property measured by sum of internal energy and product of pressure and volume of a thermodynamic system. unit is jule [ J ]
S - Entropy, it is the degree of disorder or randomness of a system. It is the measure of system's thermal energy per unit temperature that is unavilable for doing useful work. unit is jule per kelvin [J/K]
The FIRST 7 coefficients are HIGH-temperature coefficients and the SECOND 7 coefficients are LOW-temperature coefficients.
File Parsing
File parsing is the process of splitting the contents of the file and reading the data from the file that can be used for various purposes. It helps in how informations can be read from a text file or any type of file and how that informations can be utilized for data processings. By using this techniques we can able to read data from an external file or data base and can be used it for various calculations. It is useful in bigdata processings.
Here we read the data from the data file NASA thermodynamic data and extracts the 14 co-efficients that helps in calculates the enthalpy, entropy and specific heats for all the species in the data file NASA thermodynamic data and plot the graph between these thermodynamic properties with temperature for each species mentioned in the data file.
Code Explanation
Main Code
- Open the file THERMO.dat using fopen command and use fgetl command to access 1st line of the data file. After that use fgetl command to access the 2nd line, where the global temperatures are present. Use string split command to separate the temperatures and convert the separated temperatures into numbers using str2double/str2num command. Stored it as global minimum temerature, global mid temperature and global maximum temperature.
- Use the for loop to read and skip the other header informations.
- Use another for loop to extract the 14 coefficients of each species. There is 53 species present in the THERMO.dat file so run the for loop for 53 times for accessing coefficients. This is because under each species the arrangement of lines are same so accessing code for one species can be used for another one.
- Define the universal gas constant value and temperature range. Temperature range is between globel minimum temperature and global maximum temperature with 1000 intervels using the linspace command. Stored it in T.
- Access the species line that contain species name, local minimum, mid and maximum temperature values using fgetl command. Split the line at the point where the spaces is present using the sring split command strsplit. And stored it in variable called sp.
- t_line=fgetl(THM);
- sp=strsplit(t_line,' ');
- After splitting we get 9 positions, at the 1st position we get the species name so stored it in species. the local temperatures are at 6th 7th and 8th positions Use (end-1) to represent 8th position (end-2) to represent 7th and (end-3) to represent 6th position.
- species=sp{1};
- lowtemp=str2double(sp(end-3));
- midtemp=str2double(sp(end-1));
- hightemp=str2double(sp(end-2));
- Access the next line that is the coefficient line using fgetl command and stored it in c1. For example P=' 2.56942078E+00-8.59741137E-05 4.19484589E-08-1.00177799E-11 1.22833691E-15 2' be the line representing the coefficients and we have to extract the coefficients from this line. For that we found thre presence of a common point 'E' in all these coefficients and after 'E' there is 3 position present in all coefficients. So if we find the position of 'E' we can access the numbers before and after the 'E'. In the above example 'E' is at 12th 27th 42th 57th 72th positions, if we type P(12) it prints 'E', if we type P(1:12) it prints '2.56942078E' and if we type P(1:12+3) it will print '2.56942078E+00' and we get the 1st coefficient a1. The next coefficient starts from the 4th position after 'E' in each coefficient, and ends at 3 position after the position of 2nd 'E' ie 27th+3 position. So we can access it like this, P((12+4):(27+3)) and we get '-8.59741137E-05' as 2nd coefficient a2. Going on with this logic we get the remaing coefficients and using str2num/str2double command the string will get converted to numbers. For finding position of 'E' use the command strfind(string name, charactor to find(E)) and stored it in a variable Q. The Q looks like this Q=[12 27 42 57 72]. Instead of using 12, 27 ect in the P(1:12+3), P((12+4):(27+3)) commands we can use Q(1) for 12 and Q(2) for 27 and like that. P(1:12+3) become P(1:Q(1)+3) and P((12+4):(27+3)) become P((Q(1)+4):(Q(2)+3)).
- The above logic is used to extract the first 5 coefficients present in that line. For the next line same process is repeated. Using the above logic we can extract the all 14 coefficients of each species by running 53 times in a for loop.
- % Accessing coefficient lines
- c1=fgetl(THM);
- p=strfind(c1,'E');
- a1=str2double(c1(1:p(1)+3));
- a2=str2double(c1(p(1)+4:p(2)+3));
- a3=str2double(c1(p(2)+4:p(3)+3));
- a4=str2double(c1(p(3)+4:p(4)+3));
- a5=str2double(c1(p(4)+4:p(5)+3));
- % Accessing 2nd line for coefficients
- c2=fgetl(THM);
- p1=strfind(c2,'E');
- a6=str2double(c2(1:p1(1)+3));
- a7=str2double(c2(p1(1)+4:p1(2)+3));
- a8=str2double(c2(p1(2)+4:p1(3)+3));
- a9=str2double(c2(p1(3)+4:p1(4)+3));
- a10=str2double(c2(p1(4)+4:p1(5)+3));
- After getting all the 14 coefficients call the Enthalpy, Entropy and Specific heat functions for calculating it for a range of temperature that we defined earlier for the purpose of plotting the graphs and also call the Molicular weight function for calculating molicular weight.
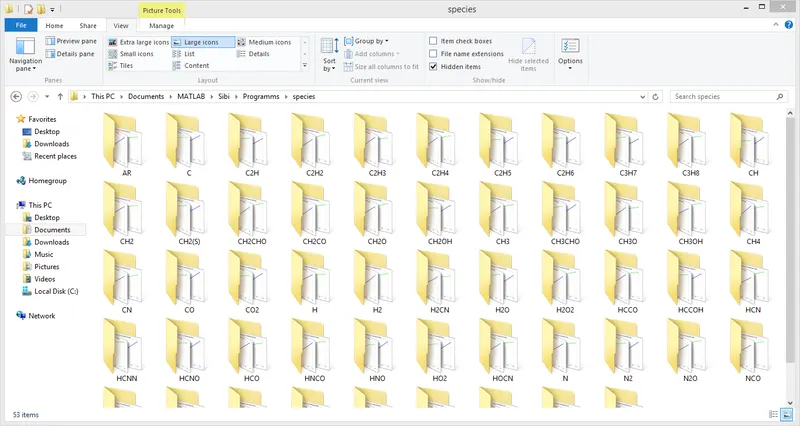
- After this creat the folders to save these graphs separately by using the change directory(cd) and make directory(mkdir) command. Syntax of make directory is mkdir(folder name); and for change directory is cd(newfolder) that is change current folder to new folder. Here we use the cobined form of both cd and mkdir ie inside mkdir command we use the path of the folder on which each of the species folders are to be created. Here the species changes after each loop ie the species name.
- % Creating folders
- mkdir(['C:\Users\Sibin\Documents\MATLAB\Sibi\Programms\species\',species])
- The graphs, Specific heat Vs Temperature, Enthalpy Vs Temperature, Entropy Vs Temperature are created as figure 1, figure 2, figure 3 using plot command and proper labelings are provided.
- For saving the figures in respective folders of each species change current location to the location where the figures to be saved using the change directory(cd) command.
- cd(['C:\Users\Sibin\Documents\MATLAB\Sibi\Programms\species\',species])
- Save the figures using saveas command. saveas(fig,filename)
- saveas(figure(1),'specific_heat.jpg')
- saveas(figure(2),'Enthalpy.jpg')
- saveas(figure(3),'Entropy.jpg')
- Change the current location to the previous location where the enthalpy entropy specific heat molecular weight functions, the THERMO.dat file are saved in order to run the next for loop otherwise the program don't work.
% Write a function that extracts the 14 co-efficients and calculates the
% enthalpy, entropy and specific heats for all the species in the data
% file NASA thermodynamic data

clear all
close all
clc

% Opening the file and get the 1st line
% reading the headerinformations
THM=fopen('THERMO.dat','r');
A=fgetl(THM);

% get the 2nd line
l1=fgetl(THM);

% splitting the line
g_temp=strsplit(l1,' ');

% Converting the charactors in to numbers and stored separately
g_lowtemp=str2double(g_temp(2));
g_midtemp=str2double(g_temp(3));
g_hightemp=str2double(g_temp(4));

% skipping lines
for i=1:3
    fgetl(THM);
end

for i=1:53
% Universal gas constant J/mol K
R=8.314;

% temparature range
T=linspace(300,5000,1000);

% Getiing species line
t_line=fgetl(THM);

% splitting species line
sp=strsplit(t_line,' ');

% Assigning species and temperature values
species=sp{1};
lowtemp=str2double(sp(end-3));
midtemp=str2double(sp(end-1));
hightemp=str2double(sp(end-2));

% Accessing coefficient lines
c1=fgetl(THM);
p=strfind(c1,'E');
a1=str2double(c1(1:p(1)+3));
a2=str2double(c1(p(1)+4:p(2)+3));
a3=str2double(c1(p(2)+4:p(3)+3));
a4=str2double(c1(p(3)+4:p(4)+3));
a5=str2double(c1(p(4)+4:p(5)+3));

% Accessing 2nd line for coefficients
c2=fgetl(THM);
p1=strfind(c2,'E');
a6=str2double(c2(1:p1(1)+3));
a7=str2double(c2(p1(1)+4:p1(2)+3));
a8=str2double(c2(p1(2)+4:p1(3)+3));
a9=str2double(c2(p1(3)+4:p1(4)+3));
a10=str2double(c2(p1(4)+4:p1(5)+3));

% Accessing 3rd line for coefficients
c3=fgetl(THM);
p2=strfind(c3,'E');
a11=str2double(c3(1:p2(1)+3));
a12=str2double(c3(p2(1)+4:p2(2)+3));
a13=str2double(c3(p2(2)+4:p2(3)+3));
a14=str2double(c3(p2(3)+4:p2(4)+3));

% Calling Spesific heat function for calculating specific heat
C_p= specific_heat(a1,a2,a3,a4,a5,a8,a9,a10,a11,a12,R,T,midtemp);

% Calling Enthalpy function for calculating Enthalpy
H= enthalpy(a1,a2,a3,a4,a5,a6,a8,a9,a10,a11,a12,a13,R,T,midtemp);

% Calling Entropy function for calculating Entropy
S= entropy(a1,a2,a3,a4,a5,a7,a8,a9,a10,a11,a12,a14,R,T,midtemp);

% Calling Molecular weight function for calculating Molecular weight
MW=Molecular_Wt(species);

% Creating folders
mkdir(['C:\Users\Sibin\Documents\MATLAB\Sibi\Programms\species\',species])

% Plotting Spesific heat Vs Temperature Graph
figure(1)
plot(T,C_p,'LineWidth',3,'Color','r')
title(sprintf(('Specific Heat Vs Temperature of %s'),species),'Color','k')
xlabel('Temperature [K]','Color','b')
ylabel('Specific Heat [KJ/(Kg K)]','Color','r')
grid on

% Plotting Enthalpy Vs Temperature Graph
figure(2)
plot(T,H,'LineWidth',3,'Color','b')
title(sprintf(('Enthalpy Vs Temperature of %s'),species),'Color','k')
xlabel('Temperature [K]','Color','b')
ylabel('Enthalpy [KJ]','Color','r')
grid on

% Plotting Entropy Vs Temperature Graph
figure(3)
plot(T,S,'LineWidth',3,'Color','g')
title(sprintf(('Entropy Vs Temperature of %s'),species),'Color','k')
xlabel('Temperature [K]','Color','b')
ylabel('Entropy [KJ/K]','Color','r')
grid on

% Change the location to save the graphs
cd(['C:\Users\Sibin\Documents\MATLAB\Sibi\Programms\species\',species])
saveas(figure(1),'specific_heat.jpg')
saveas(figure(2),'Enthalpy.jpg')
saveas(figure(3),'Entropy.jpg')
% Change the location to run the next for loop
cd(['C:\Users\Sibin\Documents\MATLAB\Sibi\Programms\'])
end
Function Codes
Specific Heat Function
- Here the loop is created using the if-else command.
- As per the equation `C_p/R=a_1+a_2*T+a_3*T^2+a_4*T^3+a_5*T^4` the condition is if the temperature is high use the 1st 7 coefficients and if the temperature is low use last 7 coefficients. That is if the temperature T is less than the local mid temperature provided for each species use last 7 coefficients for calculation of specific heat using the equation otherwise use 1st 7 coefficients.
- Used this condition inside the if-else loop
% Spesific heat function for calculating specific heat

function C_p= specific_heat(a1,a2,a3,a4,a5,a8,a9,a10,a11,a12,R,T,midtemp)
if      T<=midtemp
        C_p=( a8 + a9*T + a10*(T.^2) + a11*(T.^3) + a12*(T.^4))*R;
else
        C_p=( a1 + a2*T + a3*(T.^2) + a4*(T.^3) + a5*(T.^4))*R;

end
end
Enthalpy Function
- Here the loop is created using the if-else command.
- As per the equation `H/(RT)=a_1+(a_2*T)/2+(a_3*T^2)/3+(a_4*T^3)/4+(a_5*T^4)/5+a_6/T` the condition is if the temperature is high use the 1st 7 coefficients and if the temperature is low use last 7 coefficients. That is if the temperature T is less than the local mid temperature provided for each species use last 7 coefficients for calculation of specific heat using the equation otherwise use 1st 7 coefficients.
- Used this condition inside the if-else loop
% Enthalpy function for calculating Enthalpy

function H= enthalpy(a1,a2,a3,a4,a5,a6,a8,a9,a10,a11,a12,a13,R,T,midtemp)
if      T<=midtemp
        H=(a8 + (a9/2)*T + (a10/3)*(T.^2) + (a11/4)*(T.^3) + (a12/5)*(T.^4) + a13./T).*T*R;

else
        H=(a1 + (a2/2)*T + (a3/3)*(T.^2) + (a4/4)*(T.^3) + (a5/5)*(T.^4) + a6./T).*T*R;
end
end
Entropy Function
- Here the loop is created using the if-else command.
- As per the equation `S/R=a_1*lnT+a_2*T+(a_3*T^2)/2+(a_4*T^3)/3+(a_5*T^4)/4+a_7` the condition is if the temperature is high use the 1st 7 coefficients and if the temperature is low use last 7 coefficients. That is if the temperature T is less than the local mid temperature provided for each species use last 7 coefficients for calculation of specific heat using the equation otherwise use 1st 7 coefficients.
- Used this condition inside the if-else loop
% Entropy function for calculating Entropy

function S= entropy(a1,a2,a3,a4,a5,a7,a8,a9,a10,a11,a12,a14,R,T,midtemp)
if      T<=midtemp
        S=(a8*log(T) + a9*T + (a10/2)*(T.^2) + (a11/3)*(T.^3) + (a12/4)*(T.^4) + a14)*R;

    else
        S=(a1*log(T) + a2*T + (a3/2)*(T.^2) + (a4/3)*(T.^3) + (a5/4)*(T.^4) + a7)*R;

end
end
Molecular Weight Function
- Molecular weight is the sum of atomic mass of individual atoms present in a molecule.
- Here the 53 species present in the THERMO.dat file is various cobinations of Hydrogen(H), Carbon(C), Nitrogen(N), Oxygen(O) and Argon(A). Firstly created an array containing these atoms name as Atomic_name=['H','C','N','O','A']; and an array containing its respective atomic mass as Atomic_mass=[1.008 12.011 14.007 15.999 39.948];
- If simply saying the logic is comapre the atomic name array provided above with the individual characters of name of the species which is stored in a variable called 'species' at the bigining of the program and if it match then add up the respective atomic masses and finaly print the molecular weight of the molecule.
- Put MW=0 at first. 2 for loops are used here. In the 1st for loop i changes from 1 to length of the species that get from the main program. Then in the 2nd for loop j changes from 1 to length of the attomic name array created by us. Then inside the 2nd for loop provide the if-else command to compare the individual characters of species name with the atomic name using string compare (strcmp) command and if it matches then the respective atomic mass addup to the MW and the corresponding j value is stored in the variable 'position'. Then after that outside the 2nd for loop and in side the 1st for loop write code for checking whether the same atom is present in the variable 'species' more no.of times by checking the presence of number in it. For that we use str2num command as n=str2num(species(i)); and stored the value in the variable n.
- Then check whether the variable n>1 inside an if command if it is true then the correspond atomic mass multiplied by n-1 no.of times (because one atomic mass of same atom already added during the 2nd for loop) and added it to the previously calculated MW.
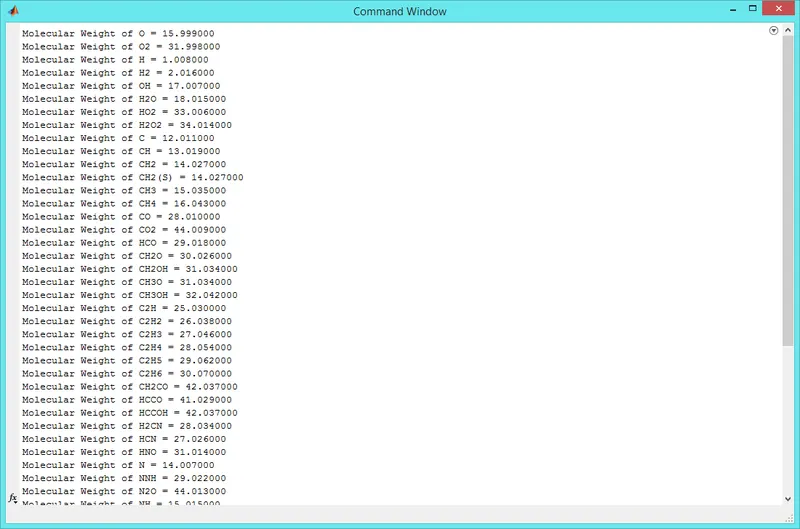
- There by calculated Molecular weight of each species. Out side the all for loop finaly use fprintf command to display the molecular weight of each species on the command window after each loop in the main program.
- fprintf('Molecular Weight of %s = %f\n',species,MW)
% Function for calculating Molecular weight

function MW=Molecular_Wt(species)

% Defining inputs
Atomic_name=['H','C','N','O','A'];
Atomic_mass=[1.008 12.011 14.007 15.999 39.948];
MW=0;
for i=1:length(species)
    for j=1:length(Atomic_name)
        if strcmp(species(i),Atomic_name(j))
            MW=MW+Atomic_mass(j);
            position=j;
        end
    end

    % Checking whether same atom is present there more no.of times
   n=str2num(species(i));
   if n>1
       MW=MW+Atomic_mass(position)*(n-1);
   end
end

% Displaying the molecular weight on the screen
fprintf('Molecular Weight of %s = %f\n',species,MW)
Output
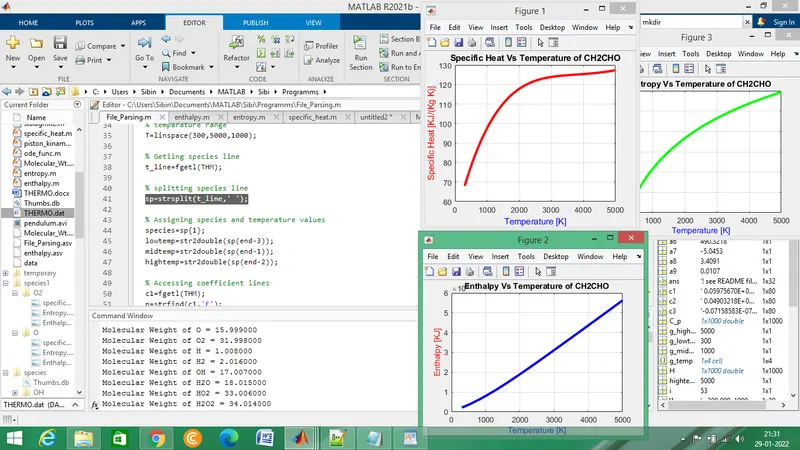
- Final output showing the graph and molicular weight of 53rd molecule in the THERMO.dat file
- Command window showing the molecular weight of all Species
- Folders created to save the graphs of each species
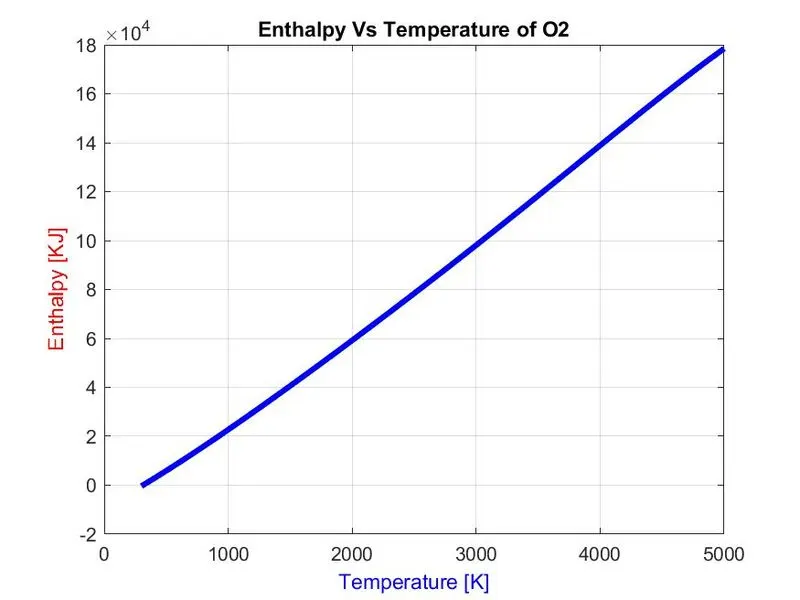
- Graph between Enthalpy Vs Temperature for O2
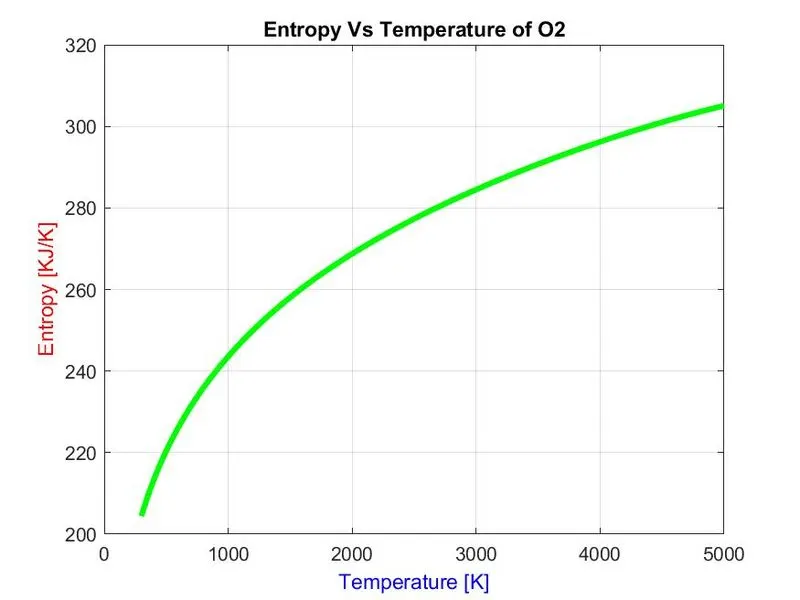
- Graph between Entropy Vs Temperature for O2
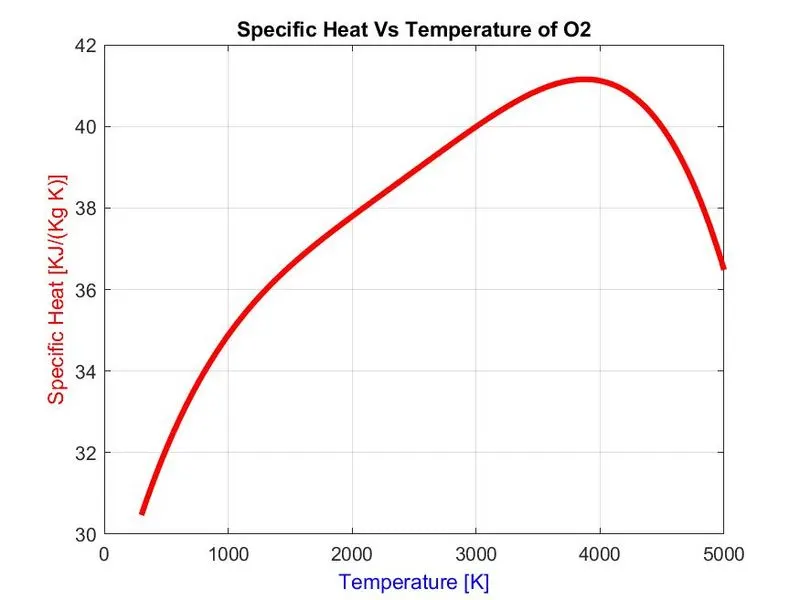
- Graph between Specific Heat Vs Temperature for O2
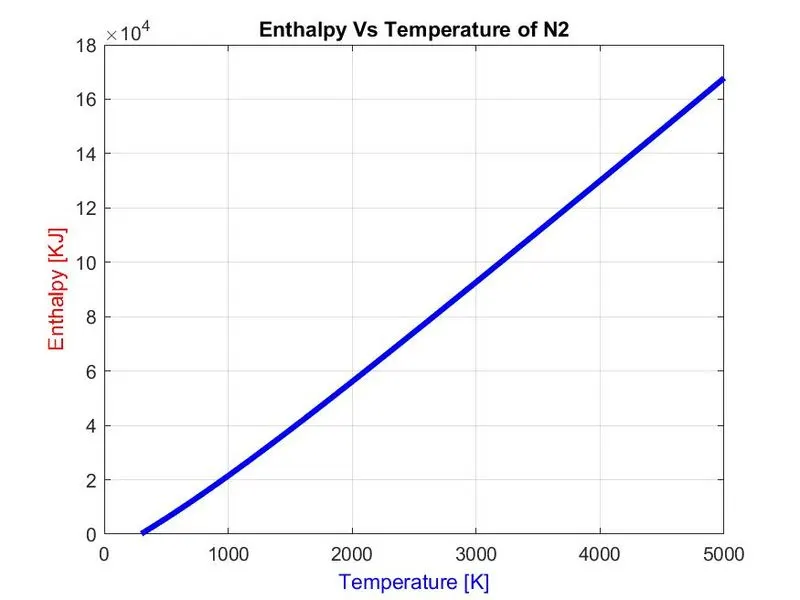
- Graph between Enthalpy Vs Temperature for N2
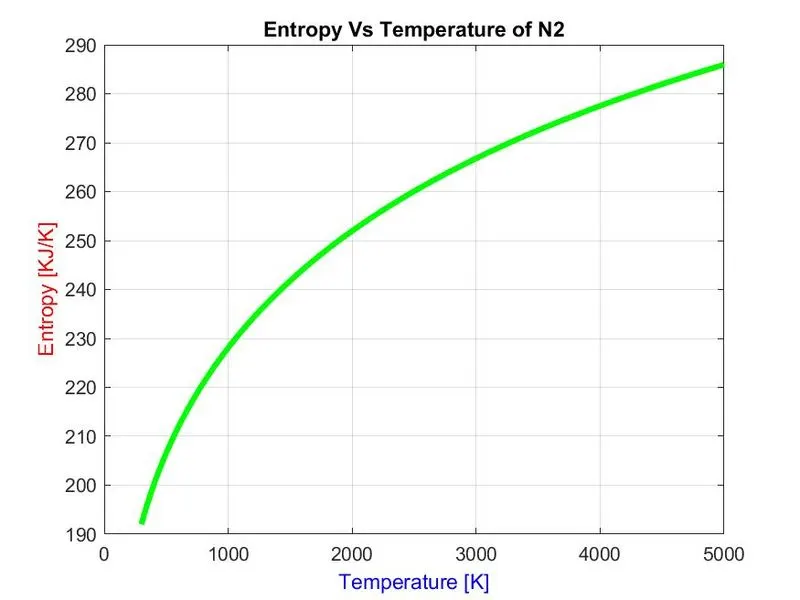
- Graph between Entropy Vs Temperature for N2
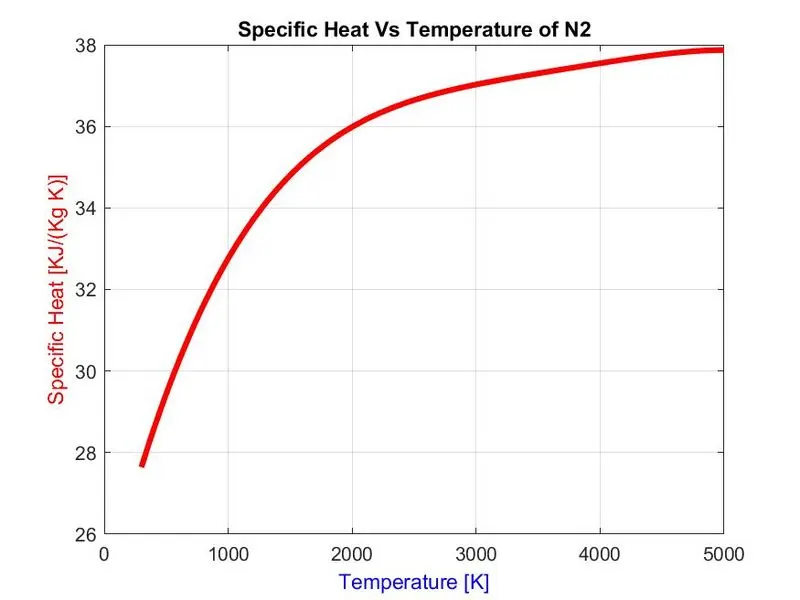
- Graph between Specific Heat Vs Temperature for N2
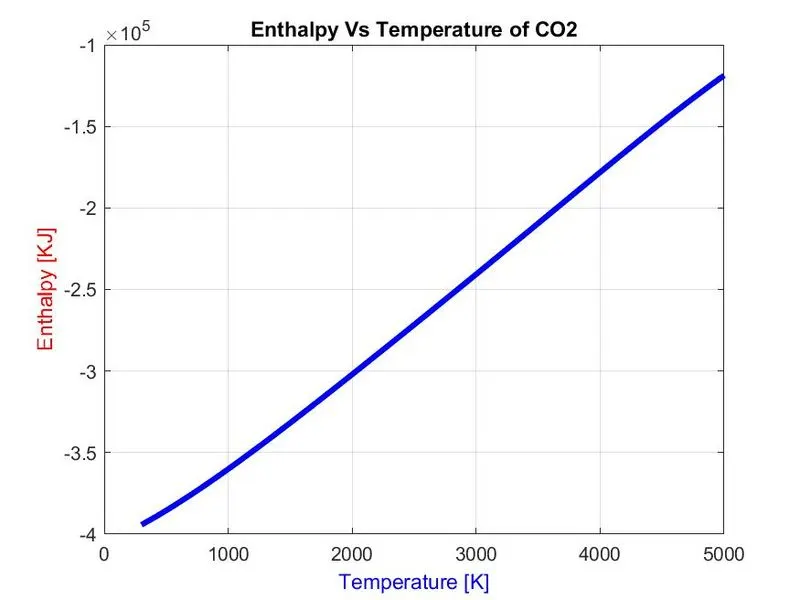
- Graph between Enthalpy Vs Temperature for CO2
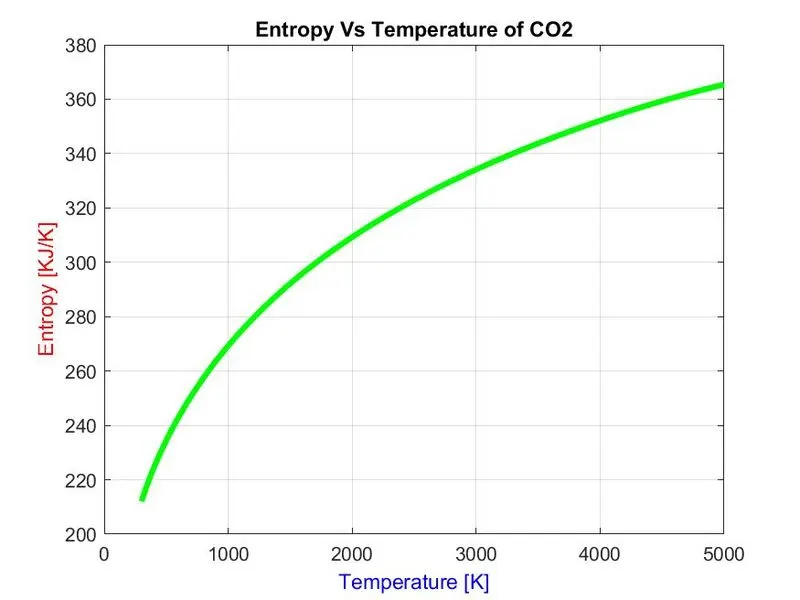
- Graph between Entropy Vs Temperature for CO2
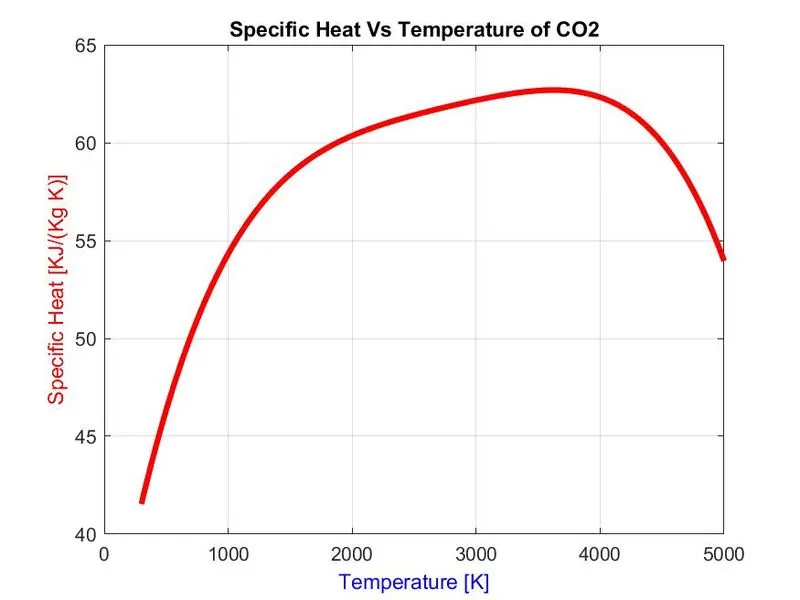
- Graph between Specific Heat Vs Temperature for CO2
Errors and Problems faced While Programming
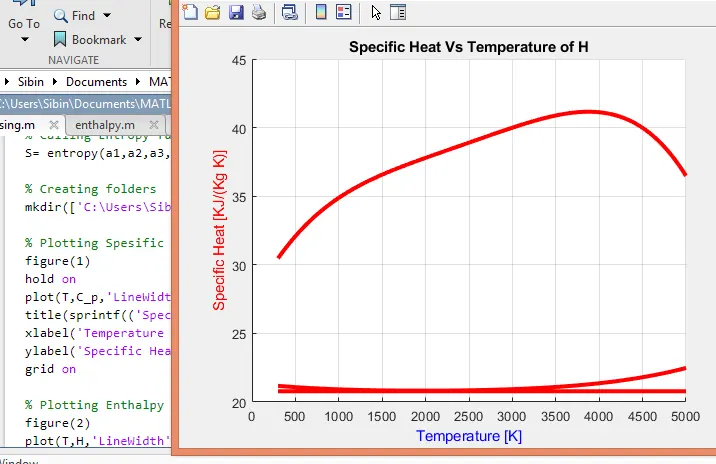
- Error occured due to lack of providing dot product for multiplication. Corrected by providing dot.

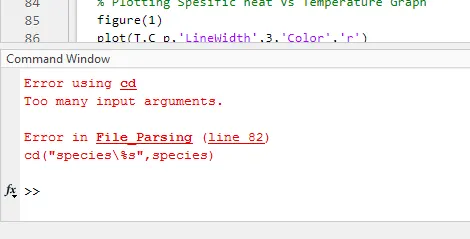
- Error occured due to not using correct syntax for cd command. Corrected by using proper syntax for cd.
- The remains of previous graphs occured due to the presence of hold on command in the plotting part. Corrected by removing hold on command.
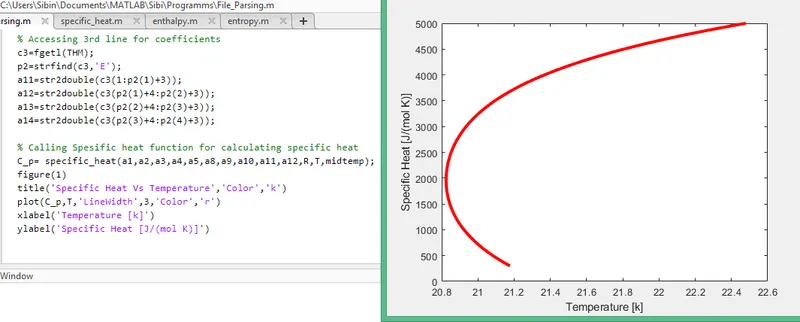
- Problem occured due to the mistake in plot command. The x axis represent temperature but in plot command in the place of x value provided specific heat value instead of temperature value. Corrected by rearranging it.
Conclusion
- The program that extracts the 14 co-efficients and calculates the enthalpy, entropy and specific heats for all the species in the NASA thermodynamic data file was created and exicuted successfully.
- The function for calculating enthalpy, entropy, specific heat and molecular weight were created and calculated.
- The plots, Enthalpy Vs Temperature, Entropy Vs Temperature and Specific heat Vs Temperature were plotted for each species and saved properly in their autogenerated floders successfully using the program.
- Molecular weight of each species was calculated and displayed it on the command window.
- It helps to understand the file parsing, its applications and how it could be implimented correctly to get better results.
References
- https://en.wikipedia.org/wiki/Parsing
- https://in.mathworks.com/matlabcentral/answers/497882-parsing-text-files-for-beginners
- https://in.mathworks.com/help/matlab/ref/cd.html?searchHighlight=cd&s_tid=srchtitle_cd_1
- https://in.mathworks.com/help/matlab/ref/mkdir.html?searchHighlight=mkdir&s_tid=srchtitle_mkdir_1
- https://in.mathworks.com/help/matlab/ref/saveas.html?s_tid=doc_ta