Week - 4
AIM : To stimulate by implementing control logic using state flow for a washing machine and for gear shifting system.
OBJECTIVES : 1. Implement control logic of washing machine using state flow as per conditions.
2. Make a simulink chart for the gear shift logic as per conditions.
THEORY :
A finite state machine is a representation of an event driven system. In an event driven system, the system responds to an event by a transition one state to another. This transition occurs if the condition defining the change is true.
A state flow is a graphical representation of a finite state machine, states and transition from the basic elements of the system. We can also represent state less flow chart. A state flow chart can use MATLAB as action language to implement control logic.
1. WASHING MACHINE
A simulation must be performed using simulink by implementing above mentioned control logic using state flow. For that, we are provided with some conditions. They are mentioned below.
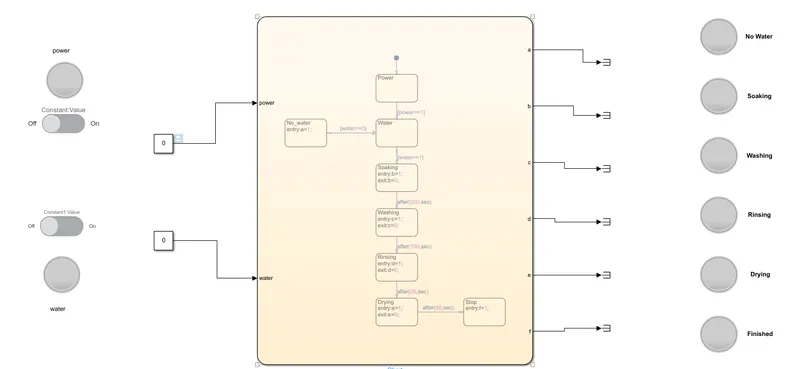
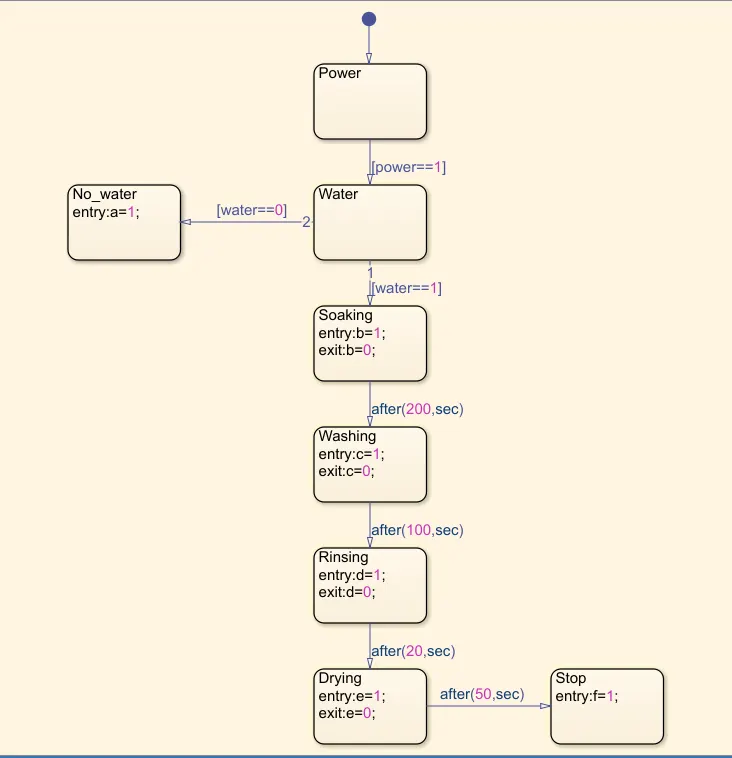
If the power supply is available, the system gets activated. If the water supply is not available, stop the process and indicate through LED. Soaking time should be 200 seconds followed by washing time of 100 seconds. Then rinsing happens for the next 20 seconds and dryer runs for 50 seconds. After all of these processes has been completed turn on finished LED. Model for these conditions are given below :
MODEL AND CHART:
EXPLANATION :
- Chart, terminator, slider switch, lamp and constant blocks are the main blocks used in this model. I have provided slider switch for power supply and for water supply.
- Two lamps are also provided to indicate those supplies. A constant block is used to connect the switch and the lamp. Terminator is used to connect the output lamps and it will give us the indications from the chart.
- We provide our conditions as logic inside the chart block. State block will define the state and transition arrows are used to give changes in the state. Input transition provides our external input into the state.
- If any condition that we provide is true, then the output value will be one and if the condition is not satisfied or condition is false, then output will be zero. Graphical blocks from dash board also show the output according to inputting zero and one.
- When power is on, the process will get initiated. Next state is water supply. If water supply is zero or if there is no water supply, then the process will get terminated. From output port 'a' true signal will be shown. If there is water supply, then the process will get continued to the next block.
- Soaking block will run for the next 200 seconds because we have given that as transition condition. During this time output signal port 'b' will be active. When this state is complete, it will transit into washing state.
- There also we are provided a transition condition, which is after 100 seconds. So washing state will continue for 100 seconds and 'c' port will be on.
- Similarly rinsing and soaking will get performed according to our provided consitions and it will be shown in respected outputs ports. We have already connected lamps blocks to these ports. So we will be able to see the output as light signals externally.
Conditions and their models :
1.When power is on and there is no water supply.
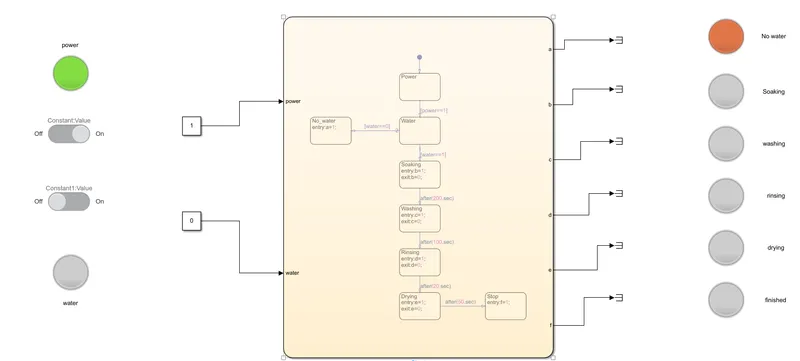
2. Stateflow got terminated and LED connected to no water supply state turned ON.
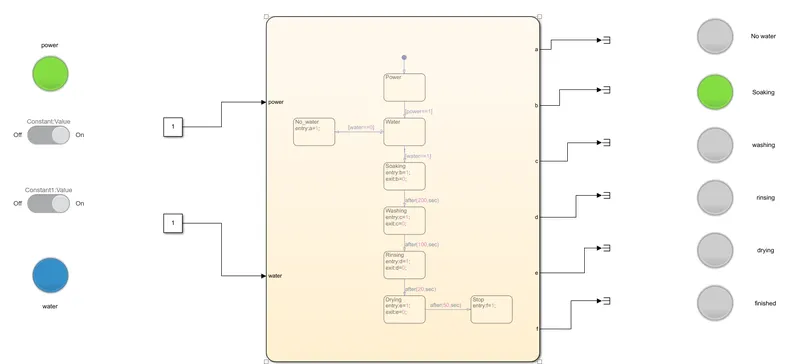
3. For the first 200 seconds, soaking process continued. State block for soaking is highlighted and LED connected to soaking output is displayed.
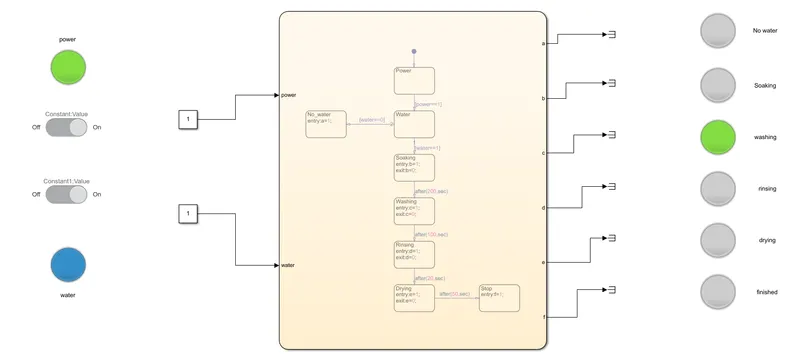
4. Washing is carried out for 100 seconds and the output LED indicated that process for 100 seconds.
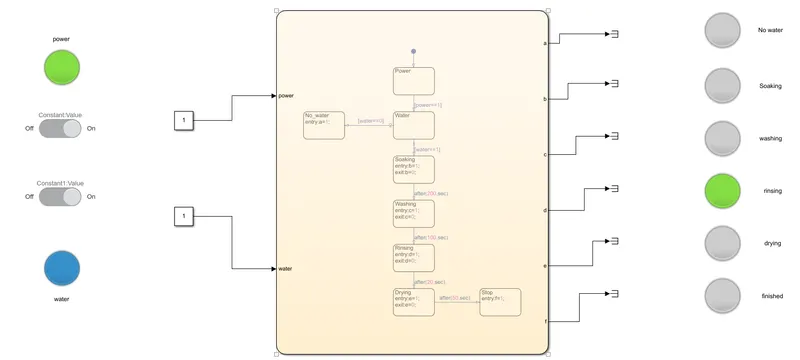
5. After washing and rinsing processes are completed it is displayed through LED. As per given consitions, the dryer process is carried out after rinsing.
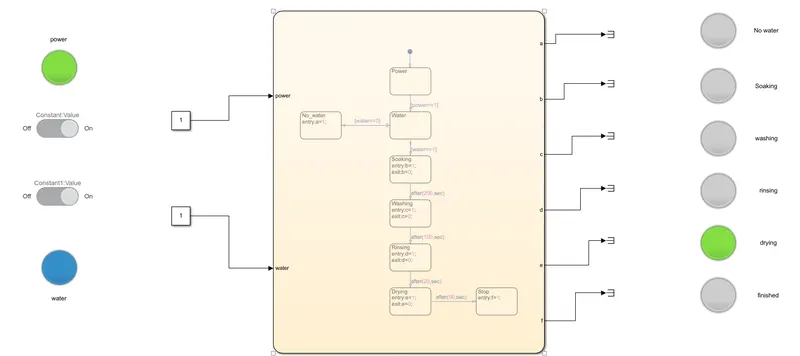
6. When the power supply and water supply are given to the system, the whole process is carried out and finally LED corresponding to the finished gets turned ON. Hence, the state flow simulation is completed.
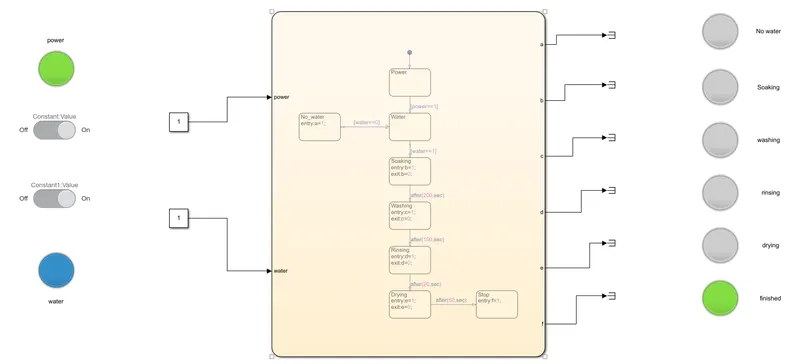
2. GEAR SHIFT
Speed Range(kmph) Gear
0 to 15 1
16 to 25 2
26 to 40 3
41 to 60 4
Above 61 5
To make a simulink chart for the gear shift as per conditions given above.
The designed model should be capable to take speed input while the simulation is running and should display the corresponding gears.
MODEL AND CHART :
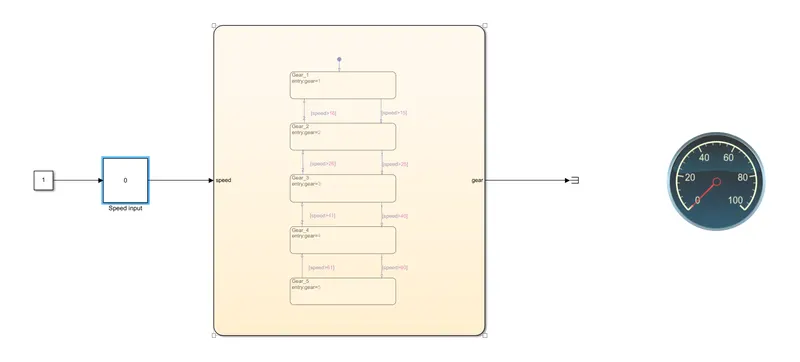
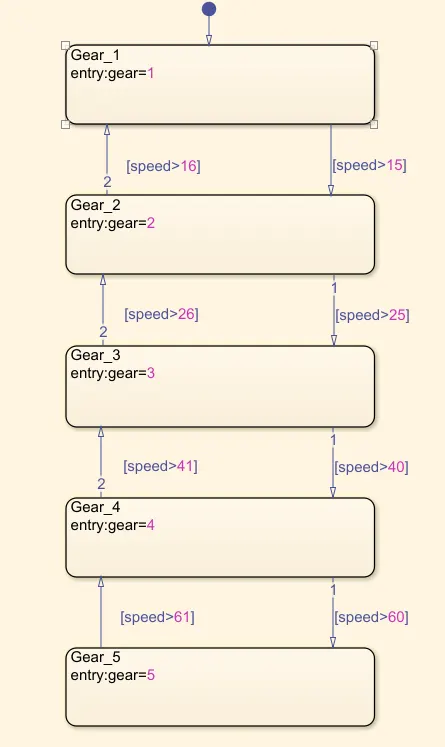
EXPLANATION :
Here, I have now given a speed input to the chart block nd out is displayed through display block from dashboard. We have a condition that, a varying speed input should be given into the system. For that a slider gain block is used. Block parameter is given below.
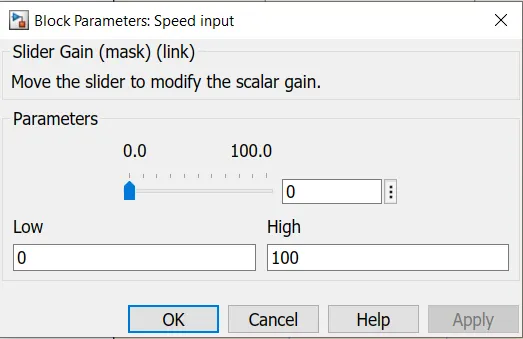
- Now I have implemented the given conditions as control logic using state flow. As mentioned in above simulation, I have used state block and transition condition for this.
- From 0 to 15 Km/hr, the gear will be in first gear. When the speed exceeds the limit, gear will be changed to second though first transition condition. If speed increase more than twenty five, then second transition will be true. So state will get changed to third state which is third gear. Similarly fourth and fifth gear will be selected according to speed conditions given.
CONDITIONS AND RESULTS:
During simulation, we can change the speed input using slider gain block. So the different input conditions and corresponding results is given below :
1. Speed = 18 km/hr
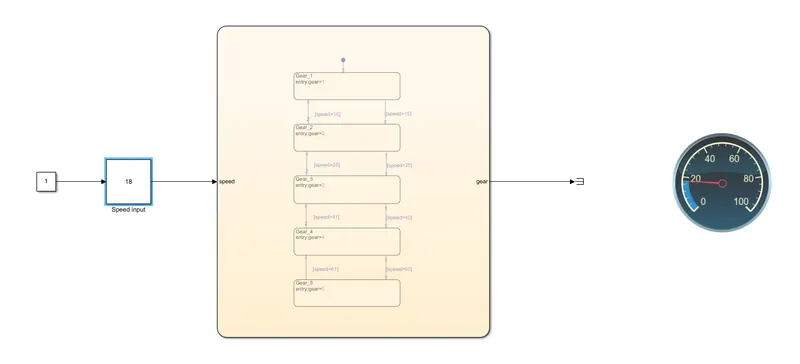
Here, the speed is between 15 km/hr to 25 km/hr so the display is showing second gear running. The gauge is connected to the slider gain(speed input) which represents the speed.
2. Speed = 38 km/hr
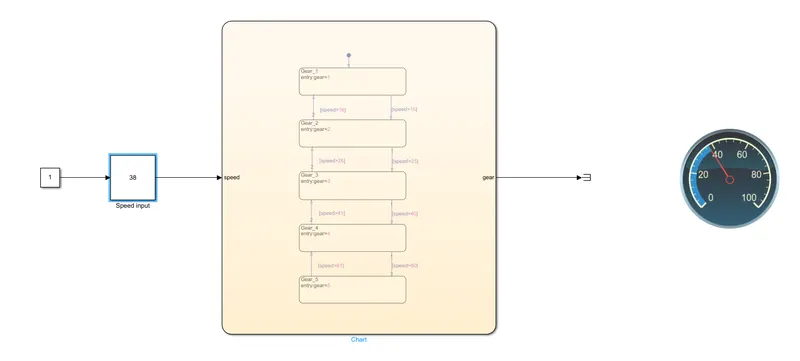
Here, the speed is between 25 km/hr to 40 km/hr so the display is showing third gear running. The gauge is connected to the slider gain(speed input) which represents the speed.
3. Speed = 50 km/hr
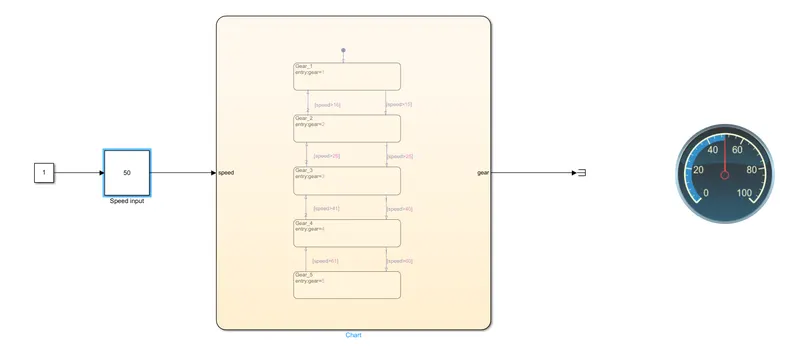
Here, the speed is between 40 km/hr to 60 km/hr so the display is showing fourth gear running. The gauge is connected to the slider gain(speed input) which represents the speed.
4. Speed = 90 km/hr
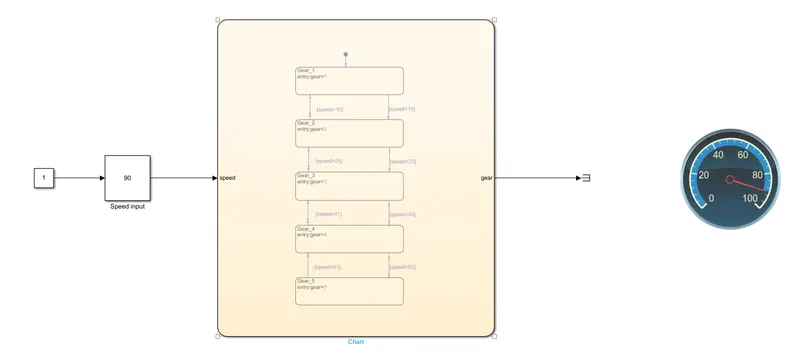
Here, the speed is above 60 km/hr so the display is showing fifth gear running. The gauge is connected to the slider gain(speed input) which represents the speed.
CONCLUSION :
Washing machine and Gear shift system were modelled and designed according to the given conditions. It was evaluated with different input conditions and results were observed.
REFERENCE :
https://in.mathsworks.com/help/stateflow/ref/chart.html