Week - 4
TITLE:- To Making The model for "Washing Machine Simulation & Gear Shifting"
Aim :-
- To make control logic of a"Washing Machine" using stateflow.
- To create Simulink chart for the"Gear Shift" logic.
THEORY:-
What is Control Logic:-
Control logic is a key part of a software program that control the operations of the program.
QUESTION:- 01
- Implement control logic of a “washing machine” using Stateflow as per given sequence: -
i) If the power supply is available, the system gets activated
ii) If the Water supply is not available, stop the process & indicate through LED
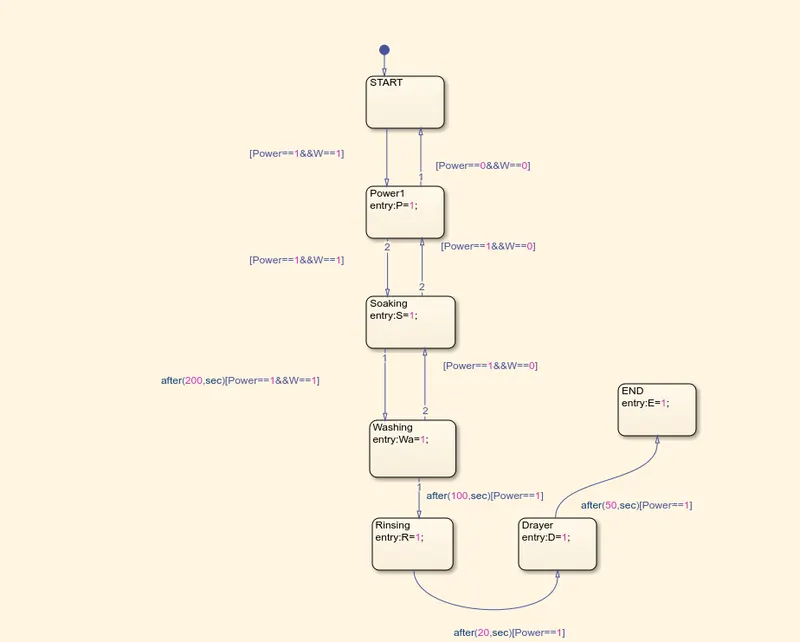
iii) Soaking time should be 200s followed by Washing time of 100s.
iv) Then rinsing happens for next 20s & dryer runs for 50s
After all the processes have completed turn on the finished LED.
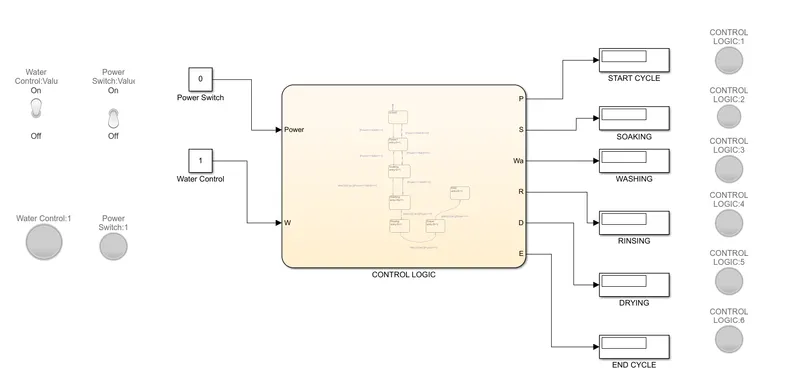
BLOCK DIAGRAM FOR "WASHING MACHINE":-
Block used in this model and its means:-
1) Chart:-
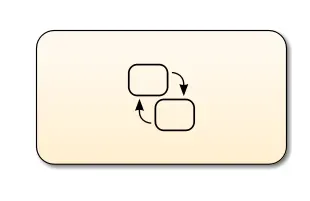
State flow is a graphical reprensentation of finite state machine.the system response to event making a transition from one state to another. this transition occurs if the condition defining the change is true.
2) Lamp:-
The lamp block displays a color indicating the value of the input signal.

3) Toggle Switch:-
It is used for to set the input parameter ON/OFF value.

Explanation of Control Logic:-
We have Toggle Switch from the dashboard library is used with a constant block used the Power and water supply inputs. it is used to set the inputs value parameter ON/OFF value set.The power status is checked at the entry for every state.the water supply is checked for the soaking and the rinsing process state.We have used Two constant block are connected to the input ports Power and W supply. In this model are two condition 1) when lamp show Green Color, the the washing machine is in progress.2) when the lamp show Red color,the stop the all state.
FLOW CHART DIAGRAM:-
GIVING INPUT AND OUTPUT DATA (PARAMETER) FOR CHART:-
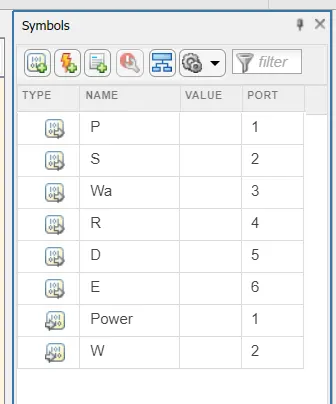
We have give the Inputs of the chart:-Power(power supply) and W(water supply).
We have give the Outputs of the chart:- P(start),S(soaking),Wa(washing),R(rinsing),D(dryer) and E(end the cycle).
CONDITION:-01) When the Power supply is available and the Water supply is not available and check for output:-
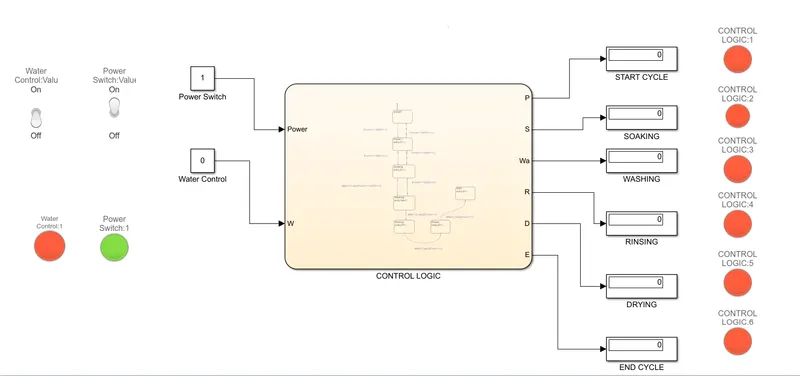
FIG:- Implementing control logic of a "Washing Machine" using stateflow.
We can see above diagram, when there is no water supply the all state is stop and the the indicator lamp of water supply is showing RED color. again we can see in Display block value showing "0". it is means there is no Input.
CONDITION:-2) When the both Power supply and Water supply is Available and check for output:-
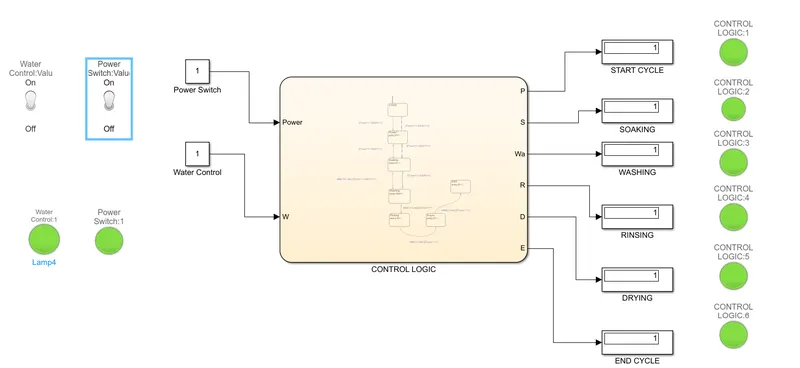
FIG:- Implementing control logic of a "Washing Machine" using stateflow.
We can observe from above figure, the all Process(State) Completion indicator showing GREEN Color.we can see in Display block value showing "1". it is means there is Input.
Give speed input while the simulation is running & display the gear number.
QUESTION:- 02
Make a Simulink chart for the “Gear shift” logic as per below conditions:-
Speed Range(kmph) Gear
0 to 15 1
16 to 25 2
26 to 40 3
41 to 60 4
Above 61 5
Give speed input while the simulation is running & display the gear number.
Block digram of "Gear Shifting":-
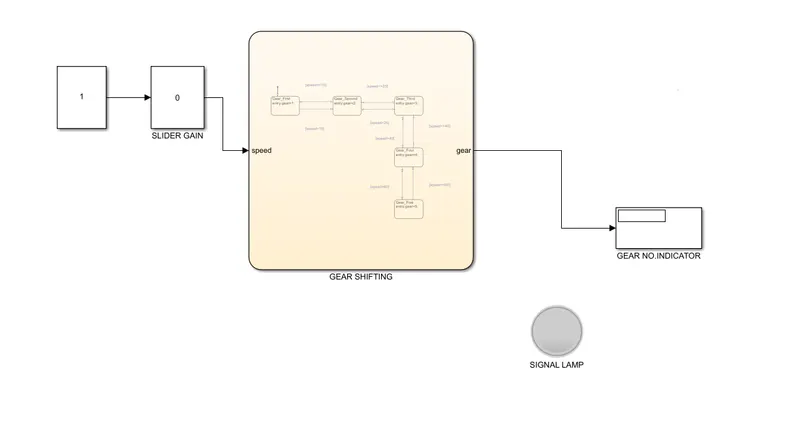
FIG:- Gear Shifting Logic Control.
Block used in this model and its means:-
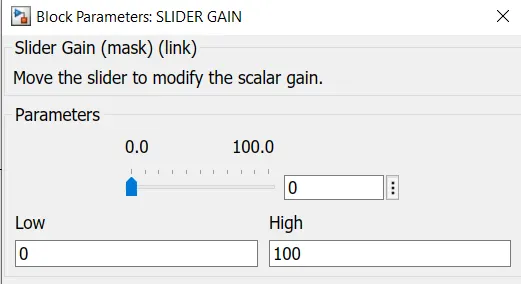
Slider Gain Block:- The Slider Gain block allow you to vary a scalar gain during a simulation using a slider. The block accepts one Input & Generate one Output.We have give The scalar range(Speed) from Low(0) To High(100) Value.
Flow chart for Gear Shifting:-
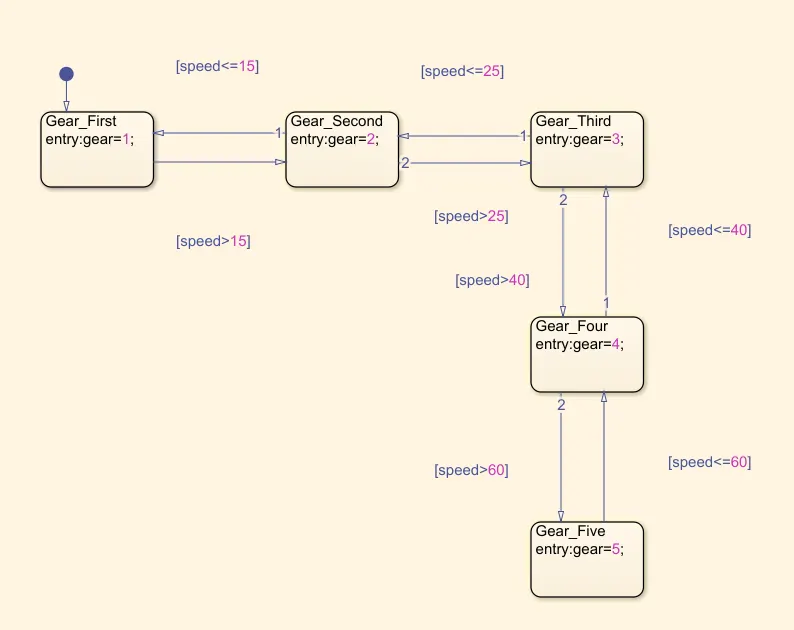
GIVING INPUT AND OUTPUT DATA (PARAMETER) FOR CHART:-
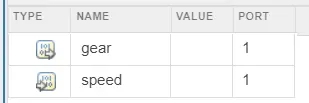
We have give the Inputs of the chart:- speed in (Km/H).
We have give the Outputs of the chart:-gear number.
CONDITION FOR "GEAR SHIFTING":-
Speed Range(kmph) Gear
0 to 15 1
16 to 25 2
26 to 40 3
41 to 60 4
Above 61 5
Condition:- 1) We have give Speed Range from 0 To 15 Km/h in Silder gain block-
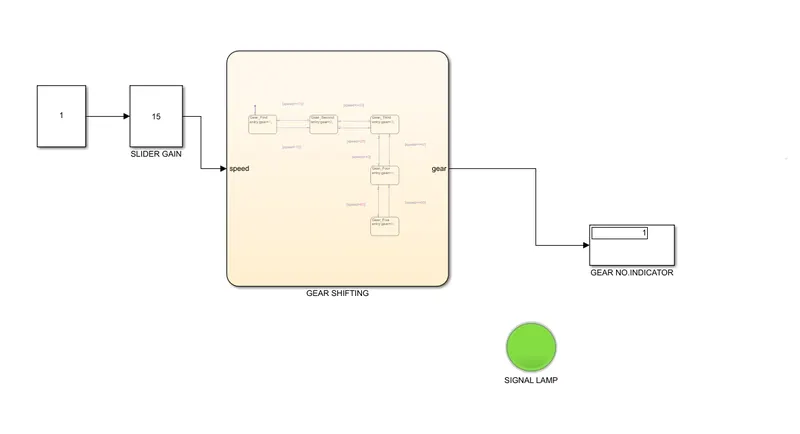
We can observe above diagram, We have give Speed Range from 0 To 15 Km/h in Silder gain block and the number of gear show "1" in Display block. It is indicator by showing "Green" Color.
Condition:- 2) We have give Speed Range from 16 To 25 Km/h in Silder gain block-
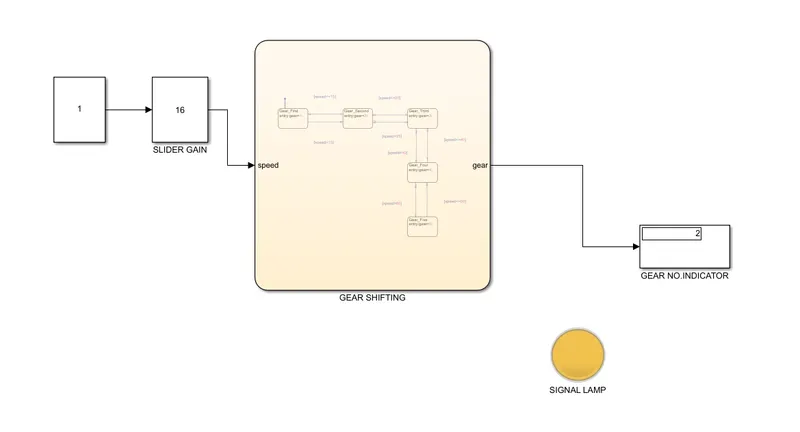
We can observe above diagram, We have give Speed Range from 16 To 25 Km/h in Silder gain block and the number of gear show "2" in Display block. It is indicator by showing "Yellow" Color.
Condition:- 3) We have give Speed Range from 26 To 40 Km/h in Silder gain block-
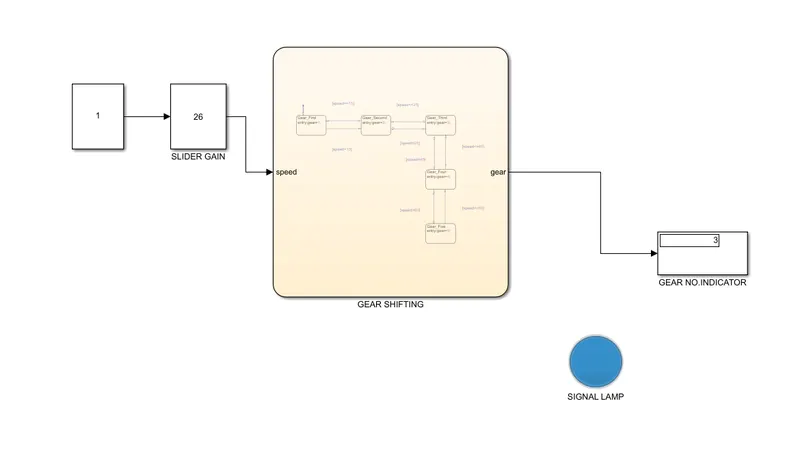
We can observe above diagram, We have give Speed Range from 26 To 40 Km/h in Silder gain block and the number of gear show "3" in Display block. It is indicator by showing "Blue" Color.
Condition:- 4) We have give Speed Range from 41 To 60 Km/h in Silder gain block-
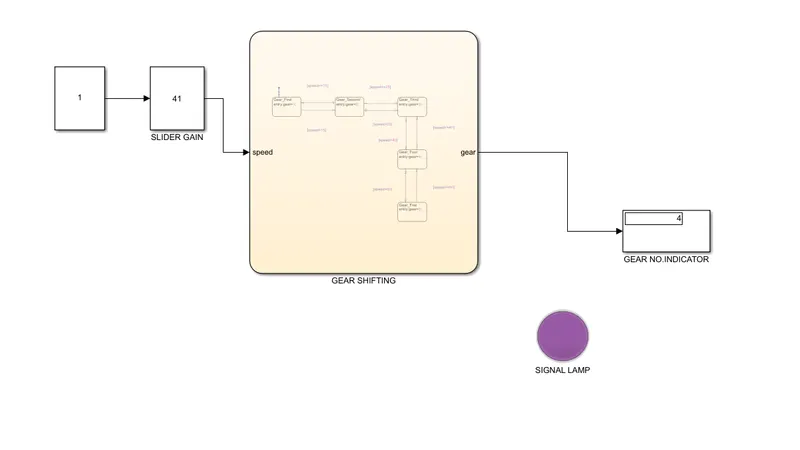
We can observe above diagram, We have give Speed Range from 41 To 60 Km/h in Silder gain block and the number of gear show "3" in Display block. It is indicator by showing "Purpul" Color.
Condition:- 5) We have give Speed Range Above 61 Km/h in Silder gain block-
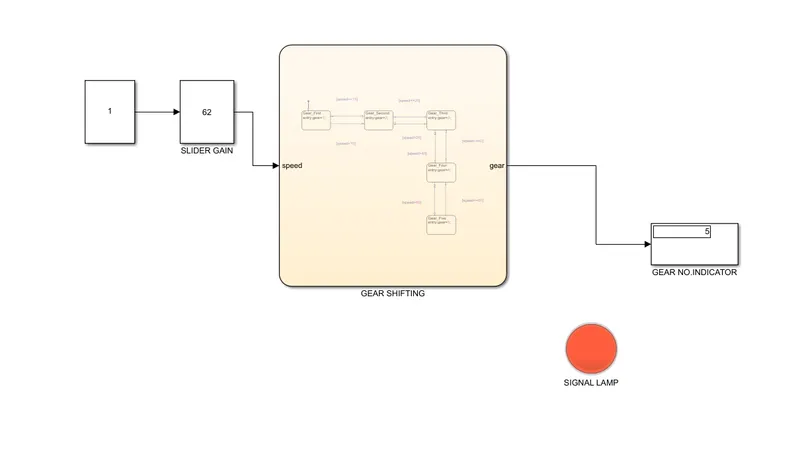
We can observe above diagram, We have give Speed Range Above 61 Km/h in Silder gain block and the number of gear show "3" in Display block. It is indicator by showing "Red" Color. The red color mean Vehicle Speed is go above 61km/h.
CONCLUSION:-
1) The model has been successfully done using simulink tool in Matlab.
2) To Create the model for "Washing Machine" using State Flow is done.
3) To Made the model for "Gear Shifting" Using State Flow is done.