Week - 4
(1) AIM : To implement control logic of a washing machine using state flow.
INTRODUCTION :
CONTROL LOGIC : It is model system logic using state machine, Flow chart and truth tables
EXAMPLE FOR CONTROL LOGIC : Washing machine using stateflow. State flow is a simulink tool to implement the state machine. Here model system logic of a washing machine using state flow has been done.
So the state machine and the state transition can help us to makee a chart in a matlab simulink state flow environment
BLOCKS USED :
CONSTANT BLOCK, CHART, LAMP, DISPLAY, JUNCTION, STATE
PROCEDURE :
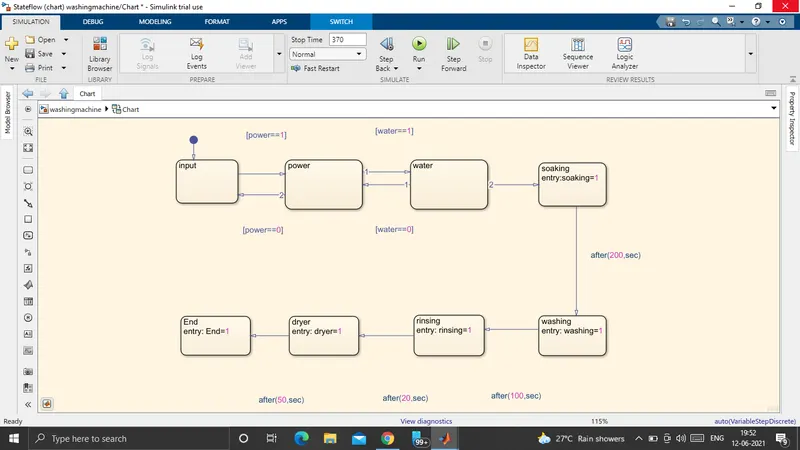
Firstly take the chart block, In the chart block do the sequence procedure.
Take the state blocks in chart the amount we require.
In state block use the given condition of washing machine
The variables used in constants are linked to the rocker switches named power and water. These variables are given as input to the chart.
Each condition should satisfy then only it goes to the next step.
The chart model is shown below
All the output signals from the chart are connected to lamps to indicate whether a particular process have finished or not. Each lamp is named by the corresponding process.
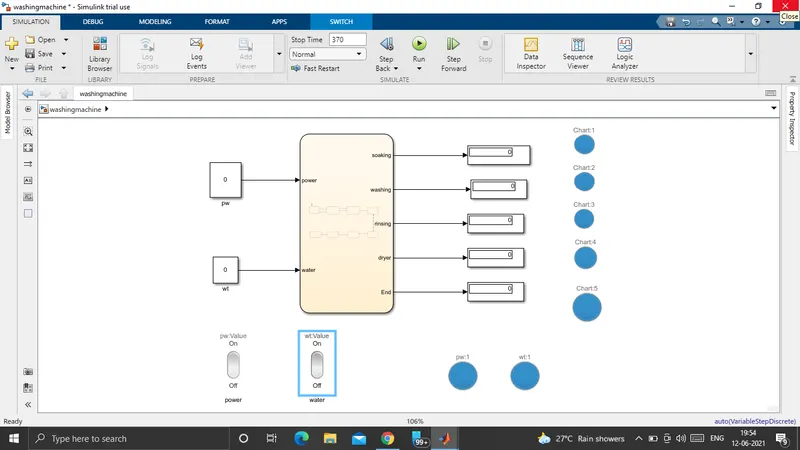
CASE 1 : POWER AND WATER SUPPLY ARE OFF :
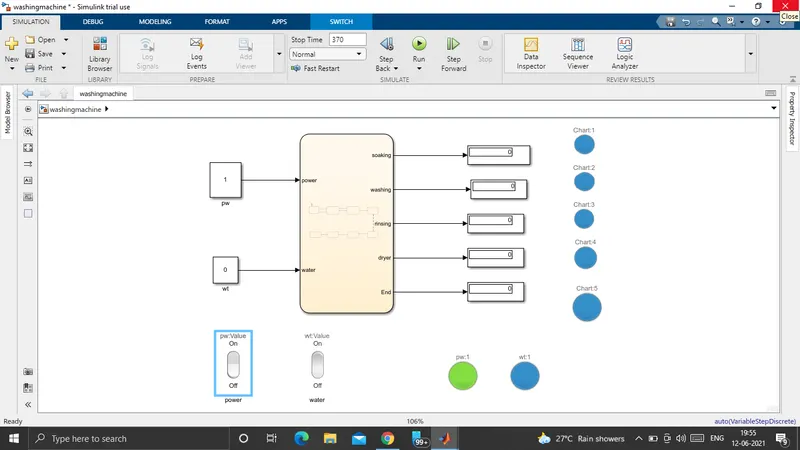
CASE 2 : POWER ON AND WATER SUPPLY OFF :
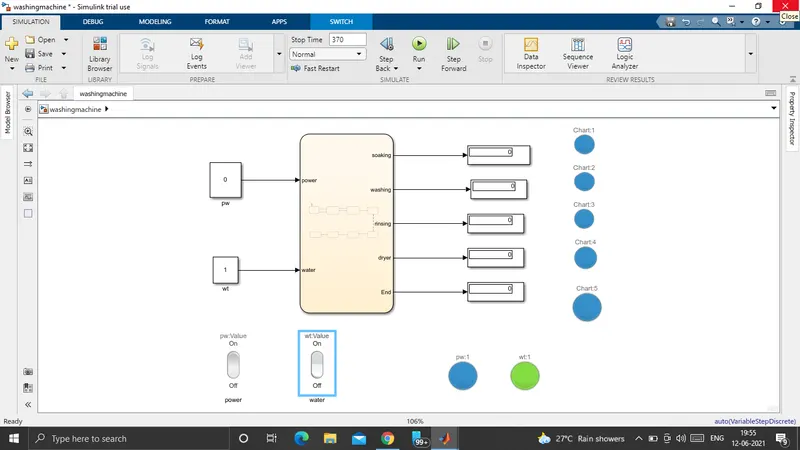
CASE 3 : POWER OFF AND WATER SUPPLY ON :
CASE 4 : POWER ON AND WATER SUPPLY ON, SOAKING COMPLETED :
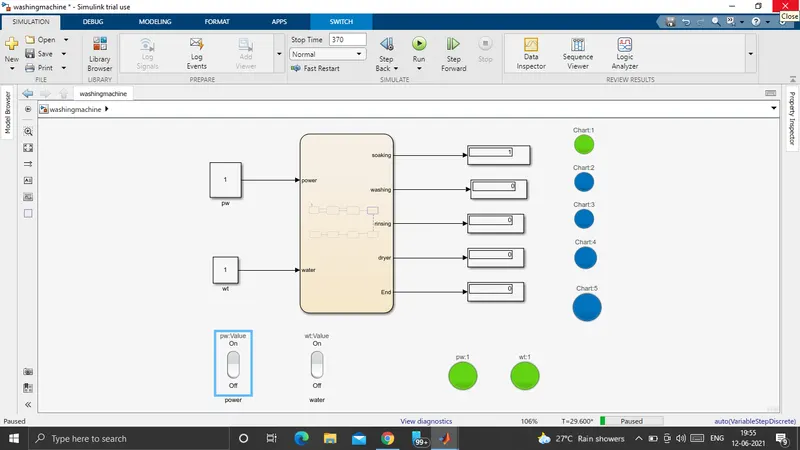
CASE 5 : WASHING COMPLETED :
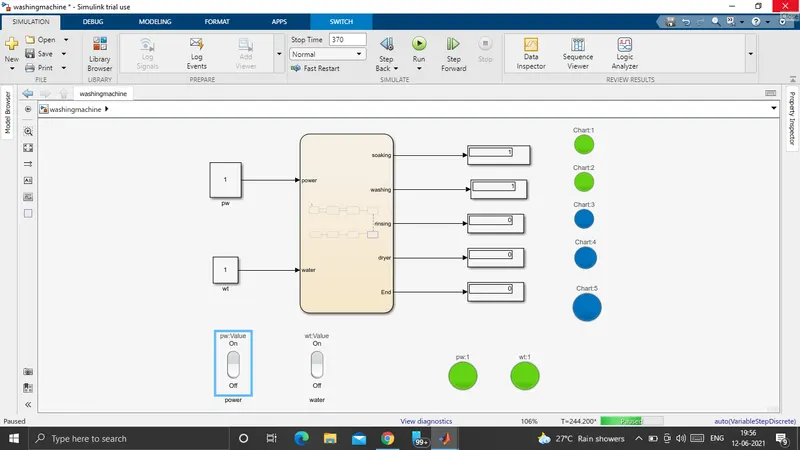
CASE 6 : RINSING COMPLETED :
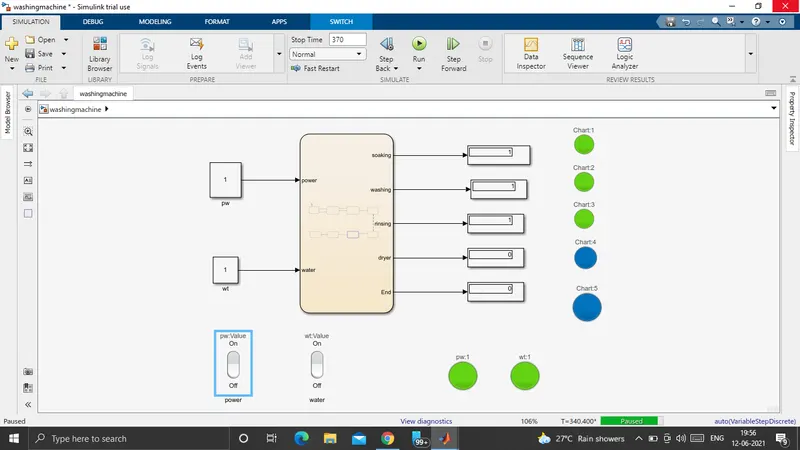
CASE 7 : DRYER COMPLETED :
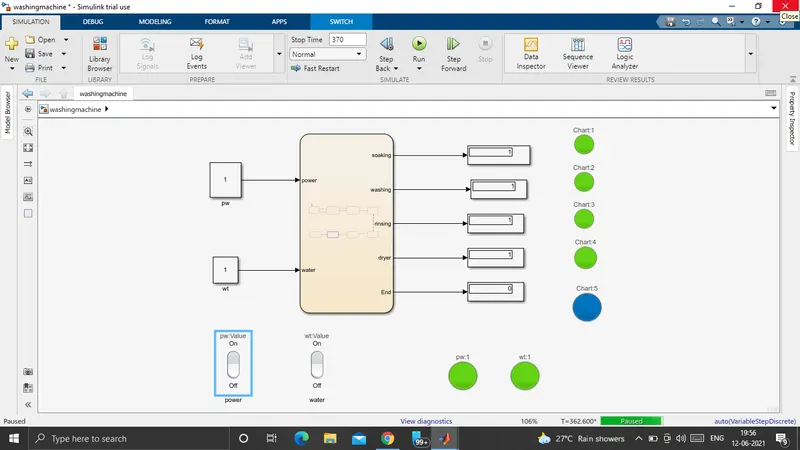
All process are completed than its to be end.
RESULT : I have implemented control logic of a washing machine using state flow as per given sequence.
(2) AIM : To make a simulink for the gear shift logic as per given conditions.
INTRODUCTION :
CONTROL LOGIC : It is model system logic using state machine, Flow chart and truth tables
EXAMPLE FOR CONTROL LOGIC : Washing machine using stateflow. State flow is a simulink tool to implement the state machine. Here model system logic of a washing machine using state flow has been done.
So the state machine and the state transition can help us to makee a chart in a matlab simulink state flow environment
BLOCKS USED :
CONSTANT BLOCK, SLIDER, SLIDER SWITCH, CIRCULAR GUAGE, DISPLAY, LAMP
PROCEDURE :
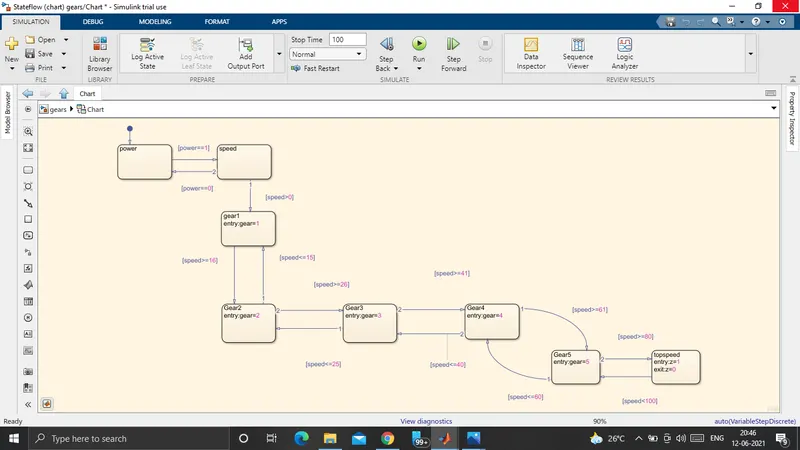
To create a simulink model of gear shift create a state flow chart and start with power block which is connected to the break point and a junction with power==0 condition and connected to the speed block set power==1 so when the speed is above 1 the process is start flowing to gears.
So according to condition the gears are changing with respect to speeds.
Gear 1 up to 15
Gear 2 up to 25
Gear 3 up to 40
Gear 4 up to 60
Gear 5 above 61
Top speed alert is shown in indicator lamp.
Below the chart is there for gear shift :
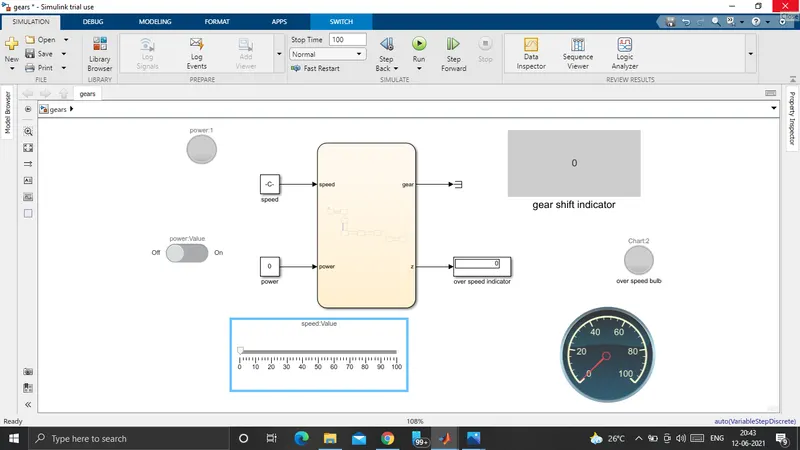
POWER OFF :
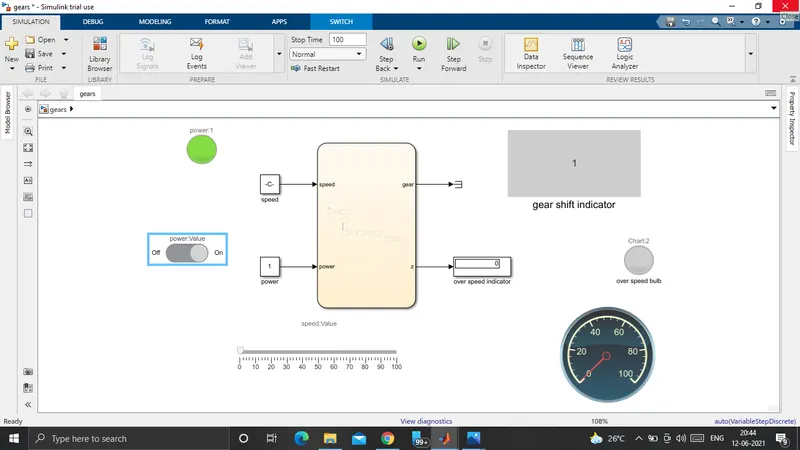
POWER ON :
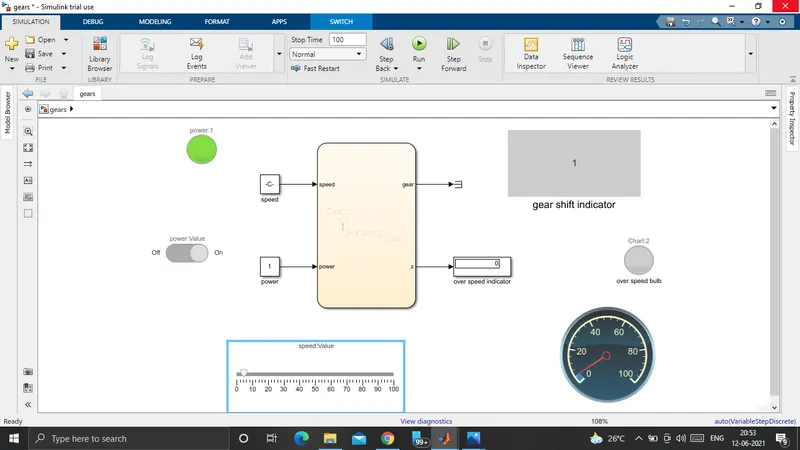
GEAR 1 :
GEAR 2 :
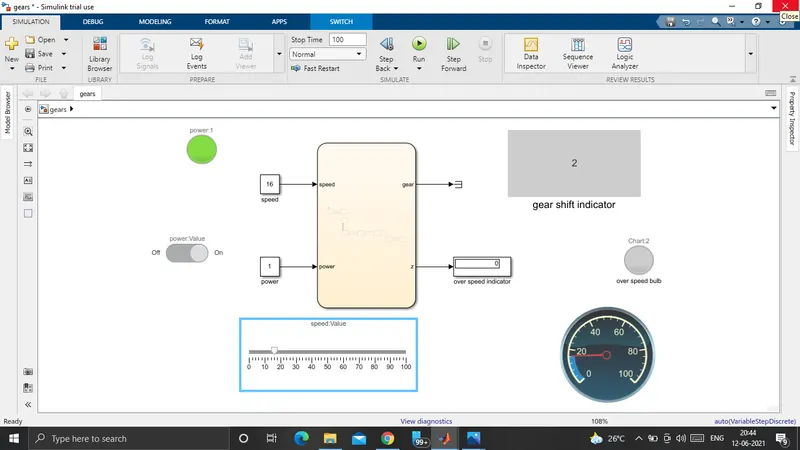
GEAR 3 :
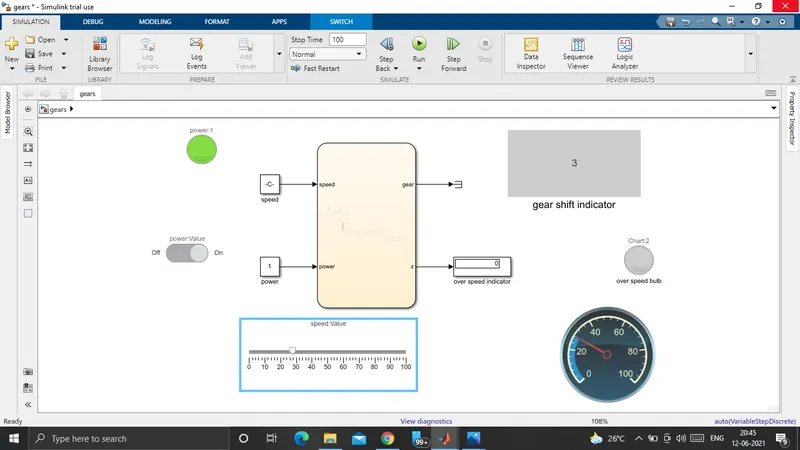
GEAR 4 :
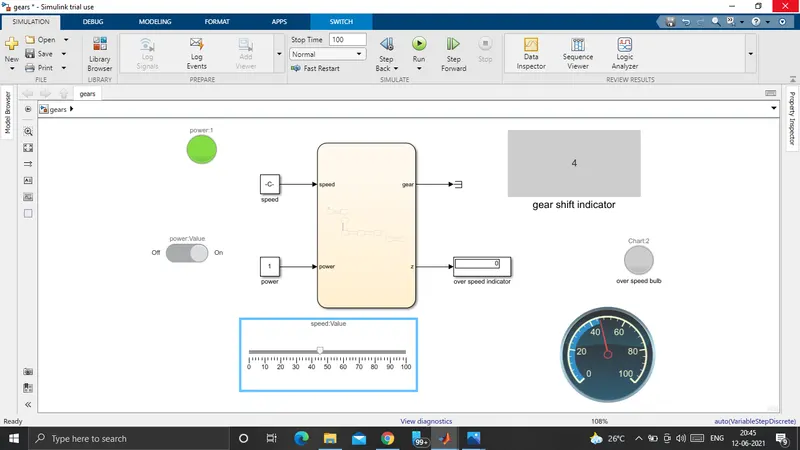
GEAR 5 :
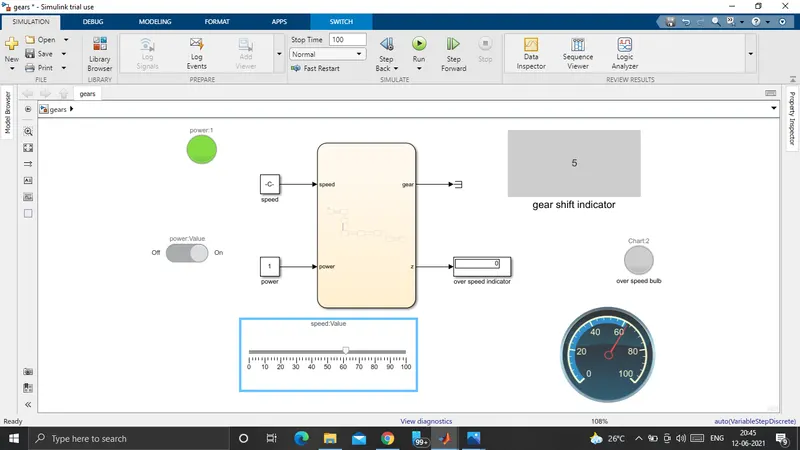
RESULT : The given gear shift is done by using the control logic as per given conditions.