Project 1 - Parsing NASA thermodynamic data
AIM : To extract the 14 coefficients and calculate the enthalpy, entropy and specific heat for all the species in the data file by using the given formula.
INTRODUCTION :
FILE PARSING : File parsing refers to how information can fread from particular text file or any type of file and how that information can be used in matlab program.
If we know file parsing than we can able to read data from external file or external data bases and we can include that data in calculation.
So when people talk about big data processing there is usually interface between the program and large amount of data either the data is stored in a file or it comes from a server, Whatever it is ability to read a file, Take the data from it and ability to store useful information in files is very important.
By file parsing we can do much more we can read nasa thermodynamic data file, It contains coefficients for polynomials there are used to calculate the thermodynamic properties like specific heat, enthalpy, entropies.
so in this program we are going to calculate those properties by using the given thermodynamic data file and given formulas.
we have to read these data file line by line and than we have to calculate coefficients for a particular species.
Based on the coefficients, We can use the formulas in it.
FORMULAS :

The above formulas are used to calculate the specific heat, enthalpy and entropy.
Where T = temperature
R = gas constant = 8.314
a1-a7 = high temperature coefficient
a8-a14 = low temperature coefficient
MATLAB PROGRAM :
clear all
close all
clc

%getting the data file
f1=fopen('THERMO.dat','r');
fgetl(f1)
%reading the header information
A=fgetl(f1);
A=strsplit(A,' ');
global_low_temp=str2num(A{2});
global_mid_temp=str2num(A{3});
global_high_temp=str2num(A{4});

%skipping next three lines
for i=1:3
    fgetl(f1);
end

%reading the species
for i=1:53
 header=fgetl(f1);
 x=strsplit(header,' ');

    species_name=(x{1});
    z=length(x);

    local_low_temp=str2double(x{z-3});
        local_high_temp=str2double(x{z-2});
            local_mid_temp=str2double(x{z-1});

            t1=local_low_temp;
            t2=local_mid_temp;
            t3=local_high_temp;

            %getting first line coeffecients (a1-a5)
            line_1=fgetl(f1);

            a=strfind(line_1,'E');
            a1=str2double(line_1(1:a(1)+3));
            a2=str2double(line_1(a(1)+4:a(2)+3));
            a3=str2double(line_1(a(2)+4:a(3)+3));
            a4=str2double(line_1(a(3)+4:a(4)+3));
            a5=str2double(line_1(a(4)+4:a(5)+3));

            %getting second line coeffeceints (a6-a10)
             line_2=fgetl(f1);

            a_1=strfind(line_2,'E');
            a6=str2num(line_2(1:a_1(1)+3));
            a7=str2double(line_2(a_1(1)+4:a_1(2)+3));
            a8=str2double(line_2(a_1(2)+4:a_1(3)+3));
            a9=str2double(line_2(a_1(3)+4:a_1(4)+3));
            a10=str2double(line_2(a_1(4)+4:a_1(5)+3));

            %getting third line coeffeceints (a10-a14)
             line_3=fgetl(f1);

            a_2=strfind(line_1,'E');
            a11=str2double(line_3(1:a_2(1)+3));
            a12=str2double(line_3(a_2(1)+4:a_1(2)+3));
            a13=str2double(line_3(a_2(2)+4:a_1(3)+3));
            a14=str2double(line_3(a_2(3)+4:a_1(4)+3));


            %creating folder
            mkdir(['C:\Users\rahul\Downloads\file parsing\',species_name]);

            T=linspace(t1,t3,1000);
            R=8.314;
            % to get array of specific heat, enthalpy and entropy
            for k=1:length(T)
    % to compare the species  temperature to assign the coeffeceints
    %a1-a7 (high temperature coeffeceints), a8-a14(low temperature coeffecients)
    if T(k)>t2

        %high temperature coeffeceints.

        cp=(a1+a2.*T+a3.*T.^2+a4.*T.^3+a5.*T.^4)*R;

        H=(a1+(a2.*T)/2+(a3.*T.^2)/3+(a4.*T.^3)/4+(a5.*T.^4)/5+(a6./T))*R.*T;

        S=a1.*log(T)+a2.*T+(a3.*T.^2)/2+(a4.*T.^3)/3+(a5.*T.^4)/4+a7;

    else
        %low temperature coeffecients

        cp=(a8+a9.*T+a10.*T.^2+a11.*T.^3+a12.*T.^4)*R;

        H=(a8+(a9.*T)/2+(a10.*T.^2)/3+(a11.*T.^3)/4+(a12.*T.^4)/5+(a13./T))*R.*T;

        S=a8.*log(T)+a9.*T+(a10.*T.^2)/2+(a11.*T.^3)/3+(a12.*T.^4)/4+a14;
    end
    end


            %plotting the graphs

            figure(1);
            plot(T,cp);
            hold on
            grid on ;
            title(species_name);
            xlabel('Temperature');
            ylabel('Specific Heat');


            figure(2);
            plot(T,H);
            hold on
            grid on ;
            title(species_name);
            xlabel('Temperature');
            ylabel('Enthalpy');


            figure(3);
            plot(T,S);
            hold on
            grid on ;
            title(species_name);
            xlabel('Temperature');
            ylabel('Entropy');


            %changing the directory and saving the file
            cd(['C:\Users\rahul\Downloads\file parsing\',species_name]);
clear all
close all
clc

%getting the data file
f1=fopen('THERMO.dat','r');
fgetl(f1)
%reading the header information
A=fgetl(f1);
A=strsplit(A,' ');
global_low_temp=str2num(A{2});
global_mid_temp=str2num(A{3});
global_high_temp=str2num(A{4});

%skipping next three lines
for i=1:3
    fgetl(f1);
end

%reading the species
for i=1:53

    header=fgetl(f1);
    x=strsplit(header,' ');

    species_name=(x{1});
    z=length(x);

    local_low_temp=str2double(x{z-3});
        local_high_temp=str2double(x{z-2});
            local_mid_temp=str2double(x{z-1});

            t1=local_low_temp;
            t2=local_mid_temp;
            t3=local_high_temp;

            %getting first line coeffecients (a1-a5)
            line_1=fgetl(f1);

            a=strfind(line_1,'E');
            a1=str2double(line_1(1:a(1)+3));
            a2=str2double(line_1(a(1)+4:a(2)+3));
            a3=str2double(line_1(a(2)+4:a(3)+3));
            a4=str2double(line_1(a(3)+4:a(4)+3));
            a5=str2double(line_1(a(4)+4:a(5)+3));

            %getting second line coeffeceints (a6-a10)
             line_2=fgetl(f1);

            a_1=strfind(line_2,'E');
            a6=str2num(line_2(1:a_1(1)+3));
            a7=str2double(line_2(a_1(1)+4:a_1(2)+3));
            a8=str2double(line_2(a_1(2)+4:a_1(3)+3));
            a9=str2double(line_2(a_1(3)+4:a_1(4)+3));
            a10=str2double(line_2(a_1(4)+4:a_1(5)+3));

            %getting third line coeffeceints (a10-a14)
             line_3=fgetl(f1);

            a_2=strfind(line_1,'E');
            a11=str2double(line_3(1:a_2(1)+3));
            a12=str2double(line_3(a_2(1)+4:a_1(2)+3));
            a13=str2double(line_3(a_2(2)+4:a_1(3)+3));
            a14=str2double(line_3(a_2(3)+4:a_1(4)+3));


            %creating folder


            T=linspace(t1,t3,1000);
            R=8.314;
            % to get array of specific heat, enthalpy and entropy
            for k=1:length(T)
    % to compare the species  temperature to assign the coeffeceints
    %a1-a7 (high temperature coeffeceints), a8-a14(low temperature coeffecients)
    if T(k)>t2

        %high temperature coeffeceints.

        cp=(a1+a2.*T+a3.*T.^2+a4.*T.^3+a5.*T.^4)*R;

        H=(a1+(a2.*T)/2+(a3.*T.^2)/3+(a4.*T.^3)/4+(a5.*T.^4)/5+(a6./T))*R.*T;

        S=a1.*log(T)+a2.*T+(a3.*T.^2)/2+(a4.*T.^3)/3+(a5.*T.^4)/4+a7;

    else
        %low temperature coeffecients

        cp=(a8+a9.*T+a10.*T.^2+a11.*T.^3+a12.*T.^4)*R;

        H=(a8+(a9.*T)/2+(a10.*T.^2)/3+(a11.*T.^3)/4+(a12.*T.^4)/5+(a13./T))*R.*T;

        S=a8.*log(T)+a9.*T+(a10.*T.^2)/2+(a11.*T.^3)/3+(a12.*T.^4)/4+a14;
    end
    end


            %plotting the graphs

            figure(1);
            plot(T,cp);
            grid on ;
            title(species_name);
            xlabel('Temperature');
            ylabel('Specific Heat');


            figure(2);
            plot(T,H);
            grid on ;
            title(species_name);
            xlabel('Temperature');
            ylabel('Enthalpy');


            figure(3);
            plot(T,S);
            grid on ;
            title(species_name);
            xlabel('Temperature');
            ylabel('Entropy');


            %changing the directory and saving the file
            cd(['C:\Users\rahul\Downloads\file parsing\',species_name]);

            saveas(1,'specific heat','jpg');
            saveas(2,'enthalpy','jpg');
            saveas(3,'entropy','jpg');


             %molecular_masscalculation


elements=['H','C','O','N','A'];
atomic_weight=[1.0079 12.0107 15.999 14.0067 39.948];
mol_mass=0;
for l=1:length(species_name)
    for m=1:length(atomic_weight)
        if strcmp(species_name(l),elements(m))
            mol_mass=mol_mass+atomic_weight(m);
            position=m;
        end
    end

n=str2double(species_name(l));
if n>1
    mol_mass=mol_mass+atomic_weight(position)*(n-1);

end
end
sprintf('Molecular Weight of %s:%f u',species_name,mol_mass)


end
             fclose(f1)

            saveas(1,'specific heat','jpg');
            saveas(2,'enthalpy','jpg');
            saveas(3,'entropy','jpg');


             %molecular_masscalculation


elements=['H','C','O','N','A'];
atomic_weight=[1.0079 12.0107 15.999 14.0067 39.948];
mol_mass=0;
for l=1:length(species_name)
    for m=1:length(atomic_weight)
        if strcmp(species_name(l),elements(m))
            mol_mass=mol_mass+atomic_weight(m);
            position=m;
        end
    end

n=str2double(species_name(l));
if n>1
    mol_mass=mol_mass+atomic_weight(position)*(n-1);

end
end
sprintf('Molecular Weight of %s:%f u',species_name,mol_mass)


end
             fclose(f1)
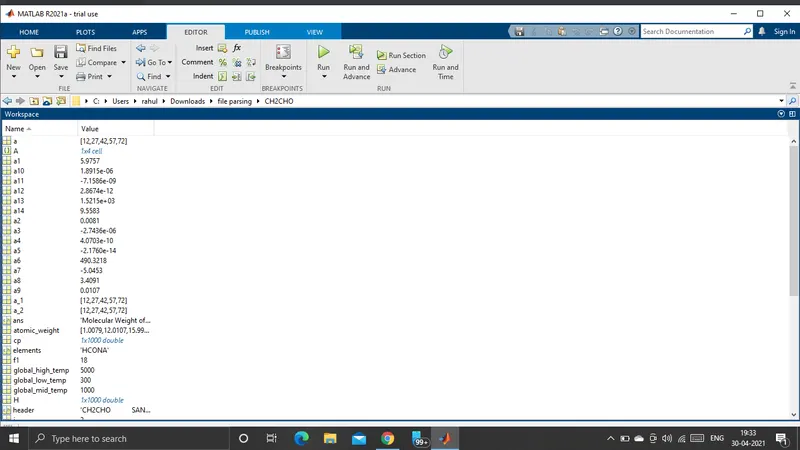
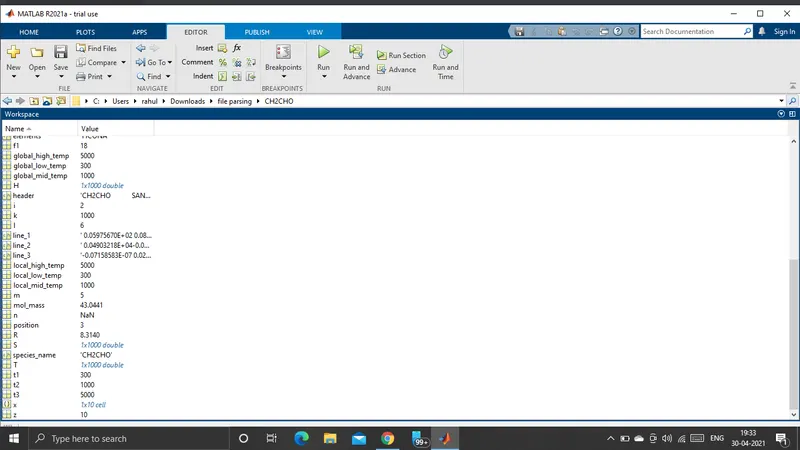
OUTPUT :
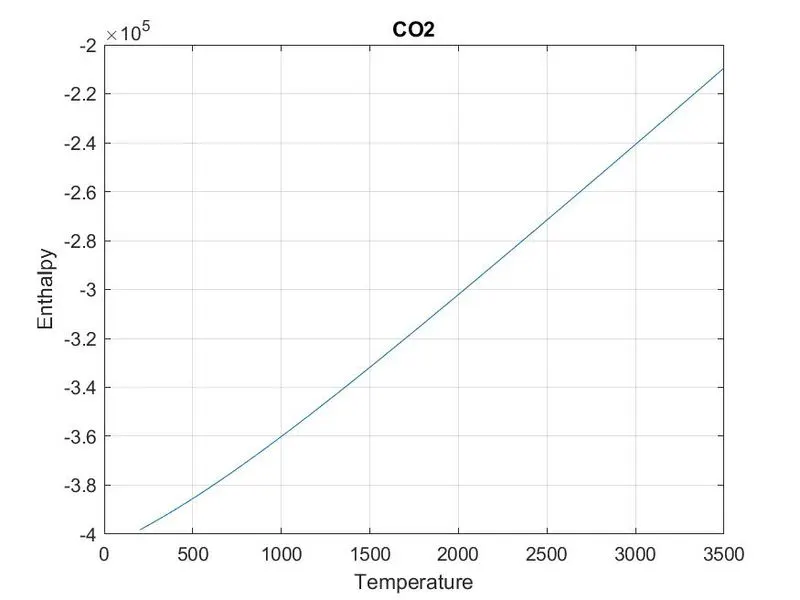
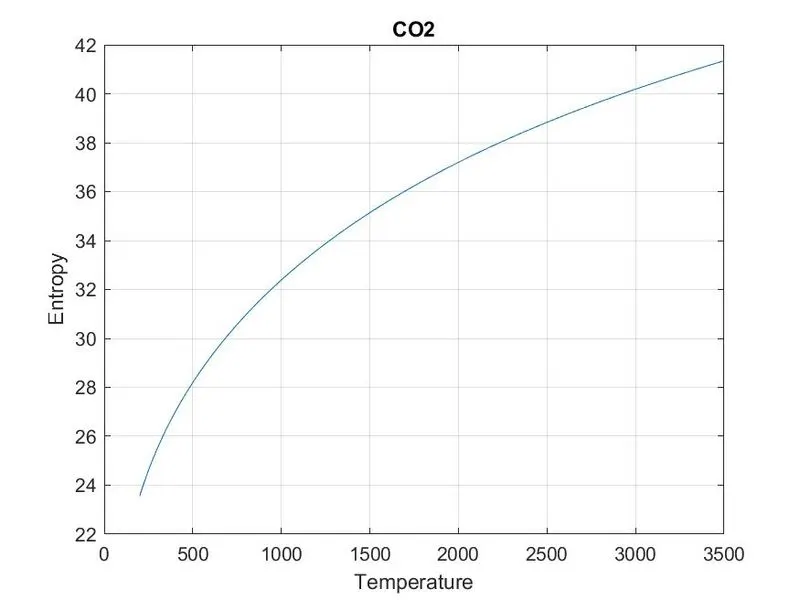
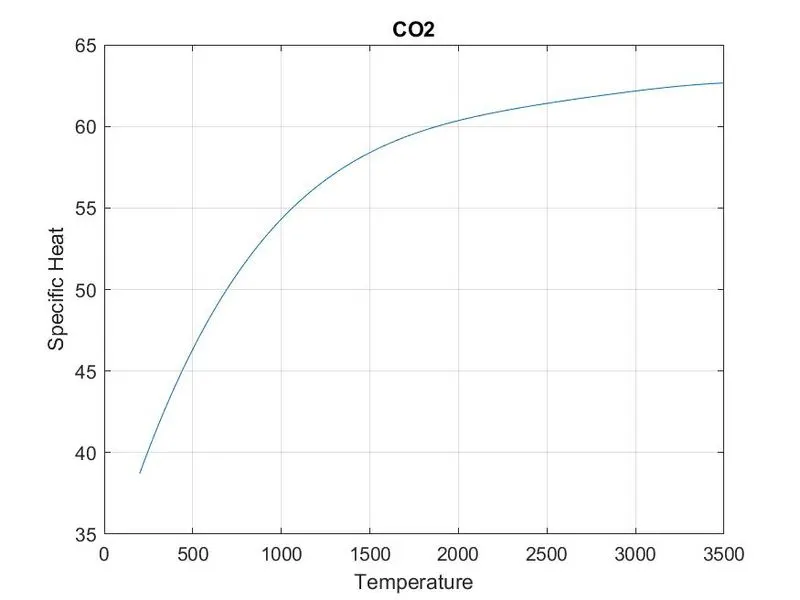
PLOT FOR CO2 :
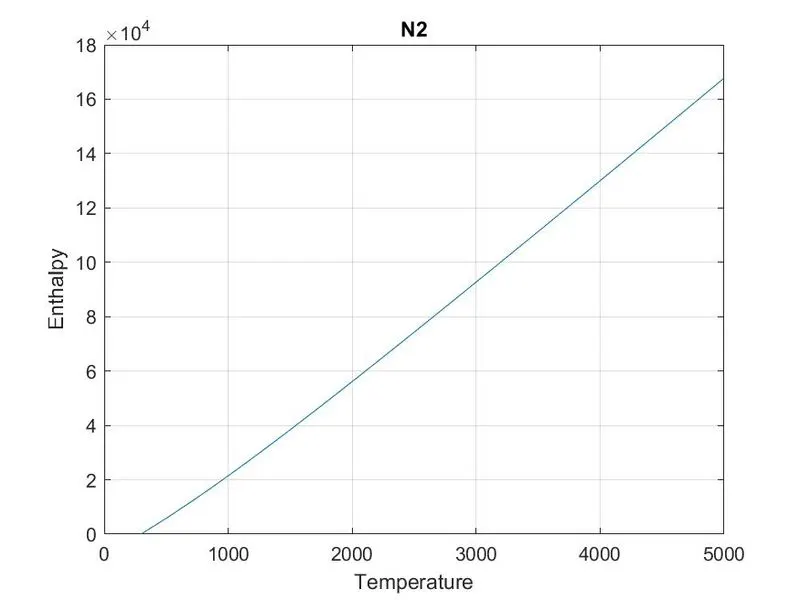
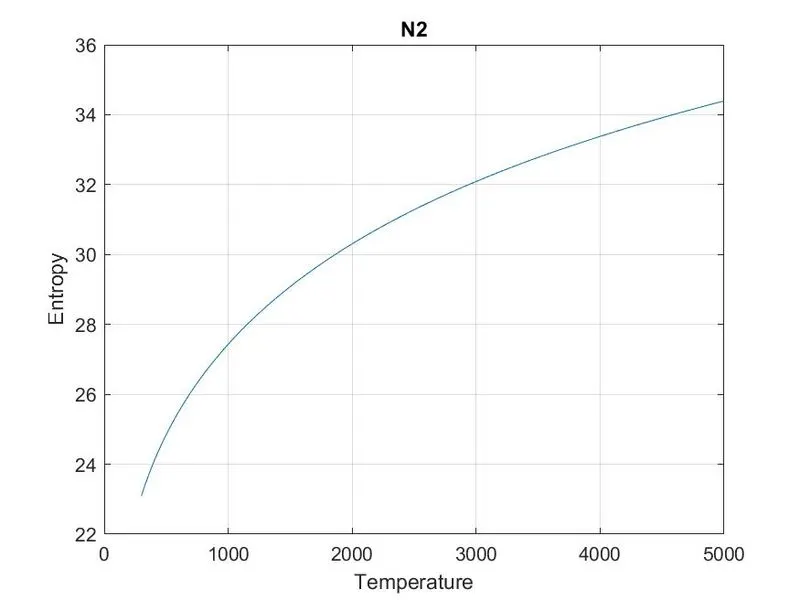
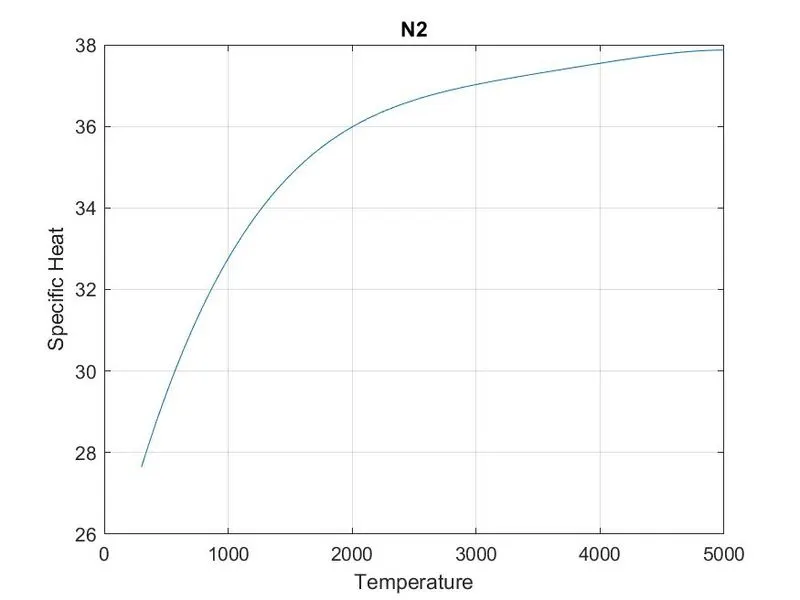
PLOT FOR N2 :
PLOT FOR O2 :
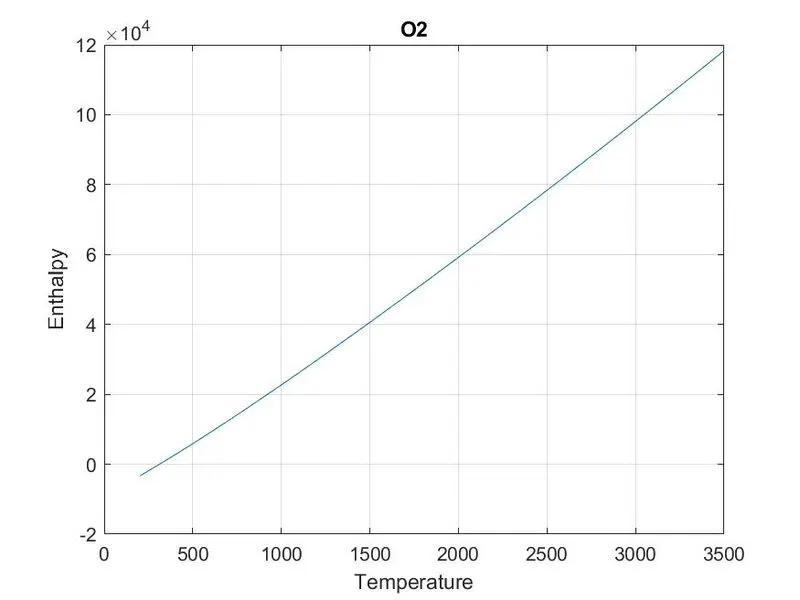
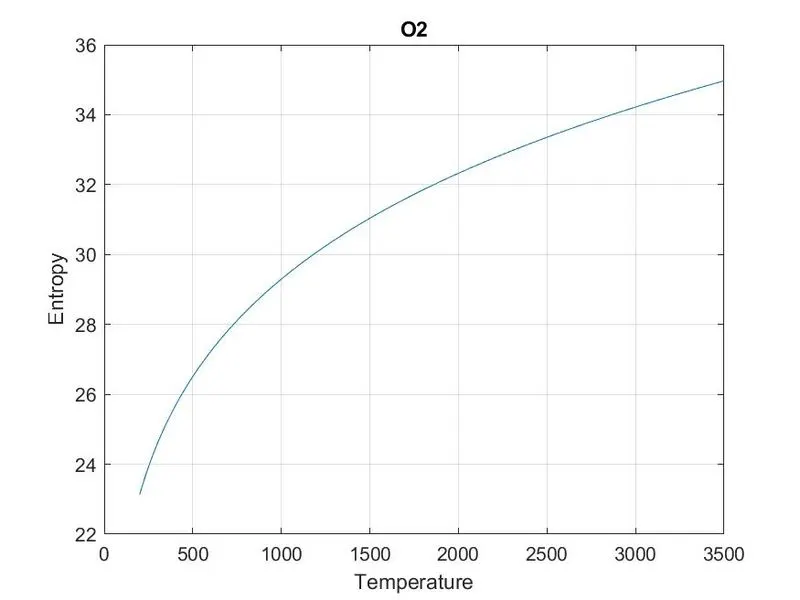
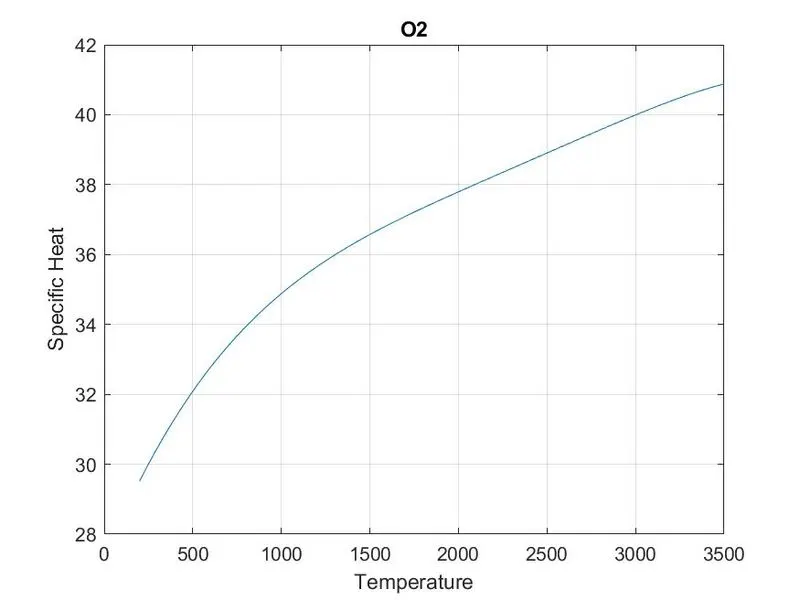
ERRORS : In this program i find major errors while executing the whole program not a single error but huge errors so i not made any screenshots because these type of errors i found in before challanges also.
OVERCOME OF ERRORS : We can overcome those errors by making more practice on program and understanding the concept and correct execution of formulas. even a single mistake creates more trouble for output so each and every step is important while execution.
CONCLUSION :
In this matlab program i extracted the 14 coefficients and calculated the enthalpy, entropy and specific heat for all the species in the data file by using the given formula.