Week 4.2: Project - Transient simulation of flow over a throttle body
Title: Unsteady-state simluation of a flow over throttle body.
Aim:
To post process the results and show pressure and velocity contours.
To show the mesh (i.e surface with edges)
To show the plots for pressure, velocity, mass flow rate and total cell count.
To show variation of Mesh updation while throttle valve rotates.
Introduction:
Throttle valve is a type of valve which regulates the supply of working substance (charge) to the engine. The position of the throttle valve directly determines the performance of the engine. Position of throttle valve is controlled by accelerator pedal. Alternately we can say that, throttle valve is an Mechanism by which engines power output can be controlled.
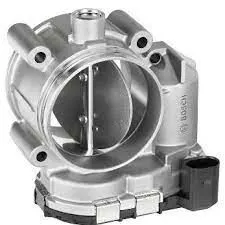
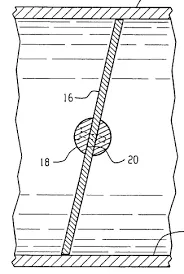
As shown in above diagrams, throttle valve has a circular disc which can rotate to controll the supply of fluid. Position of throttle valve decides the volume flow rte of fluid.
Geometry used for simulation
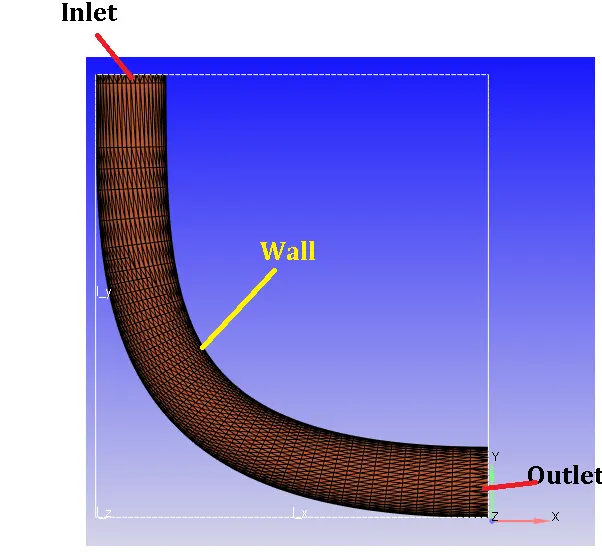
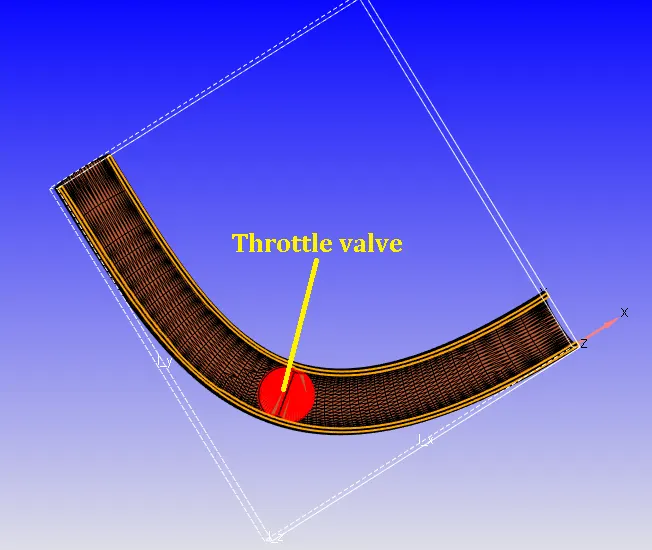
Geometry modifications / Extraction of fluid volume
As can be seen from above figures, elbow has has a thickness. As fas as fluid flow simulation inside the elbow is concerned, there is no need to have thickness. Hence thickness is removed as follows.
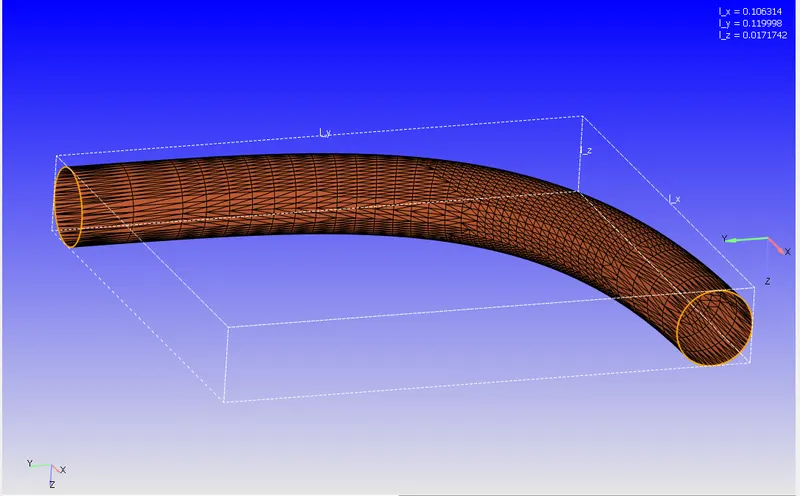
But in above figure there are errors of open edges in geoemetry, as shown below.
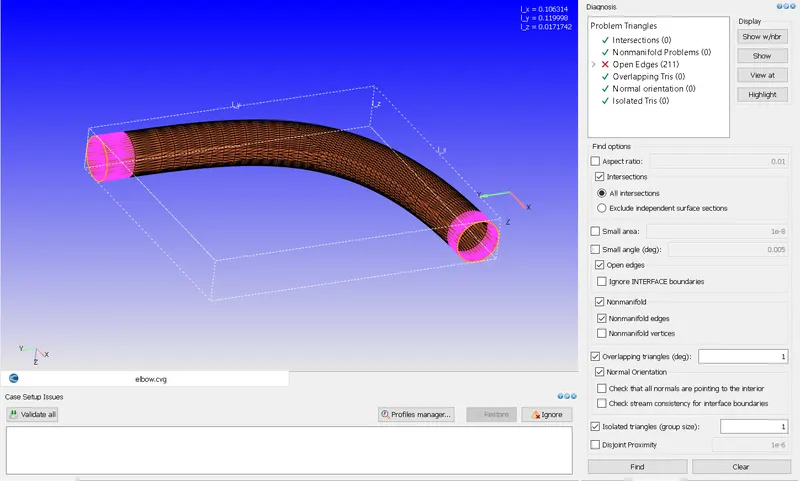
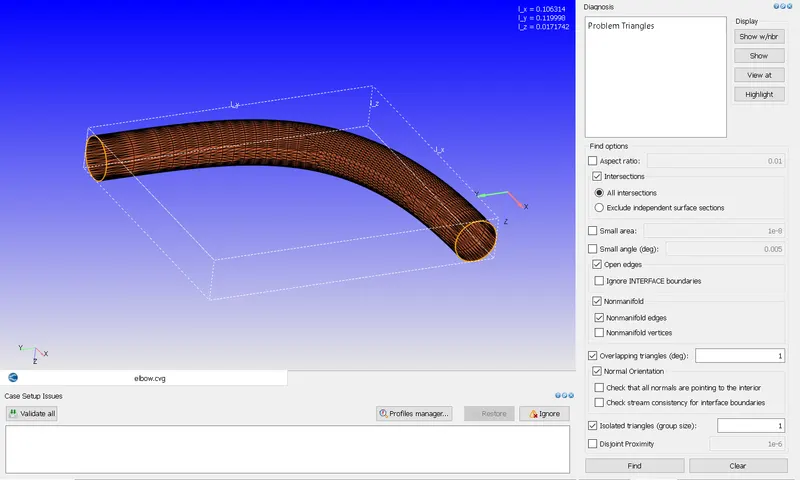
This error can be removed as shown below.
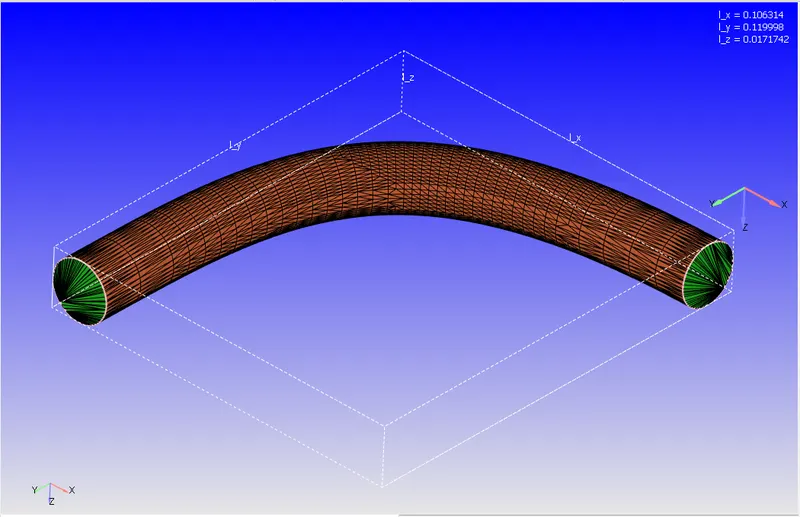
Closing of open edges as shown below.
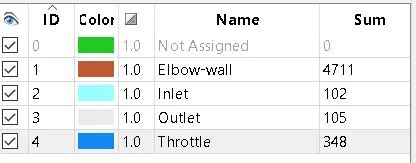
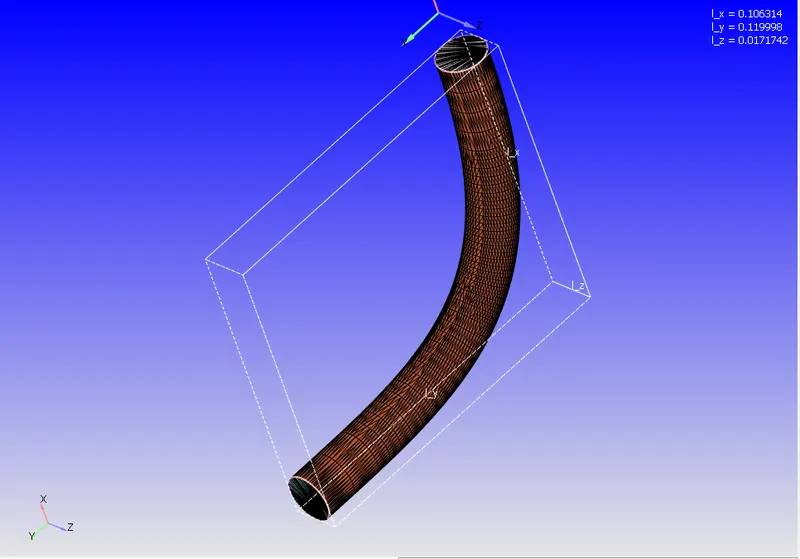
Boundary flagging/Renaming of boundaries
Case setup:
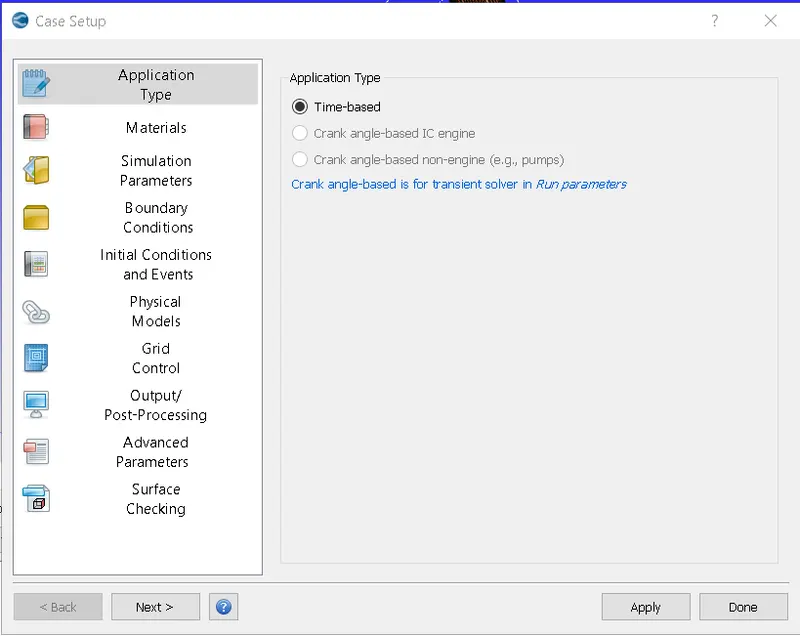
1) Application type
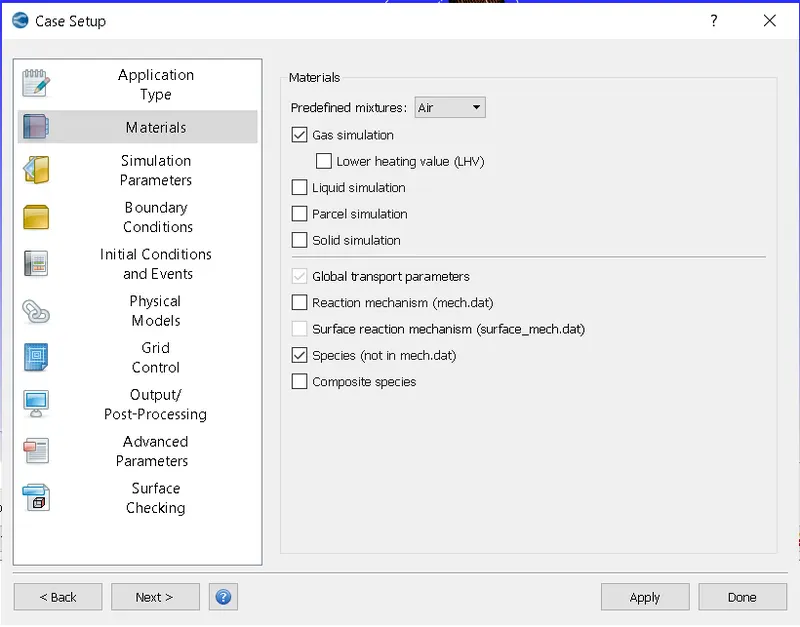
2) Materials
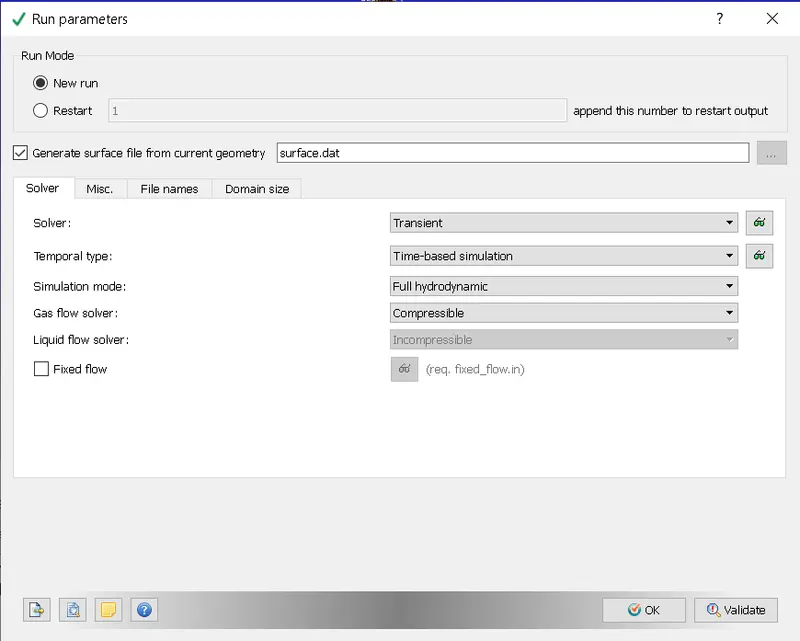
3) Simulation parameters
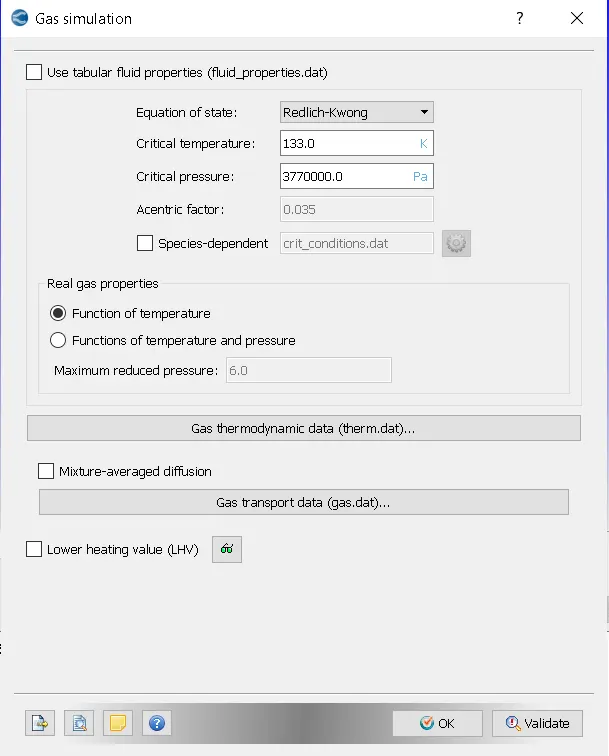
Unsteady-state simulation
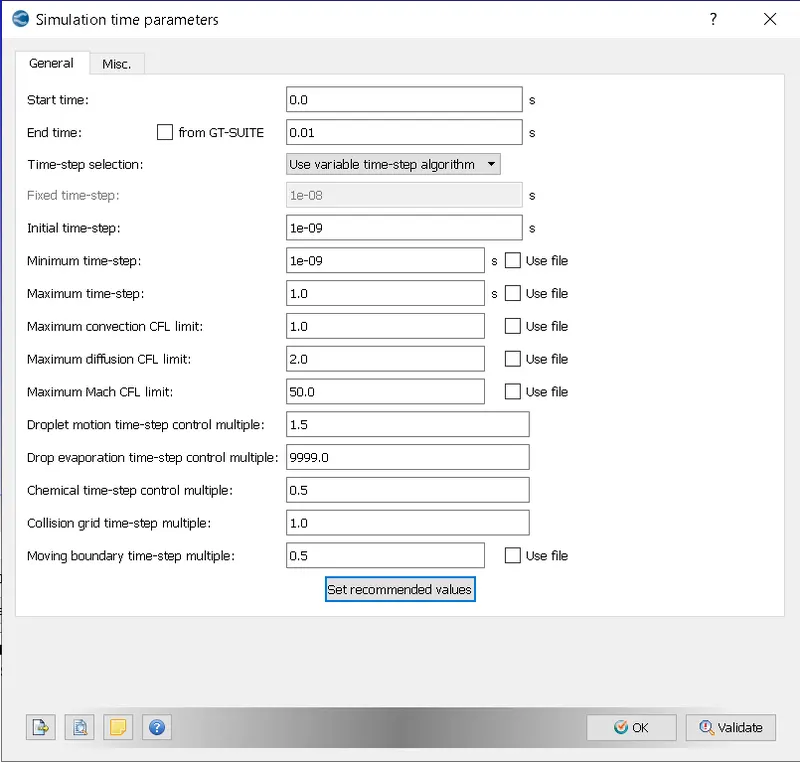
Simulation time calculation
From geometry, length of flow = 0.2 m
Average flow velocity at outlet = 190 m/s
Hence, time T = 0.2/190 = 0.001 sec
If we run simulation for 10 times of it, Simulation time = 10 * 0.001 = 0.01 sec.
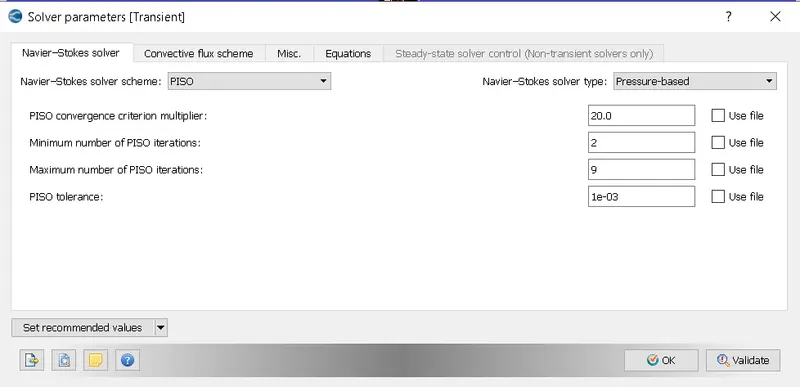
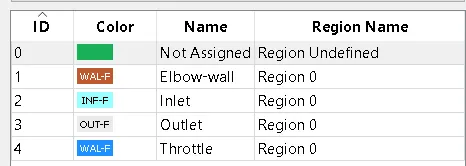
4) Boundary conditions
Outlet: Outflow
Elbow-wall: Wall
Trottle: Wall
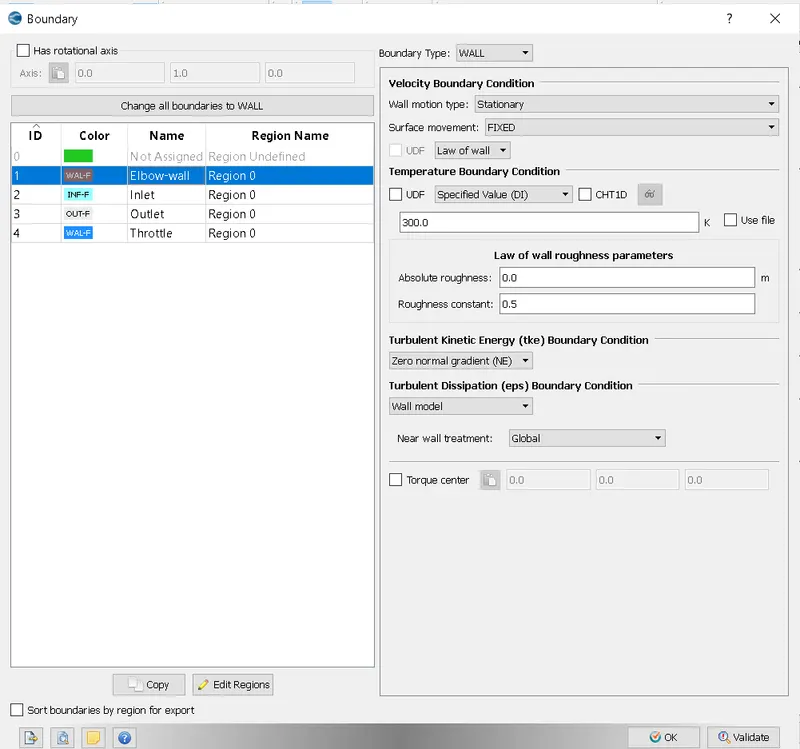
Elbow-wall
Velocity boundary condition, Wall motion type: Stationary, Surface movement: Fixed
Temperature: Specified value (300 K)
Turbulent kinetic energy: Zero normal gradient
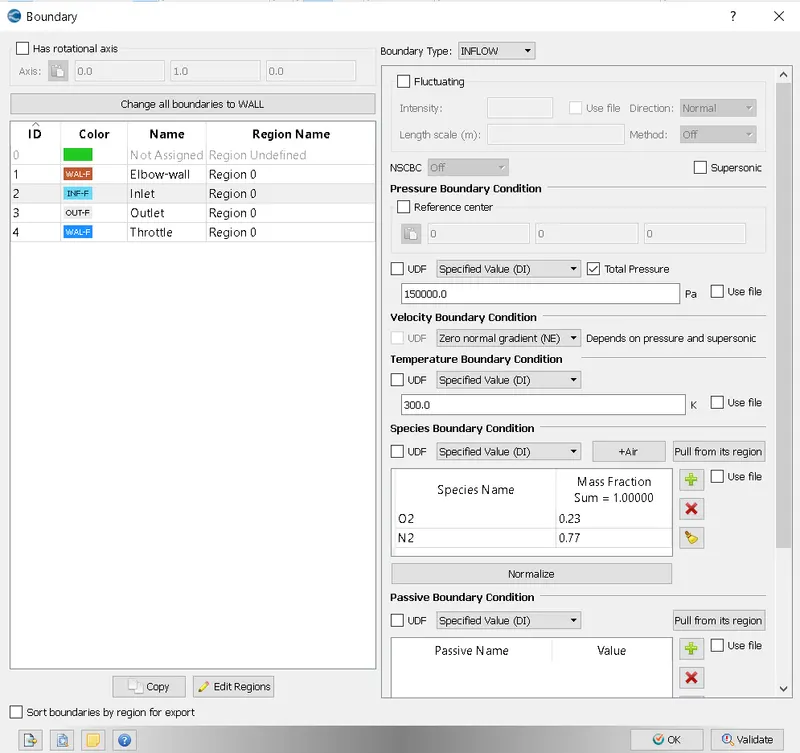
Inlet: Inflow
Temperature: Specified value (300 K)
Pressure boundary condition: Specified value (150000 Pa)
Velocity boundary condition: Zero normal gradient
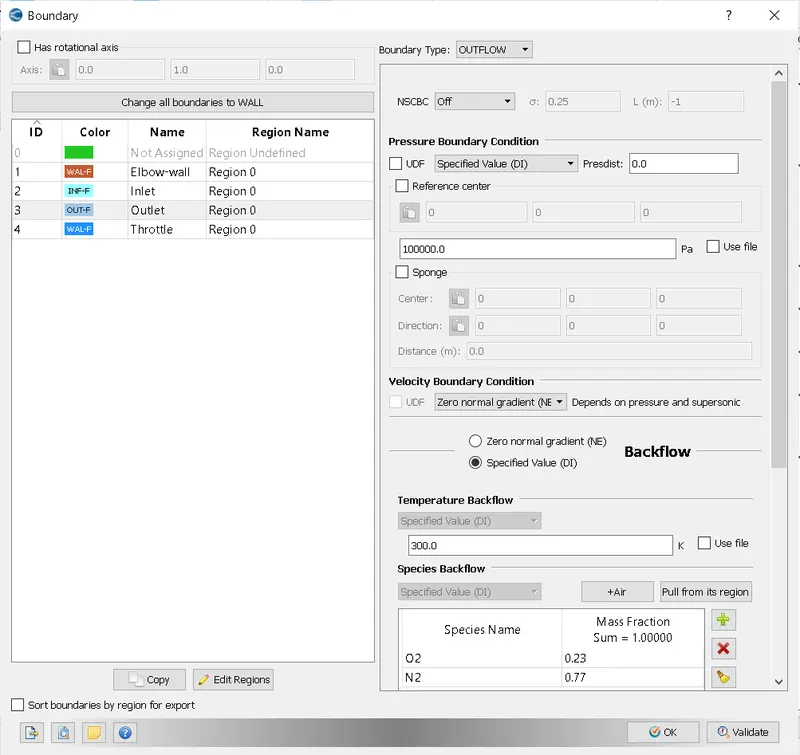
Outlet: Outflow
Temperature: Specified value (300 K)
Pressure boundary condition: Specified value (100000 Pa)
Velocity boundary condition: Zero normal gradient
Throttle: Wall
Velocity boundary condition, Wall motion type: Rotating, Surface movement: Moving
Temperature: Zero normal gradient
Turbulent kinetic energy: Zero normal gradient
Turbulent dissipation boundary condition: Wall model
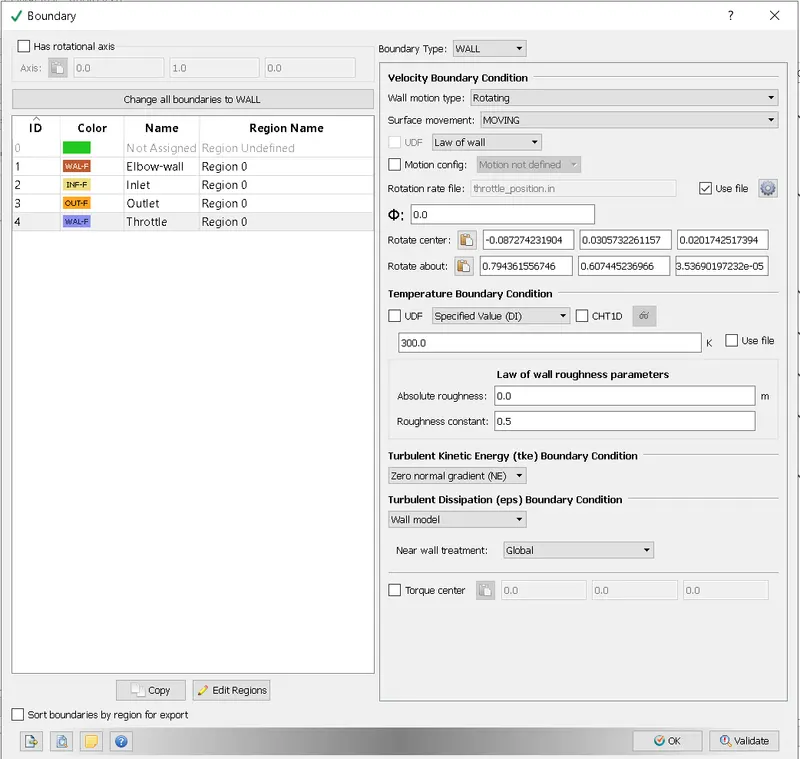
To define rate of rotation of throttle valve
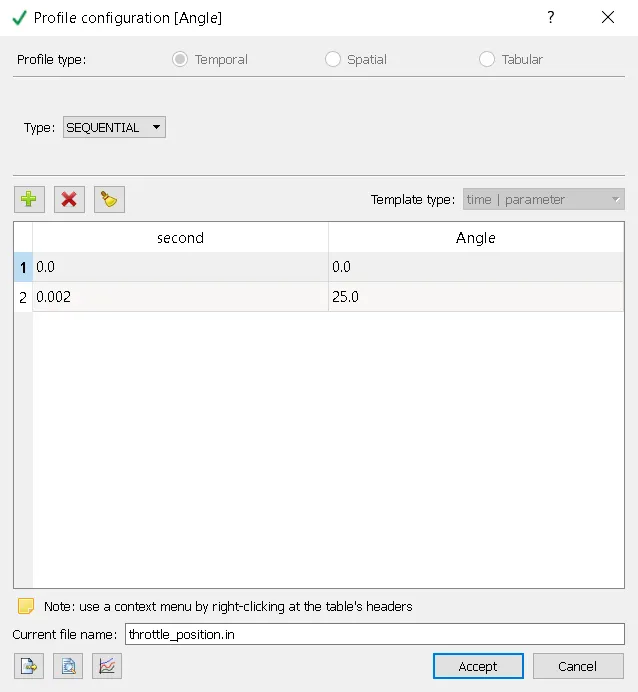
From above, rotation of valve will be as follows,
valve will rotate from 0 degree to 25 degree from 0 ms to 2 ms. For rest time of simulation, valve will be stationanry.
To find rotation center and rotational axis of a throttle valve
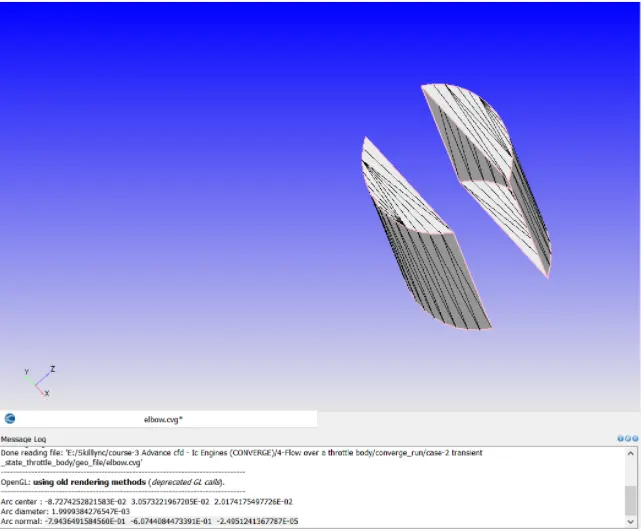
5) Initial conditions and events
Solution is initialised with the temperature of 300 K and pressure of 101325 Pa
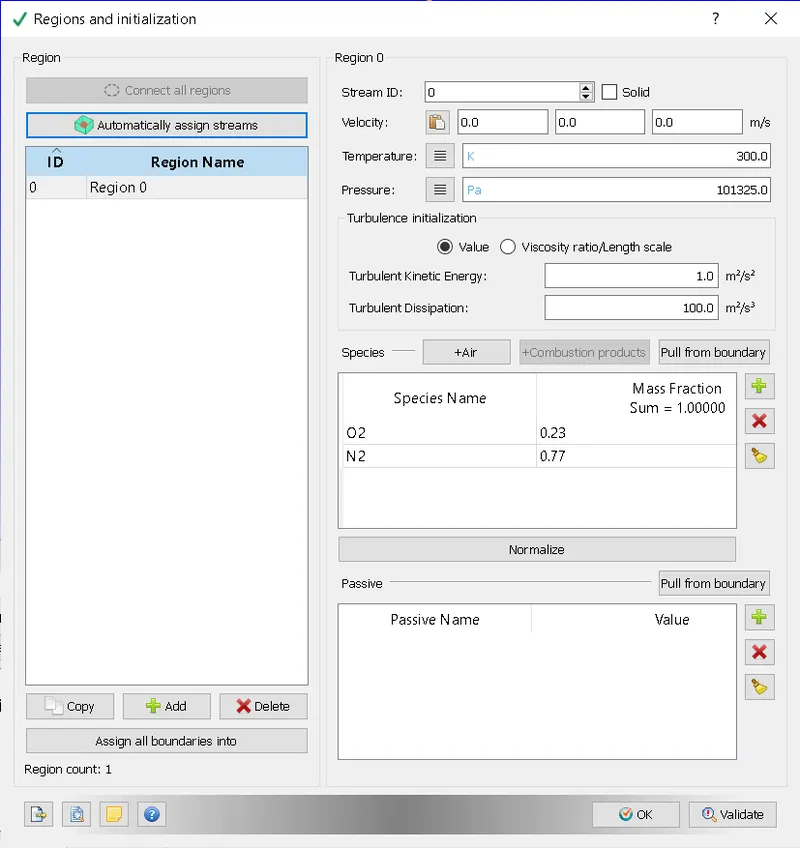
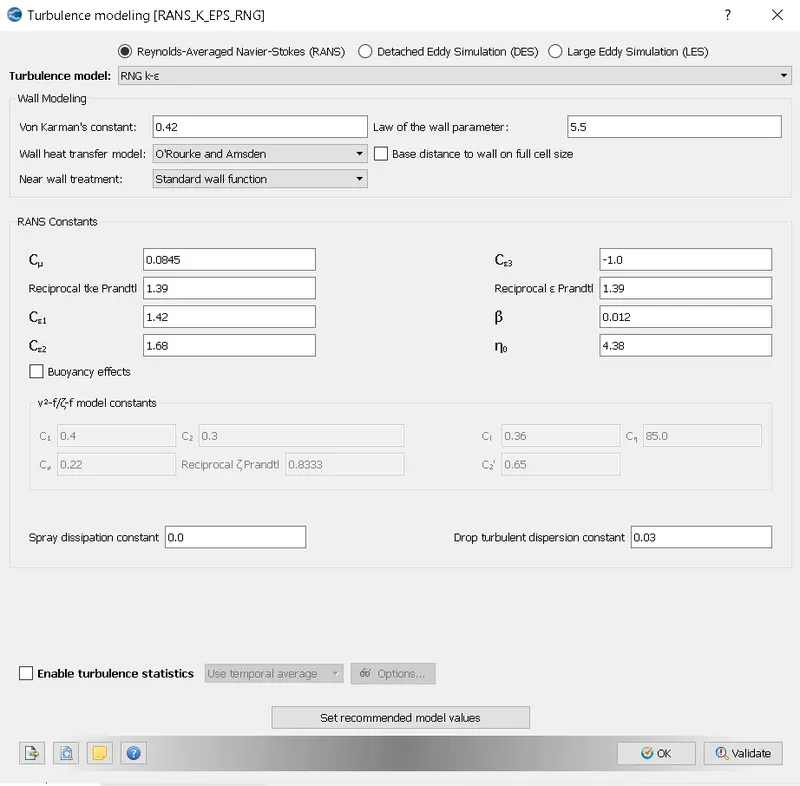
6) Physical models
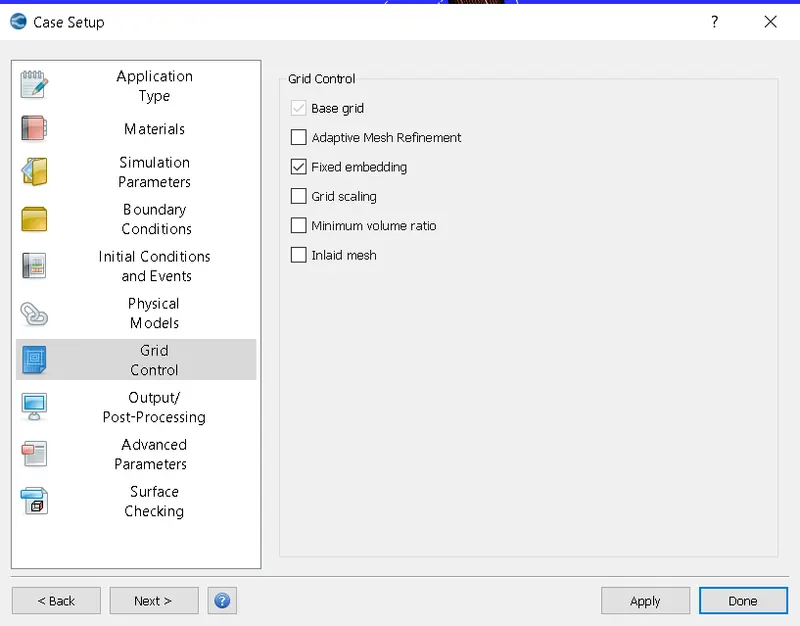
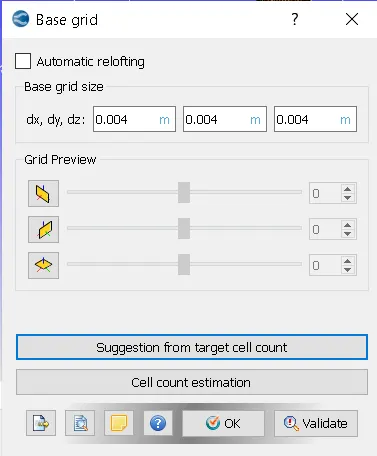
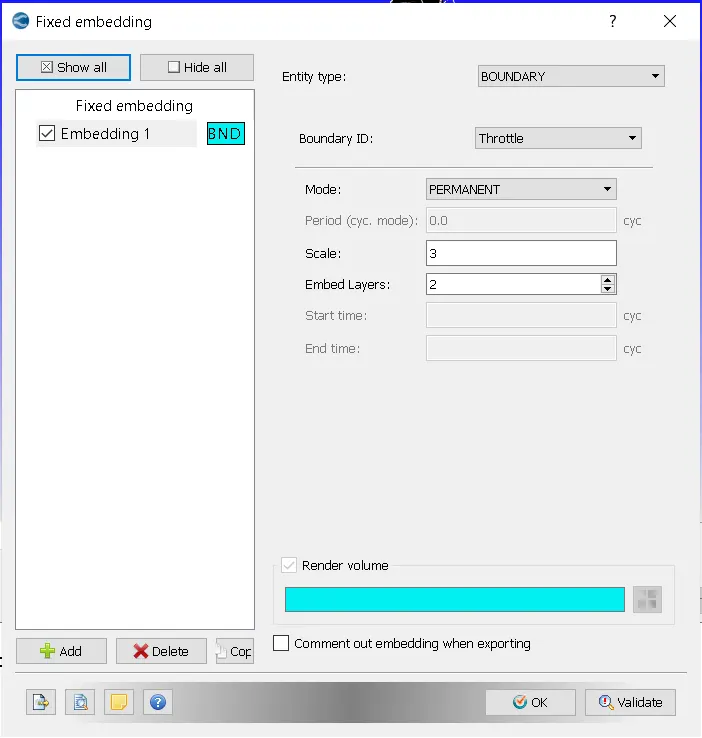
7) Grid controll
Meshing is done with fix emebeding
Results
Initial throttle possition
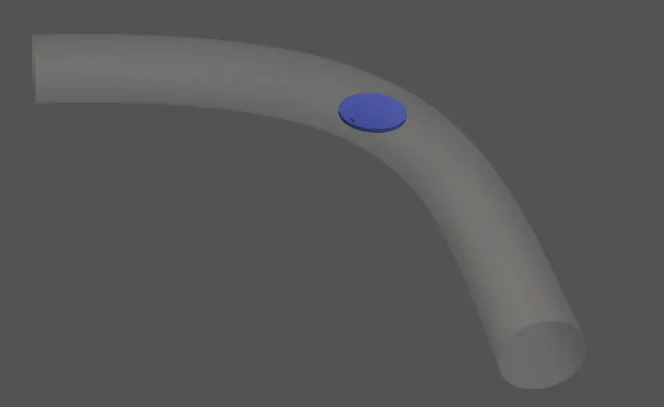
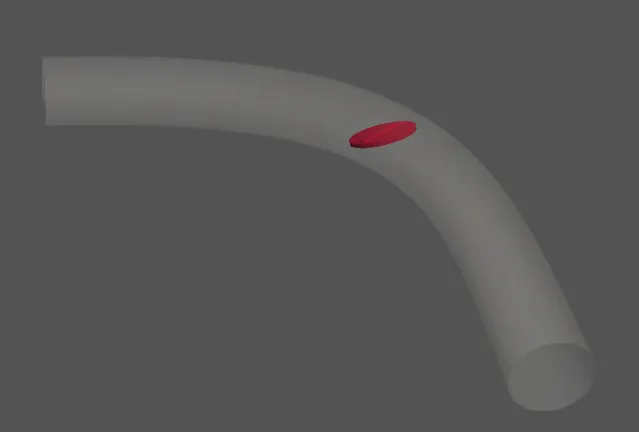
Throttle position after 25 degree rotation
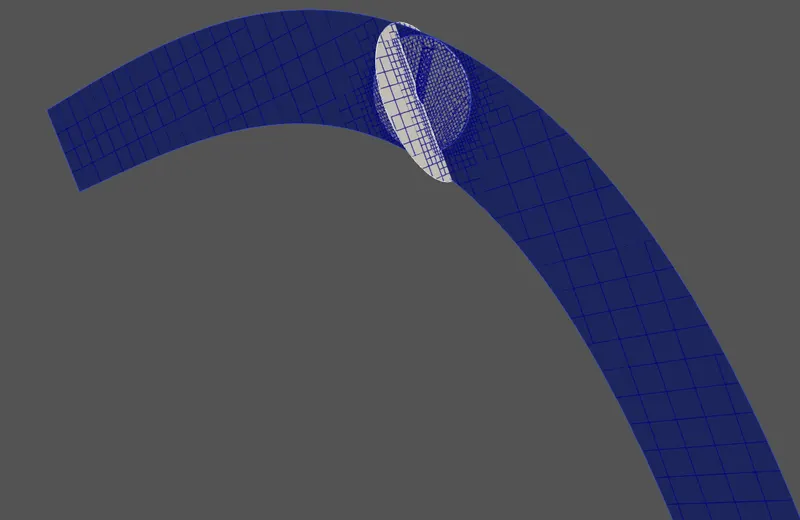
Initial mesh
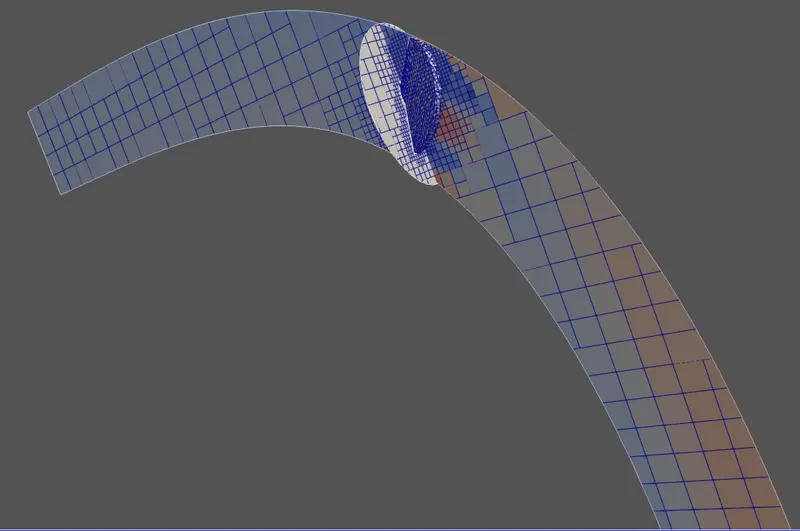
Mesh after 25 degree rotation
Mesh animation
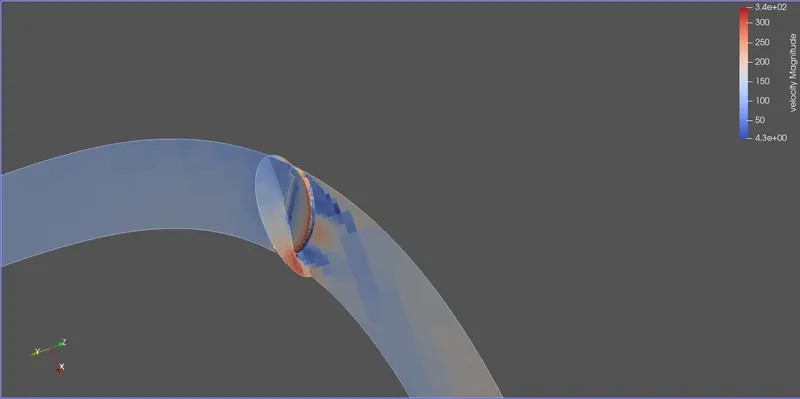
Velocity contour
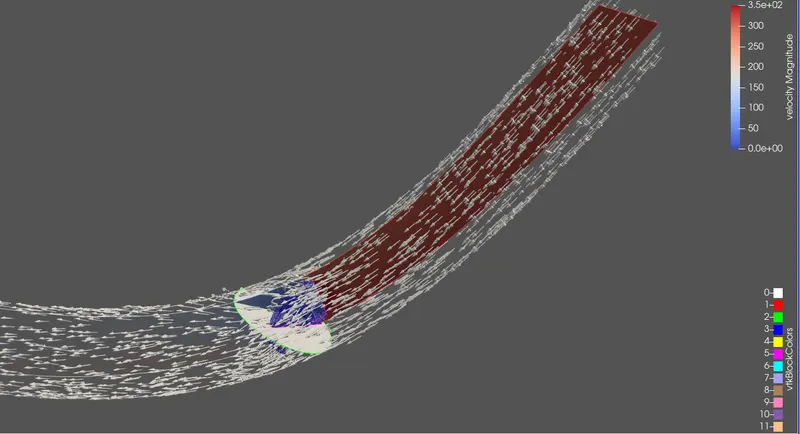
Velocity vectors
Velocity animation
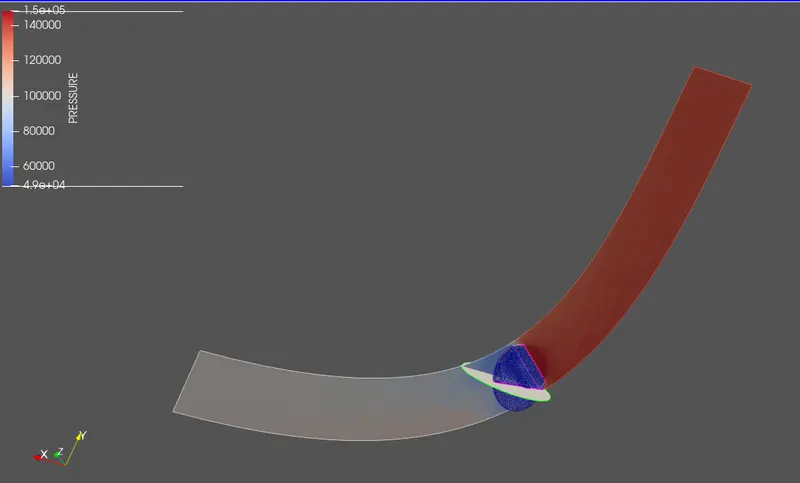
Pressure contour
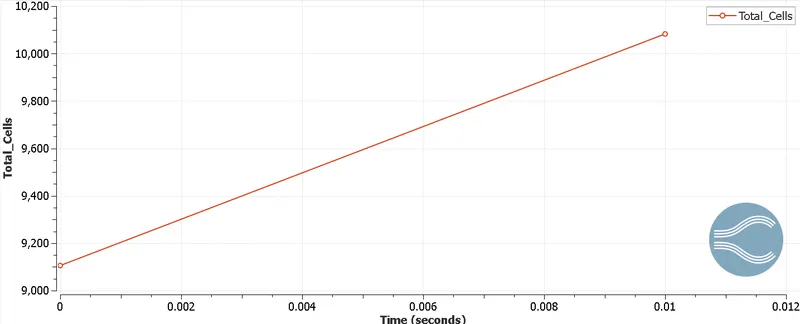
Total cell
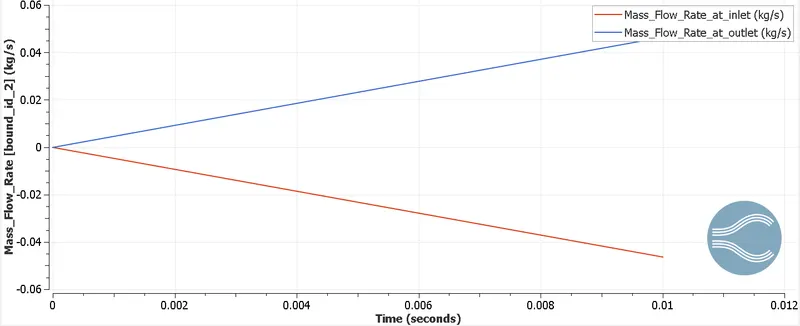
Mass flow rate at inlet and outlet
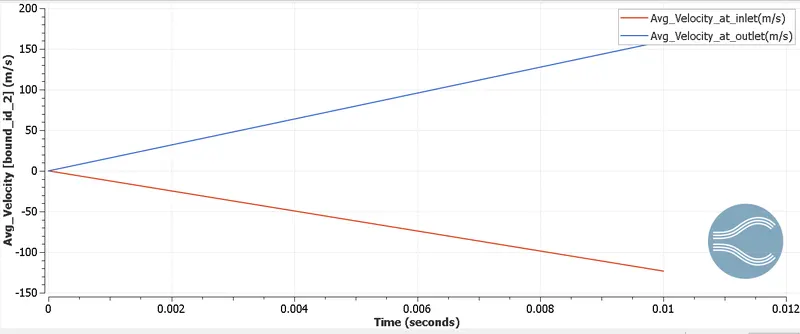
Average velocity at inlet and outlet
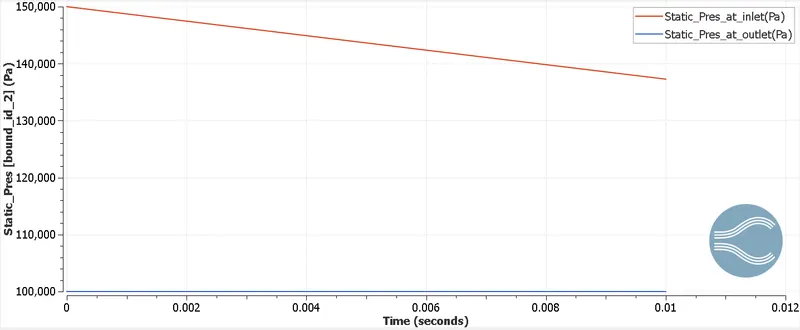
Static pressure at inlet and outlet
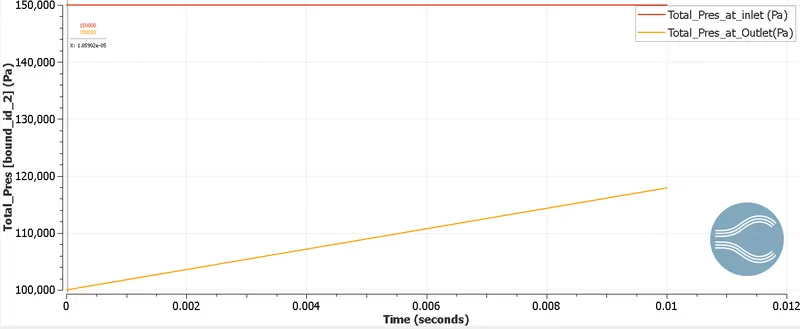
Total Pressure at inlet and outlet
Results and discussion
- With given settngs throttle valve is rotating by an angle of 25 degree.
- As valve rotates, there is mesh updation simulataneously.
- With time, the number of cells increases. This is because with rotation of throttle valve, new mesh elements are getting formed.
- Velocity is maximum, in the gap between throttle valve and elbow wall because of minimum cross-sectional area.
- There is sudden reduction in pressure, after throttle valve due to reduction in flow area.
- Sum of mass flow rate at inlet and outlet at any instant of time is zero. This ensures conservation of mass.
- Static pressure at inlet is decresing with time. This is because, with rotation of valve flow area decreses.
- Total pressure at outlet is increasing becuase, due to ratation of valve flow area decreses and hence dynamic pressure increases, which results into incresed in total pressure at outlet.