Week 4.2: Project Transient simulation of flow over a throttle body
Aim
To simulate a transient fluid flow along the given elbow channel geometry with a rotating throttle valve.
Introduction
Throttle valves are designed to regulate the supply of fluid flow (air-fuel mixture) to an engine and are often operated by a handwheel or a lever. Controlling the supply of fluid is crucial as it dictates the power output of the engine. Analyzing the fluid flow across the throttle valve is important so as to decrease the pressure losses in the system and increase the overall efficiency and smooth working of the engine. In the current study, a transient simulation of an airflow across a rotating throttle valve was conducted.
Method
Domain and Mesh
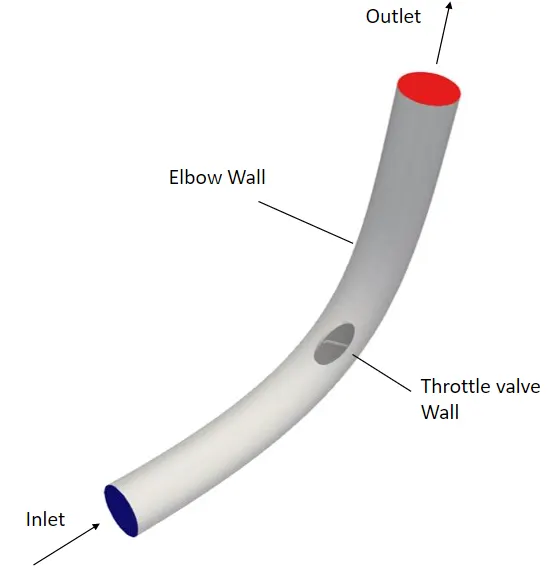
The 3D geometry of the elbow channel was provided and can be seen in the image below.
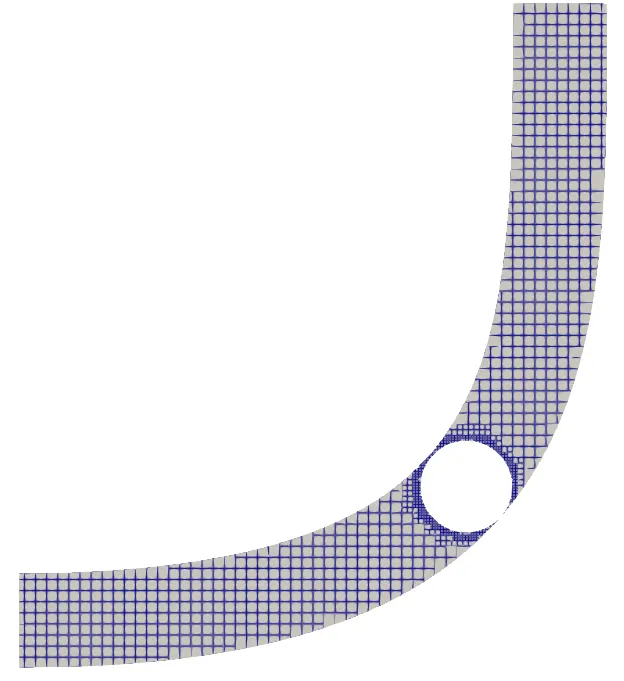
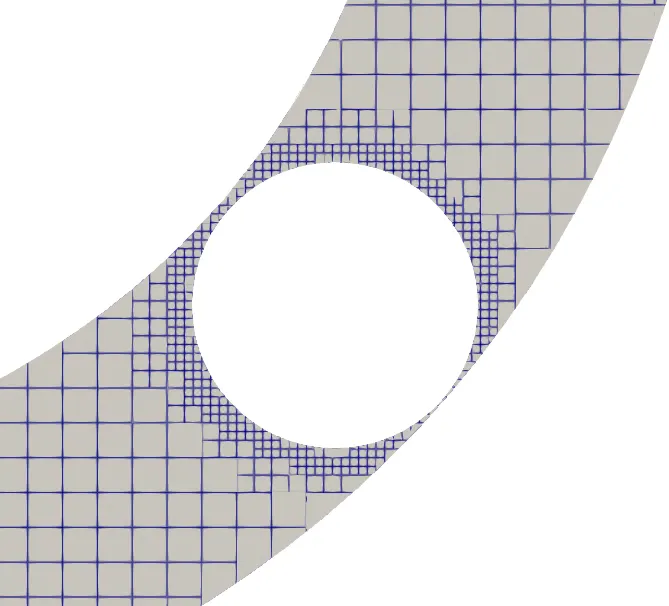
An unstructured cartesian grid was generated over the geometry using two layers of fixed embedding with a scaling of 2 at the walls of the throttle valve. The base mesh sizing was set to 2e-3m and the resulting mesh contained 13k cells as seen below.
CFD Setup
All Simulations were conducted using Converge v3.0. The fluid used in the domain was air with default properties. The pressure at the inlet was set to 1.5 bar and the pressure outlet was set to 1 bar. The elbow and throttle valve walls in the channel were set to no-slip condition. The throttle valve was set to a rotating wall with rotational motion based on the table below.
| Time [s] | Angle [degree] |
| 0 | 0 |
| 0.002 | 25 |
| 0.004 | 25 |
| 0.008 | 0 |
| 0.01 | 0 |
The transient density-based PISO solver was used for the spatial discretization of the flow parameters. Turbulence in the flow was estimated using the two-equation RNG K-Epsilon Model. Momentum, density, turbulence, energy, and species were estimated using the SOR scheme while pressure was estimated using the converge bicgstab scheme.
The variable time stepping method was used for the simulation with minimum and maximum time step sizes of 1e-9s and 1e-5s respectively. The max CFL number of the system was limited to 1. The total time for the simulation was calculated based on the steady-state flow velocity at the fully open state (i.e 150m/s).
Time for one flow through in the channel with a characteristic length of 0.2m,
T = 0.2/150
T = 0.0001333s
Assuming at least 7 flow throughs before stopping the simulation,
T = 7*0.0001333 = 0.0093
T `~~` 0.01s
Results
The images below show the monitors of velocity, pressure, and mass flow rate at the outlet and the total cell count variations due to change in geometry plotted for each timestep.
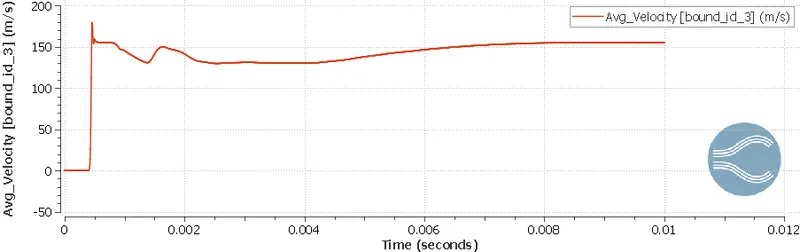
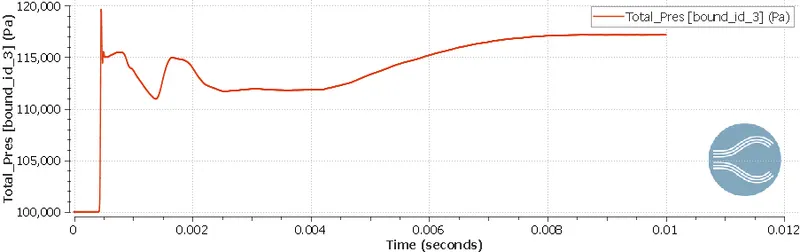
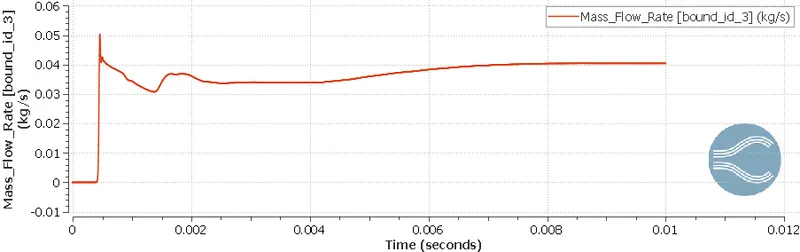
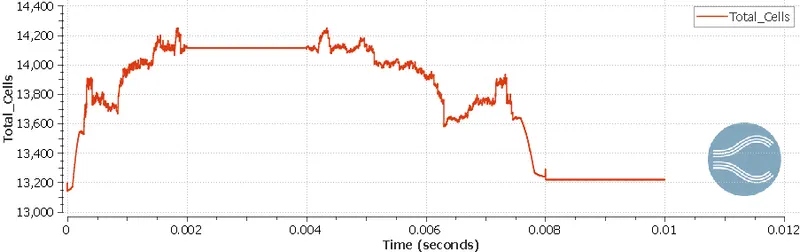
The flattened zones in the total cell count plot indicate no change in geometry/mesh along those specific timesteps.
The image below shows the velocity contour from the simulation at various time steps.
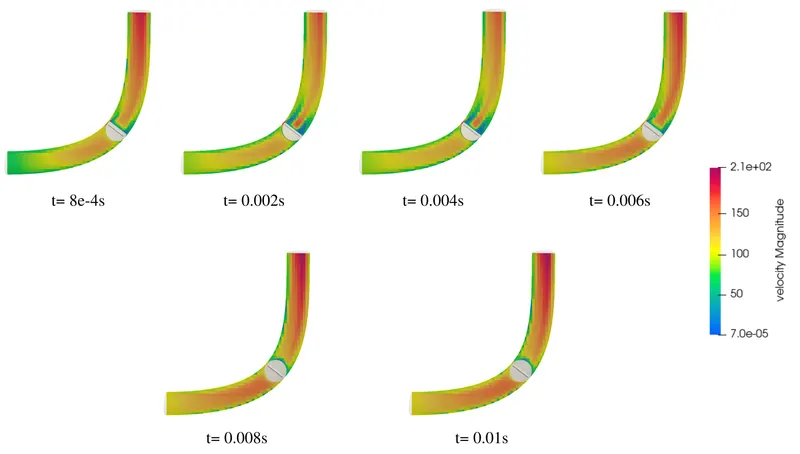
A gradual increase in the overall velocity can be observed at each time step from the inlet to the outlet. At t=0.002s to t=0.004s, the velocity can be seen to slow down and decrease around the throttle valve and can be attributed to the obstruction of the flow by the valve. From t= 0.004s to 0.008s, the velocity can be seen to increase gradually across the throttle valve and this is due to the rotation of the throttle valve coming back to its fully opened state.
The image below shows the pressure contour from the simulation at various time steps.
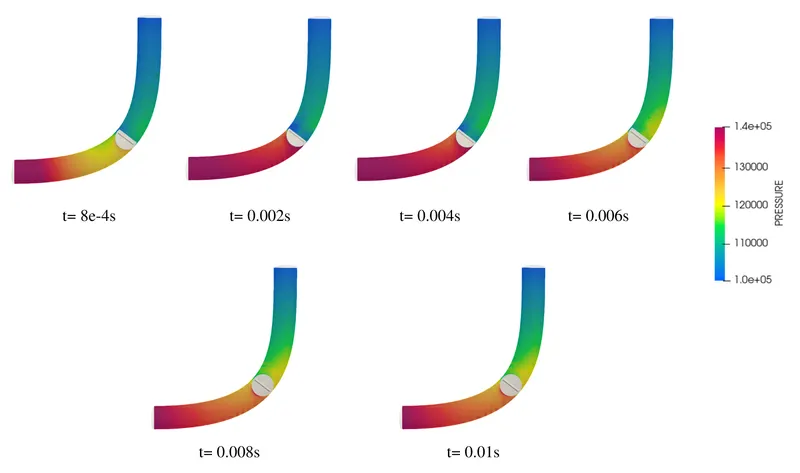
A gradual decrease in the overall pressure can be observed at each time step from the inlet to the outlet. At t=0.002s to t=0.004s, the pressure can be seen to abruptly decrease behind the throttle valve and can be attributed to the obstruction of the flow by the valve. From t= 0.004s to 0.008s, the pressure distribution can be seen to again decrease gradually across the throttle valve and this is due to the rotation of the throttle valve coming back to its fully opened state.
Drive link to the animations
https://drive.google.com/file/d/184y3Ae4z_iwqypndX5R0VI8YvBxVFMap/view?usp=sharing
https://drive.google.com/file/d/135gyKnSe0tBbFTGKMgSGUMMn1p1X5FTQ/view?usp=sharing
The animations clearly show the motion of the fluid around the throttle valve and the amount of recirculation occurring when the throttle valve is set to a 25-degree flow blockage compared to the fully opened state.
Conclusion
The transient simulation of airflow over the given elbow channel with a rotating throttle valve was conducted using converge. Regions of flow stagnation were observed around the throttle valve and were deemed to have been caused by the blockage of the flow. Larger flow stagnation and blockage are caused by the rotation of the throttle valve and are minimum when set to the fully opened state.