Week - 4
AIM :
- To implement control logic of a “washing machine” using Stateflow as per sequence.
- To make a Simulink chart for the “Gear shift” logic as per conditions.
Explanation :
Stateflow Chart :
- Stateflow provides a graphical language that includes state transition diagrams, flow charts, state transition tables, and truth tables.
- We can use Stateflow to describe how MATLAB algorithms and Simulink models react to input signals, events, and time-based conditions.
- Stateflow enables us to design and develop supervisory control, task scheduling, fault management, communication protocols, user interfaces, and hybrid systems.
- With Stateflow, we can model combinatorial and sequential decision logic that can be simulated as a block within a Simulink model or executed as an object in MATLAB.
- Graphical animation enables you to analyze and debug your logic while it is executing. Edit-time and run-time checks ensure design consistency and completeness before implementation.
state chart is a representation of an event-driven (reactive) system. In an event-driven system, the system makes a transition from one state or mode to another, if the condition defining the change is true.
For example, you can use a state chart to represent the automatic transmission of a car. The transmission has these operating states: park, reverse, neutral, drive, and low. As the driver shifts from one position to another, the system transitions from one state to another, such as from park to reverse.
State charts are often used to model complex logic including:
- Scheduling a sequence of tasks or steps for a system
- Defining fault detection, isolation, and recovery logic
- Supervising how to switch between different modes of operation
Using state charts can provide additional capabilities beyond traditional finite state machines, including:
- Modeling hierarchical states for large-scale systems
- Adding flow graphs to define complex decision logic
- Defining orthogonal states to represent systems with parallelism
OBJECTIVE :
To implement control logic of a “washing machine” using Stateflow as per given sequence:
- If the power supply is available, the system gets activated.
- If the Water supply is not available, stop the process & indicate through LED.
- Soaking time = 200s followed by Washing time = 100s.
- Then rinsing happens for next 20s & dryer runs for 50s.
Simulation :
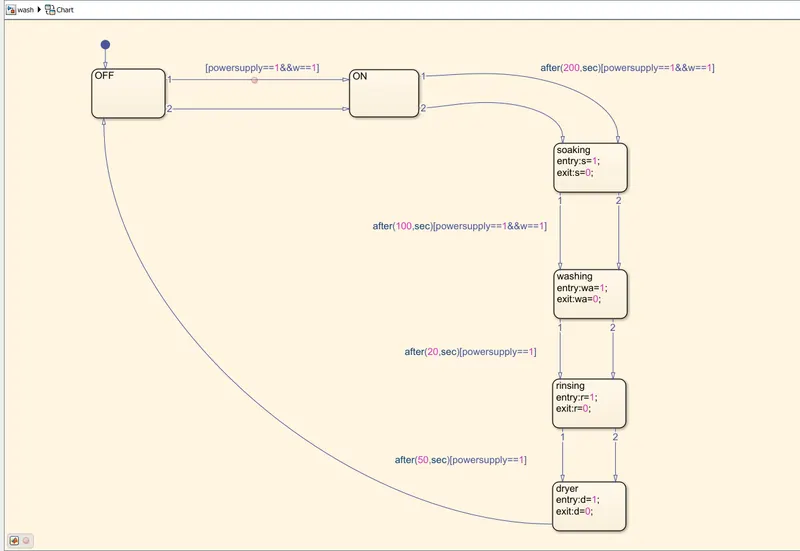
- OFF and ON are two conditions that are given at the input which will provide the signal for the power to go from one stage to another.
- The transition line is given the command powersupply=1 and water(w)=1.
- If the water supply is not available the process is stopped.
- The four stages of the washing machine are soaking(for 200 seconds), washing(100seconds), rinsing(after 20 seconds), dryer(after 50 seconds).
- The variables defined for the different process are soaking(s) , washing(wa) , rinsing(r) , dryer(d).
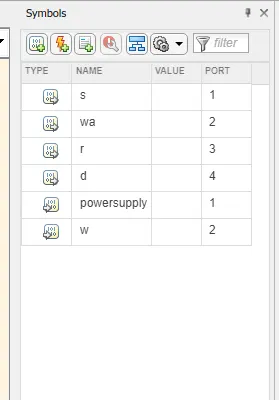
- The variables s(port 1), wa(port 2) , r(port 3) , d(port 4) are given output ports and 'powersupply'(port 1) and 'w'(port 2) are given input ports.
Debugging :
- We can step wise simulate the state flow using DEBUG.
- DEBUG > add breakpoint > Run
- Now it gives us a step-wise view of the flow of signal and its checking conditions.
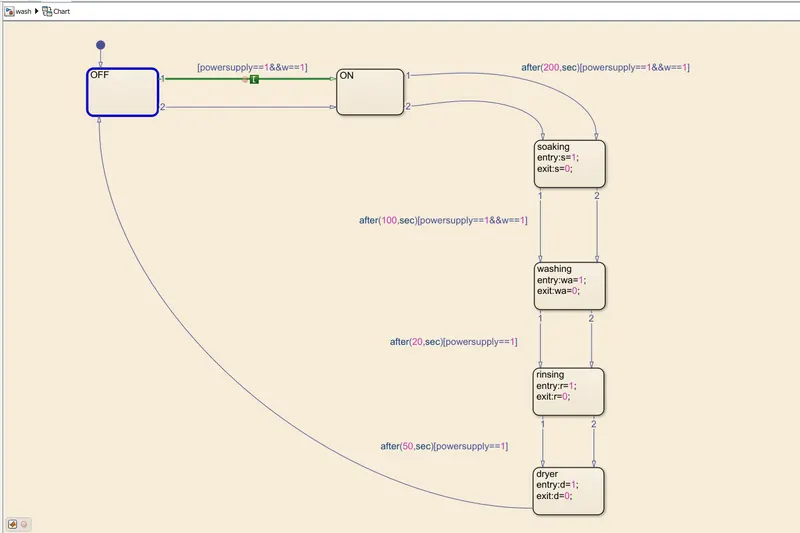
- Once the power is available, it checks for the input conditions to be satisfied.
- If the conditions are satisfied it passes signal to the next stage.
- The below figure shows us the example.
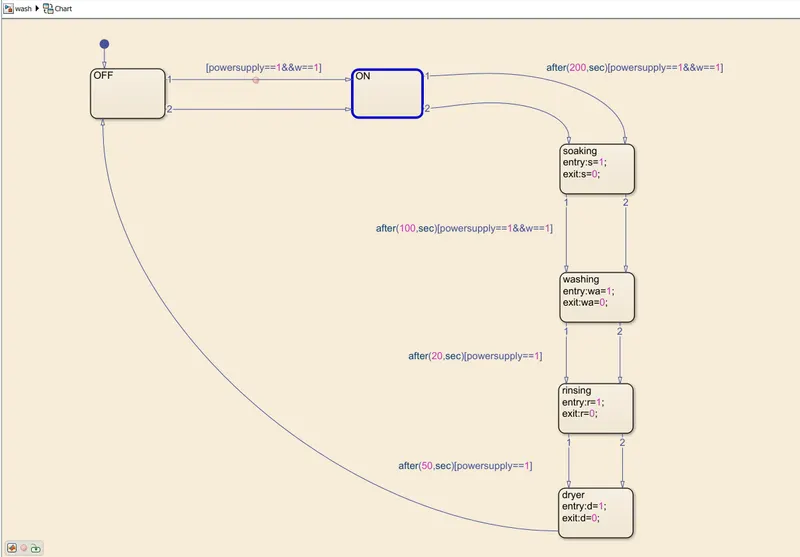
- In every step before going to the next process it repeats the process and checks for the conditions for the entry and exit.
- The conditions being satisfied, signal passes on.
- 1 being ON and 0 being OFF.
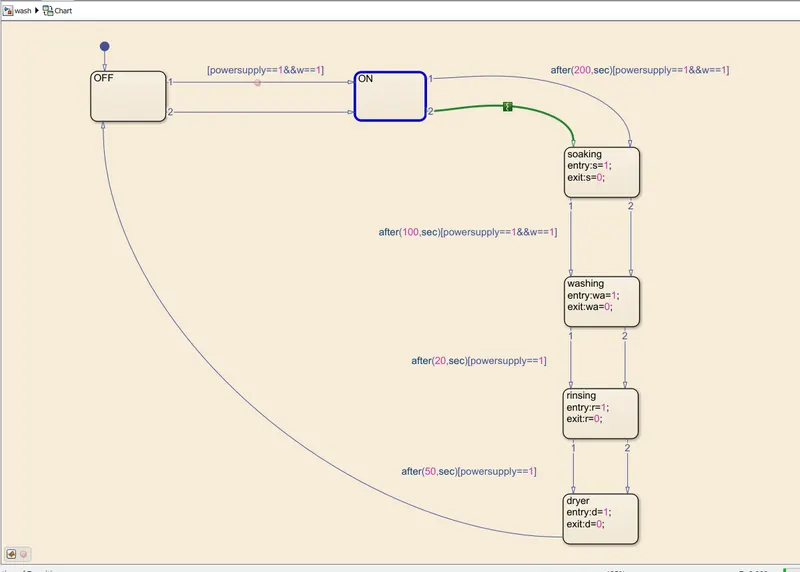
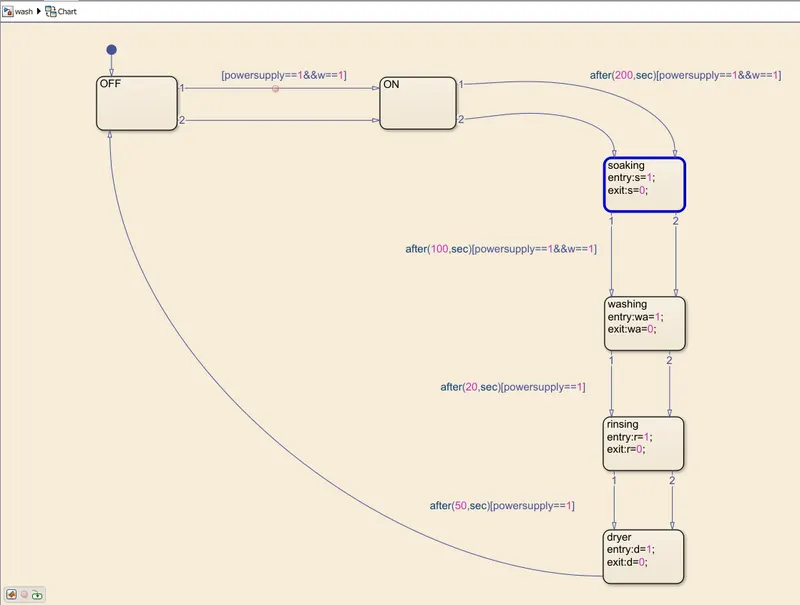
- The whole process is repeated for the entire simulation.
Simulation Result :
The four specific conditions of the challenge is defined and shown at the specific intervals of time.
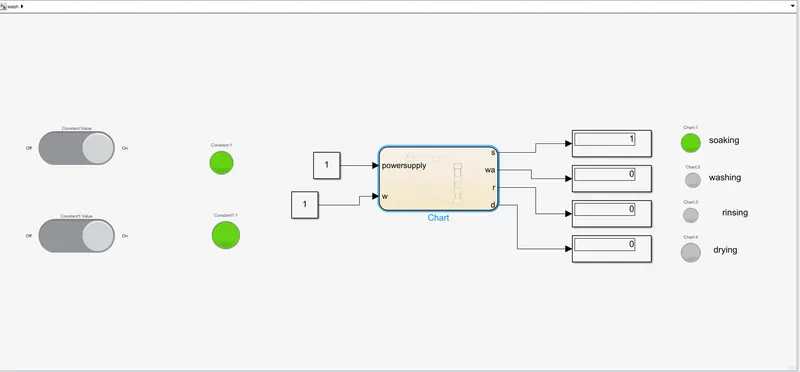
- we have taken four lamps for the four processes to indicate its working at the right time.
- when the soaking is on the green light will glow, and when washing is on that specific green light will glow.
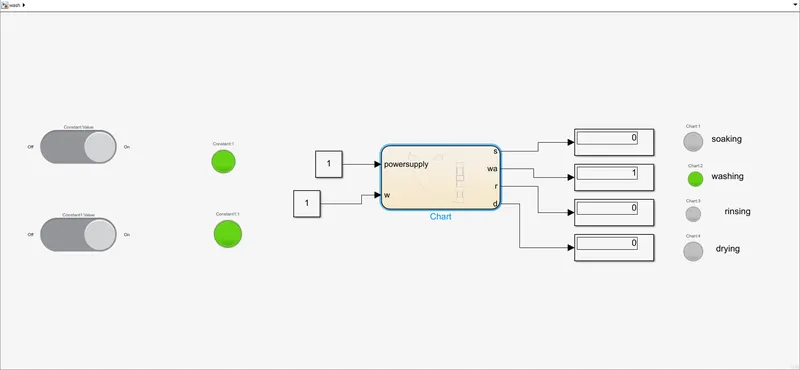
- This condition is for washing, when washing is on for 100 seconds the green light is on.
- The display gives us the value of 1 , which indicates that power supply is ON.
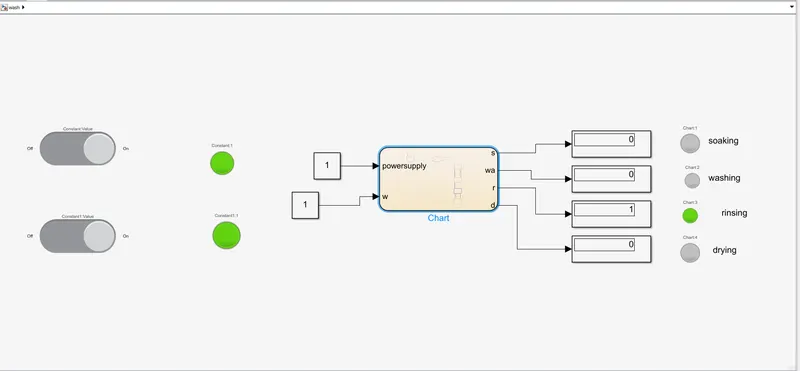
- The rinsing is done after a interval of 20 seconds, during this time the light is ON for the rinsing condition.
- The display is showing a value of 1.
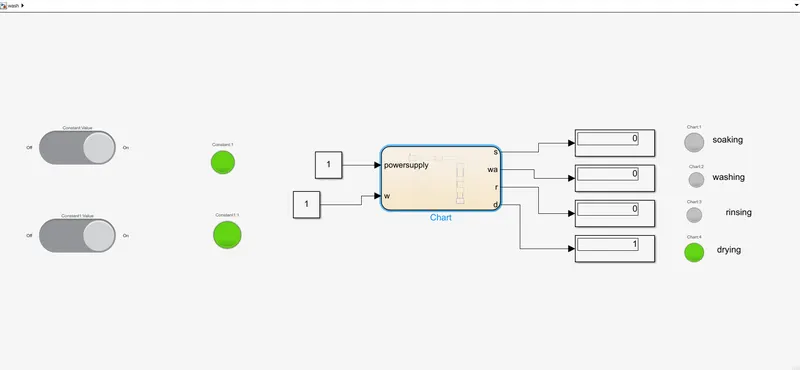
- The drying has a value after an interval of 50 seconds, hence the light is green in this step.
- The value at the display at this condition is 1.
Power and Water Conditions :
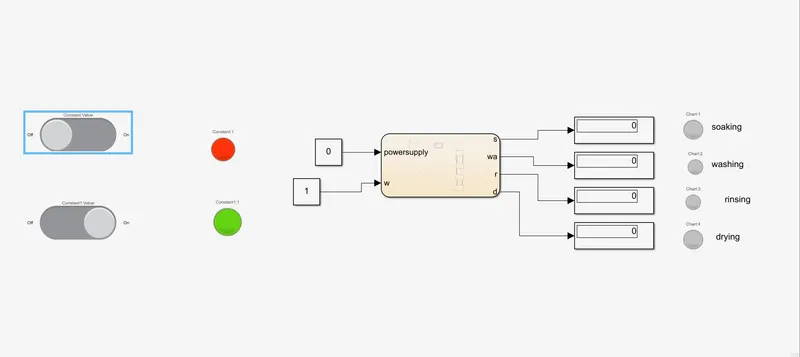
- Here the power supply conditions are OFF as the switch is in OFF CONDITION.
- Hence, the lamp is indicating red condition.
- The power supply is cut-off, hence the simulation is stopped.
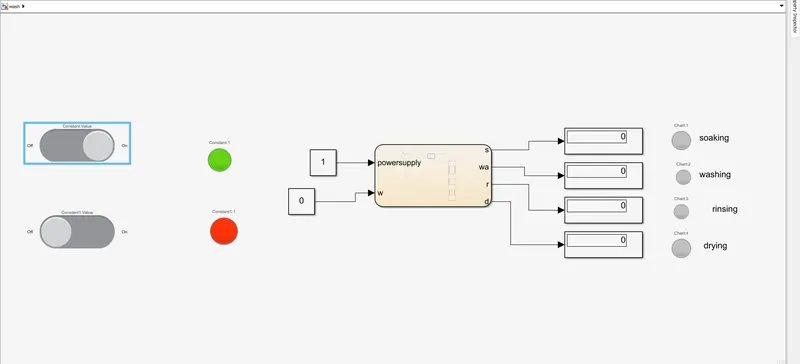
- We can observe that the water supply is cut-off in this condition.
- so the water lamp is in red condition.
OBJECTIVE :
To make a Simulink chart for the “Gear shift” logic as per below conditions:
Speed Range(kmph) Gear
0 to 15 1
16 to 25 2
26 to 40 3
41 to 60 4
Above 61 5
Explanation :
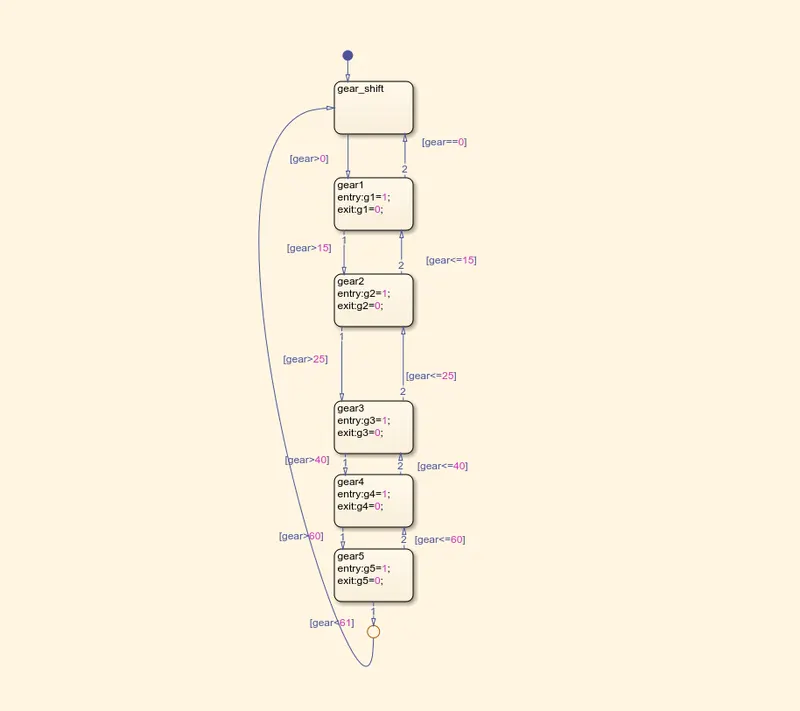
- Gear_shift is the input signal given in the form of state, now two conditions are given as transitions.
- Transition 1 is given a condition gear>0,which means the power supply will happen when the grear is greater than zero.
- Transition 2 is given a condition gear=0, then the speed will be stopped and powersupply stops.
Gear 1 :
The condition applied are :
- for entry g1 = 1;
- for exit g1 = 0;
- and the condition is if the speed is greater than 15, then the power will pass to the 2nd gear.
- if the speed is less than 15, the power will stop at that specified limit.
Gear 2 :
The conditions applied are:
- for entry g2 = 1;
- for entry g2 = 0;
- the condition is if the speed is greater than 25, then the power will pass to the 3rd gear.
- if the speed is less than 25, the power will not flow and the speed is stopped.
Gear 3 :
The conditions applied are :
- for entry g3 = 1;
- for entry g3 = 0;
- the condition is if the speed is greater than 40, then the power will pass to the 4th gear.
- if the speed is less than 40, the power will not flow and the speed is stopped.
Gear 4 :
- for entry g4 = 1;
- for entry g4 = 0;
- the condition is if the speed is greater than 60, then the power will pass to the 5th gear.
- if the speed is less than 60, the power will not flow and the speed is stopped.
Gear 5 :
- for entry g5 = 1;
- for entry g5 = 0;
- the condition is if the speed is greater than 61, then the transmission will run in fifth gear for the rest of the cycle.
Now from the symbols pane we have defined the input and output ports.
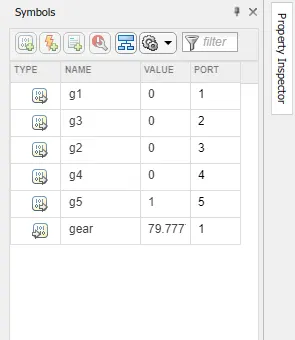
The terms that are defined are:
- g1 - output port (port1).
- g2 - output port(port2).
- g3 - output port(port3).
- g4 - output port(port4).
- gear - input port.
The output ports are connected to the display to get a value of '0' and '1'.
'1' meaning the signal will pass on.
'0' meaning the signal will stop.
Simulation :
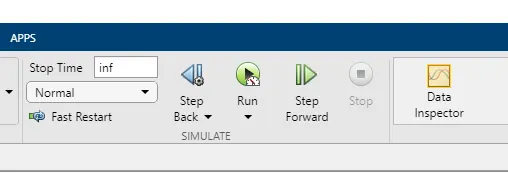
For the simulation the 'stop time' is taken as infinity so that the system runs for infinity amount of time, so that we can get the necessary values for the particular gear and we get the right values for the specific gear ratio.
- The constant block is connected to the slider
-
The Slider block tunes the value of the connected block parameter during simulation.
-
For example, we can connect the Slider block to a Gain block in your model and adjust its value during simulation.
-
We can modify the range of the Slider block's scale to fit your data and use the Slider block with other Dashboard blocks to create an interactive dashboard to control your model.
- We took 5 lamp blocks from the library browser.
- The 5 blocks are connected to the five output ports, for us to give a proper signal at the proper gear number.
- Green means the value is 1, and that specific gear is 'ON'.
- Red means the value is 0, and that specific gear is 'OFF'.
Debugging :
- We can step wise simulate the state flow using DEBUG.
- DEBUG > add breakpoint > Run
- Now it gives us a step-wise view of the flow of signal and its checking conditions.
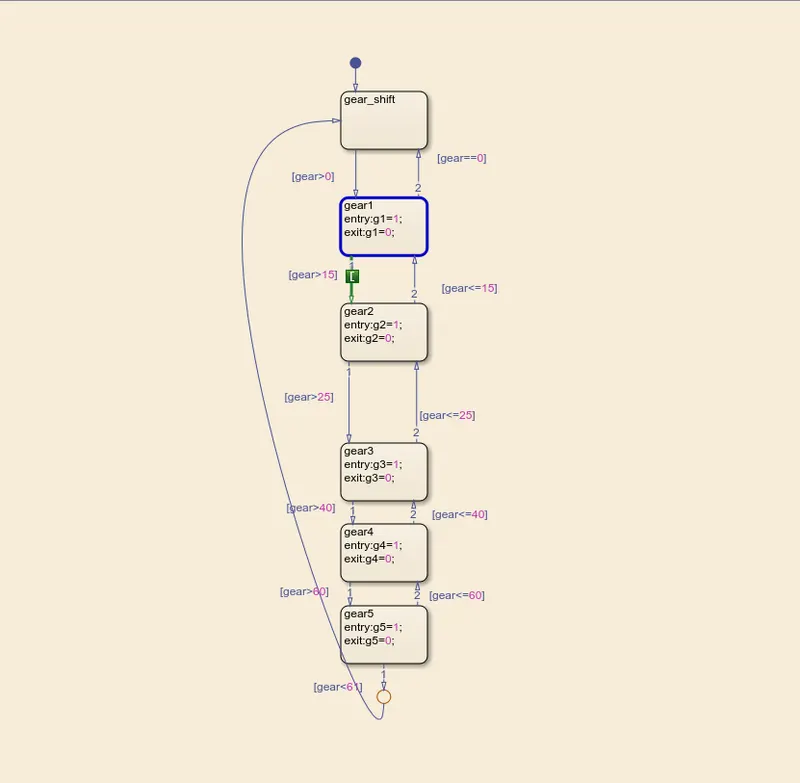
- In every step before going to the next process it repeats the process and checks for the conditions for the entry and exit.
- The conditions being satisfied, signal passes on.
- 1 being ON and 0 being OFF.
- The whole process is repeated for the entire simulation.
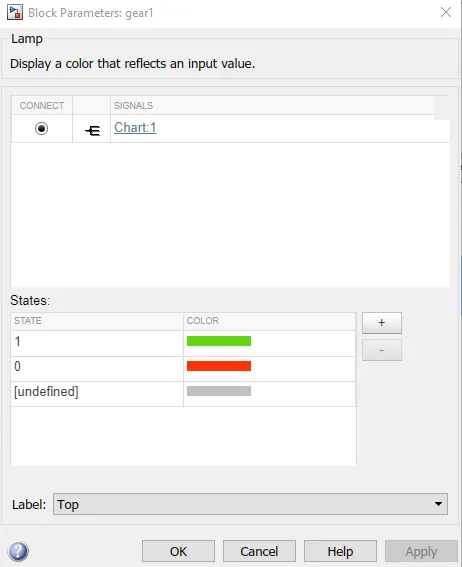
Gear 1 :
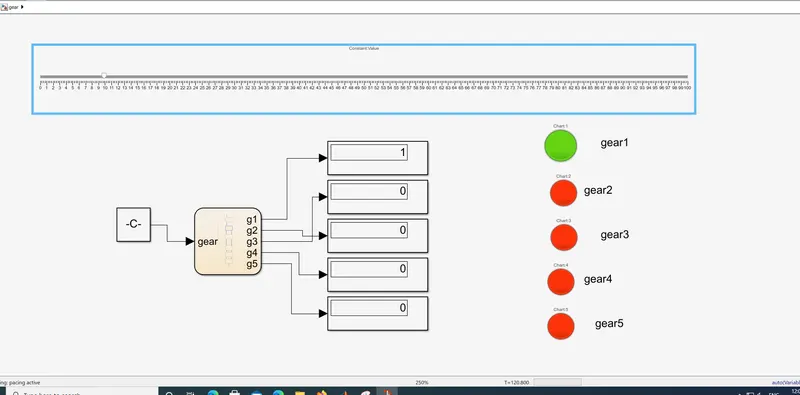
When the speed was 10 the power was at gear 1, hence the light was green.
And the display is showing a value of 1 at g1 port, which means the transmission is correct.
Gear 2 :
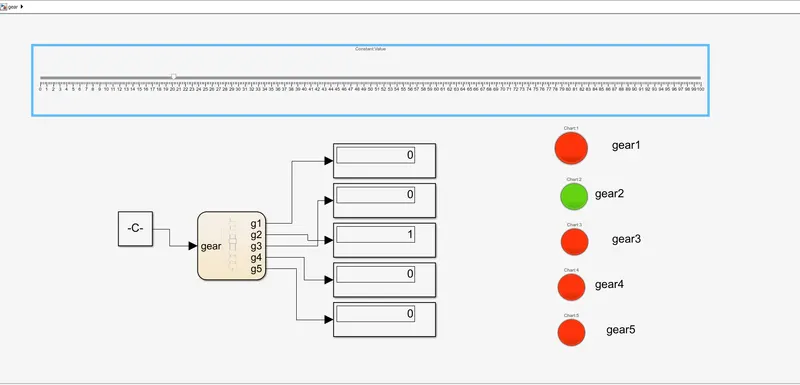
When the speed was 20 the power was at 2nd gear, hence the light was green.
And the display is showing a value of 1 at g2 port, which means the transmission is correct.
Gear 3 :
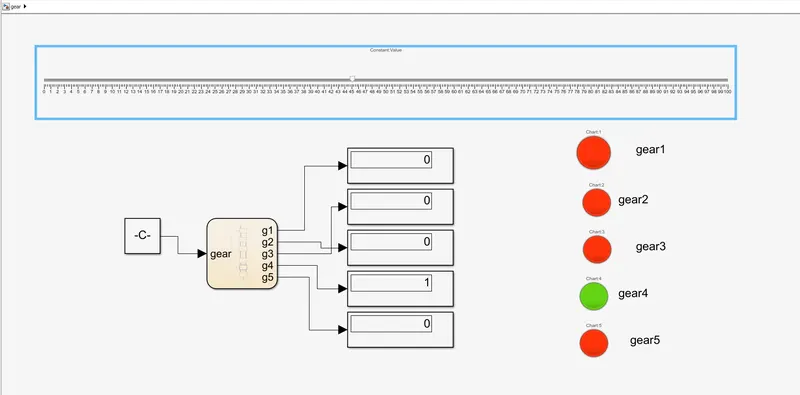
When the speed was 45 the power was at 3rd gear, hence the light was green.
And the display is showing a value of 1 at g3 port, which means the transmission is correct.
Gear 4 :
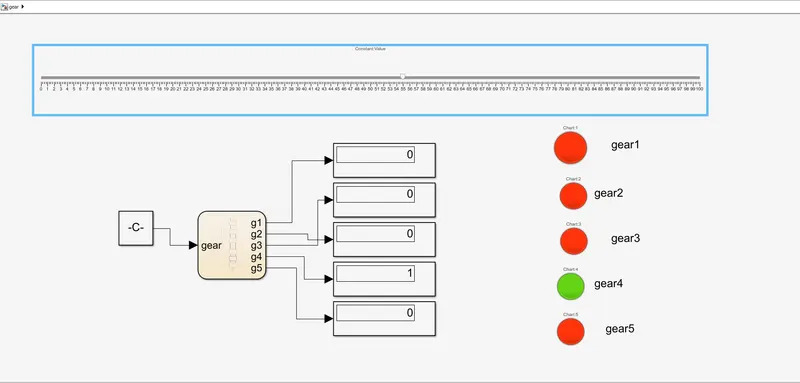
When the speed was 56 the power was at 4th gear, hence the light was green.
And the display is showing a value of 1 at g4 port, which means the transmission is correct.
Gear 5 :
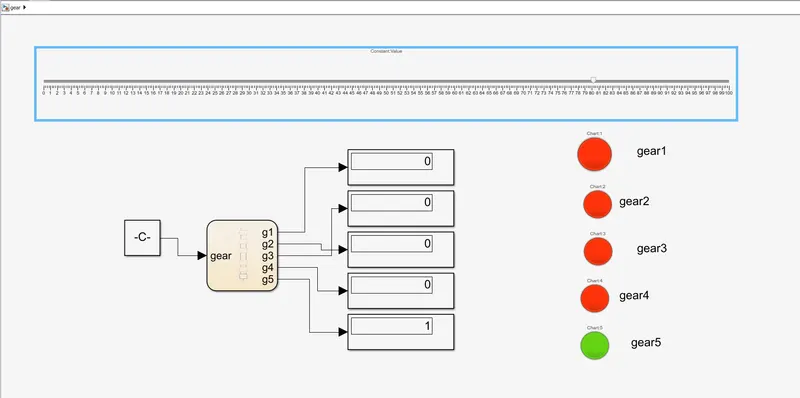
When the speed was 80 the power was at 5th gear, hence the light was green.
And the display is showing a value of 1 at g5 port, which means the transmission is correct.
Conclusion :
- The simulation for both the washing machine and gear shift logic is successfully run and performed.
- The desired result is obtained.