Project 1 - Parsing NASA thermodynamic data
AIM :
To calculate the molecular weight of of each species,and plot the Cp, Enthalpy and Entropy for the local temperature range (low temperature : high temperature) specific for each species.
GOVERNING EQUATIONS :
Cp = Specific Heat. (j/mol*k).
H = Enthalpy. (j/mol).
S = Entropy. (j/mol*k).
R = Universal Gas Constant(8.314).
FUNCTION :
Specific Heat :
function [c_p] = specific_heat(a1,a2,a3,a4,a5,b1,b2,b3,b4,b5,c1,c2,c3,c4,locallow_temp,localmid_temp,localhigh_temp,t,R);

for i = 1:length(t);


if (t(i)>localmid_temp);
    c_p(i)=(R*((a1)+(a2*t(i))+(a3*t(i).^2)+(a4*t(i).^3)+(a5*t(i).^4)));
else
    c_p(i)=(R*((b3)+(b4*t(i))+(b5*t(i).^2)+(c1*t(i).^3)+(c2*t(i).^4)));
end
end- The variable c_p is defined as the specific heat and all the 14 coefficient of a particular species is taken into consideration along with the local low temperature, local mid temperature and local high temperature.
- Then a for loop is created with a variable 'i' which calculates the entire length of temperature and considers 100 values.
- Now, a ('if' and 'else') condition is applied where if temperature along the length of 'i' is greater than the local mid temperature then it will consider the first seven coefficients or else it will consider last seven coefficients.
- The formula for specific heat is coded with the proper formulae.
- The for loop is ended.
Entropy :
function  [s] = entropy(a1,a2,a3,a4,a5,b1,b2,b3,b4,b5,c1,c2,c3,c4,locallow_temp,localmid_temp,localhigh_temp,t,R);
for i = 1:length(t);

    if(t(i)>localmid_temp);
        s(i) = (a1*log(t(i))+(a2*t(i)+(a3*t(i).^2)/2+(a4*t(i).^3)/3+(a5*t(i).^4)/4+ b2))*R;
    else
        s(i) = (b3*log(t(i))+(b4*t(i)+(b5*t(i).^2)/2+(c1*t(i).^3)/3+(c2*t(i).^4)/4+ c4))*R;
    end
end
- A variable 's' is considered for the function of entropy, all the forteen coefficients are defined along with local low temperature,local mid temperature and local high temperature, and the temperature array and the universal constant.
- Then a for loop is created with a variable 'i' which calculates the entire length of 't' for 100 values.
- Now, a ('if' and 'else') condition is applied where if temperature along the length of 'i' is greater than the local mid temperature then it will consider the first seven coefficients or else it will consider last seven coefficients.
- The formula for Entropy is coded with the proper formulae.
- The for loop is ended.
Enthalpy :
function [h] = enthalpy(a1,a2,a3,a4,a5,b1,b2,b3,b4,b5,c1,c2,c3,c4,locallow_temp,localmid_temp,localhigh_temp,t,R);

for i = 1:length(t);

if t(i)>localmid_temp;

    h(i) = (a1+(a2*t(i))/2+(a3*t(i).^2)/3+(a4*t(i).^3)/4+(a5*t(i).^4)/5+(b1/t(i)))*R*t(i);
else
    h(i) = (b3+(b4*t(i))/2+(b5*t(i).^2)/3+(c1*t(i).^3)/4+(c2*t(i).^4)/5+(c3/t(i)))*R*t(i);

end
end
- The variable 'h' is defined as the specific heat and all the 14 coefficient of a particular species is taken into consideration along with the local low temperature, local mid temperature and local high temperature.
- Then a for loop is created with a variable 'i' which calculates the entire length of temperature and considers 100 values.
- Now, a ('if' and 'else') condition is applied where if temperature along the length of 'i' is greater than the local mid temperature then it will consider the first seven coefficients or else it will consider last seven coefficients.
- The formula for enthalpy is coded with the proper formulae.
- The for loop is ended.
Molecular Weight :
function [m] = molecular_weight(species_name);
elements = ['H','O','C','N','A'];
atomic_mass = [1,16,12,14,18];

m = 0;
for i = 1:length(species_name);
   for j = 1:length(elements);

    if strcmpi(species_name(i),elements(j));

    m = m + (atomic_mass(j));
    x = j;
    end
   end

    n = str2double(species_name(i));
    if   n>1
    m = m + (atomic_mass(x)*(n-1));
    end
    end
- The function 'm' is coded for the calculation of molecular weight for the each species in the data sheet.
- The elements considered are ['H,O,C,N,A'].
- And the atomic mass are [1,16,12,14,18].
- The value for m is taken as 0.
- A for loop is created with a variable 'i' for the entire length of all the species to calculate the molecular weight.
- And a variable 'j' is created to read the entire length of the elements.
- 'strcmpi' compares 'species_name(i)' and 'elements(j)', ignoring any differences in letter case. The function returns
1(true) if the two are identical and0(false) otherwise. Text is considered identical if the size and content of each are the same, aside from case. - m = m + (atomic_mass(j)) is the formula for the molecular_weight calculation for the all iteration of length 'j'.
- n = str2double(species_name(i))
- 'str2double' converts the text to double precision values. str contains text that represents real or complex numeric values. str can be a character vector, a cell array of character vectors, or a string array.
- If the variable is n >1
- Then it will run the iteration more times and perform the maths of (n-1)until it gets all the values of the elements.
- Gradually it gives all the values of the molecular weight of the species respectively.
- with the formula m = m + (atomic_mass(x)*(n-1)).
Explanation for main code :
-
clear all close all clc -
clear all - clear all command is used to clear all the running functions in the workspace.
-
close all - close all command is used to close all the plots and graphs running at the background.
- clc - clc command is used to clear the workspace.
2.
f1 = fopen('THERMO.dat','r');
- fopen('THERMO.dat'") opens the file,'THERMO.dat', for binary read access, and returns an integer file identifier equal to or greater than 3.
- Additionally it specifies the order for reading or writing bytes or bits in the file using the 'machinefmt' argument. The optional 'encodingIn' argument specifies the character encoding scheme associated with the file.
- The command 'r' is used to read the data file.
3.
%skipping the lines
for i = 1:5;
   fgetl(f1);
end
- We used a for loop to skip the first five lines.
- A variable 'i' is used for the length of 1:5.
- fgetl(f1) reads one line of text from the instrument connected to object
, and returns the data to tline. The returned data includes the terminator with the text line. - End command is used to close the for loop.
4.
for i = 1:53;
tline = fgetl(f1);
O = strsplit(tline,' ');
species_name = O{1};
z = length(O);
- We created the for loop for a variable 'i' for an entire length of 1:53 species.
- 'tline = fgetl(f1)' considers the next line every time from the data text and reads the text.
- species_name is mentioned for the first species 'o'
- And a variable (o) is considered for the entire species of element 'o'.
5.
locallow_temp = str2double(O{z-3});
localhigh_temp = str2double(O{z-2});
localmid_temp = str2double(O{z-1})- The local low temperature is coded with the command 'str2double'.{z-3} command is used to calculate the perfect position of local low temperature.
- 'str2double' converts the text to double precision values. str contains text that represents real or complex numeric values. str can be a character vector, a cell array of character vectors, or a string array.
- local high temperature is defined with a positon of {z-2}, for getting the temperature value.
- local high temperature is defined in the same way with 'str2double' command with the position of {z-1}.
6.
Plotting the coefficient:
tline1 = fgetl(f1);
a = findstr(tline1,'E');

%first coefficient
a1 = tline1(1:a(1)+3);
a1 = str2num(a1);

%second coefficient
a2 = tline1(a(1)+4:a(2)+3);
a2 = str2num(a2);

%third coefficient
a3 = tline1(a(2)+4:a(3)+3);
a3 = str2num(a3);

%forth coefficient
a4 = tline1(a(3)+4:a(4)+3);
a4 = str2num(a4);

%fifth coefficient
a5 = tline1(a(4)+5:a(5)+3);
a5 = str2num(a5);


tline2 = fgetl(f1);
b = findstr(tline2,'E');

%sixth coefficient
b1 = tline2(1:b+3);
b1 = str2num(b1);

%seventh coefficient
b2 = tline2(b(1)+4:b(2)+3);
b2 = str2num(b2);

%eighth coefficient
b3 = tline2(b(2)+4:b(3)+3);
b3 = str2num(b3);

%ninth coefficient
b4 = tline2(b(3)+4:b(4)+3);
b4 = str2num(b4);

%tenth coefficient
b5 = tline2(b(4)+4:b(5)+3);
b5 = str2num(b5);


tline3 = fgetl(f1);
c = findstr(tline3,'E');

%eleventh coefficient
c1 = tline3(1:c(1)+3);
c1 = str2num(c1);

%twelvth coefficient
c2 = tline3(c(1)+4:c(2)+3);
c2 = str2num(c2);

%thirteenth coefficient
c3 = tline3(c(2)+4:c(3)+3);
c3 = str2num(c3);

%forteenth coefficient
c4 = tline3(c(3)+4:c(4)+4);
c4 = str2num(c4);
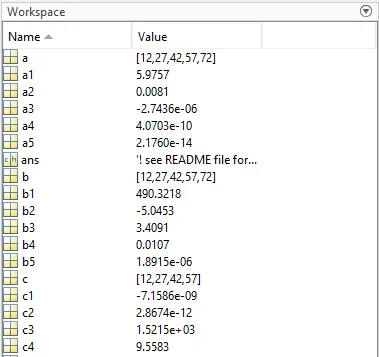
- 'tline1 = fget1(f1)' command is used to take us to the consecutive line and extract the data.
- 'a = findstr(tline1,'E')' findstr command is used to find the letter 'E' from the tline1 and 'E' is used as the base point for the location of every coefficients in the species.
- 'a1 = tline1(1:a(1)+3)'
- First coefficient is read using the command tline.
- From 1 to the length of the coefficient till the letter E and adding a more 3 characters to get the value of whole coefficient.
- 'a1 = str2num(a1)'
- 'string2num' converts a character array or string scalar to a numeric matrix. The input can include spaces, commas, and semicolons to indicate separate elements. If str2num cannot parse the input as numeric values, then it returns an empty matrix.
- Hence we repeat the step for a consecutive 14 steps.
- And with each iteration adding the value to the earlier iteration .
- Hence, we get all the coefficient.
7.
 creating folders
    mkdir(['C:\Users\Student-54\Documents\MATLAB\File parsing\plots\',species_name]);
   cd(['C:\Users\Student-54\Documents\MATLAB\File parsing\plots\',species_name]);


%To calculate the
%specific_heat of the data
[c_p] = specific_heat(a1,a2,a3,a4,a5,b1,b2,b3,b4,b5,c1,c2,c3,c4,locallow_temp,localmid_temp,localhigh_temp,t,R);


%To calculate the
%enthalpy of data
[h] = enthalpy(a1,a2,a3,a4,a5,b1,b2,b3,b4,b5,c1,c2,c3,c4,locallow_temp,localmid_temp,localhigh_temp,t,R);

%To calculate the
%entropy of data
[s] = entropy(a1,a2,a3,a4,a5,b1,b2,b3,b4,b5,c1,c2,c3,c4,locallow_temp,localmid_temp,localhigh_temp,t,R);
- 'mkdir' creates the folder in the specified location of (C:\Users\Student-54\Documents\MATLAB\File parsing\plots)
- cd command changes the current folder to new folder.
- Now to calculate the specific heat ,enthalpy and entropy we run the function in our code to get the whole array of c_p,h,s along the values of t.
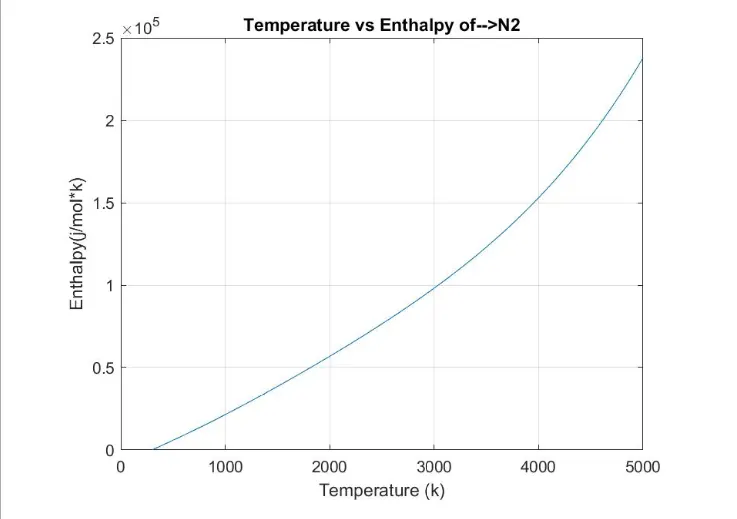
figure(1);
plot(t,h);
grid on
data1 = strcat(species_name,'Enthalpy vs Temperature');
xlabel("Temperature (k)");
ylabel("Enthalpy(j/mol*k)");
title(strcat('Temperature vs Enthalpy of-->',species_name));
f = fullfile(cd);
cd(f);
saveas(gcf,[pwd '/Enthalpy vs temperature.jpg']);
cd(f);
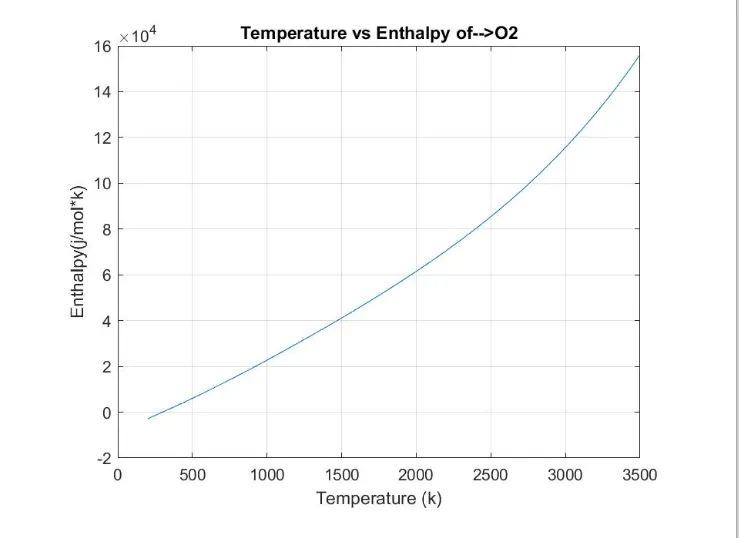
- We plot figure(1) to have the temperature vs enthalpy graph.
- 'strcat' horizontally concatenates each value
. Each input argument can be a character array, a cell array of character vectors, or a string array. - xlabel 'Temperature' is defined.
- ylabel 'Enthalpy' is defined.
- 'fullfile' builds a full file specification from the specified folder and file names. 'fullfile' inserts platform-dependent file separators where necessary.
- 'saveas(enthalpy vs temperature)' saves the figure block diagram specified by figure to filename. Specify the file name as a character vector or string that includes a file extension. The file extension defines the file format. If we do not specify an extension, then saveas saves the figure to a FIG-file. To save the current figure, we need to specify
fig as gcf.
8.
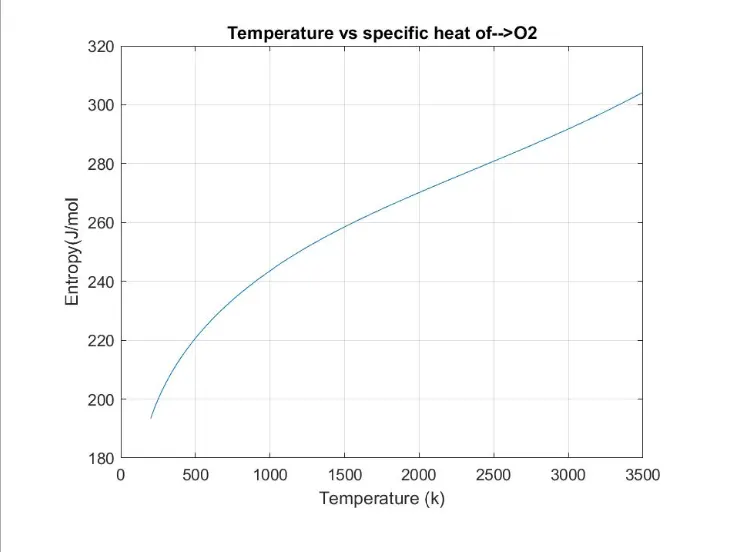
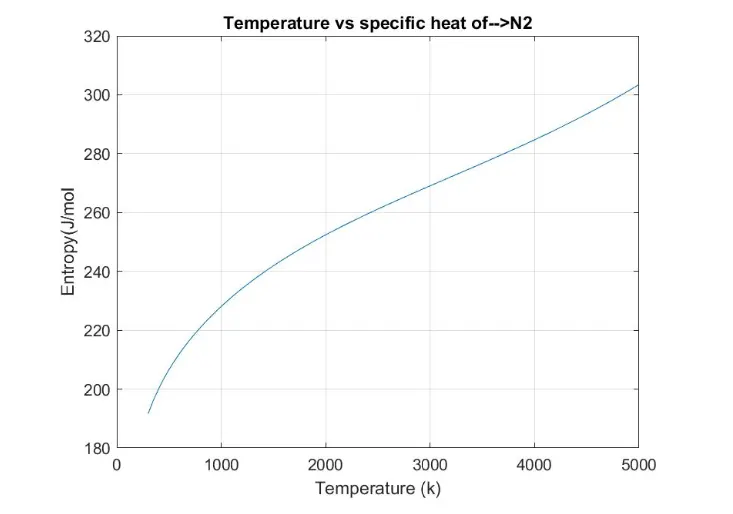
figure(2);
plot(t,s);
grid on
data1 = strcat(species_name,'Entropy vs Temperature');
xlabel("Temperature (k)");
ylabel("Entropy(J/mol");
title(strcat('Temperature vs specific heat of-->',species_name));
f = fullfile(cd);
cd(f);
saveas(gcf,[pwd '/Entropy vs Temperature.jpg']);
cd(f);
- We plot figure(2) to have the temperature vs entropy graph.
- 'strcat' horizontally concatenates each value
. Each input argument can be a character array, a cell array of character vectors, or a string array. - xlabel 'Temperature' is defined.
- ylabel 'Entropy' is defined.
- 'fullfile' builds a full file specification from the specified folder and file names. 'fullfile' inserts platform-dependent file separators where necessary.
- 'saveas(entropy vs temperature)' saves the figure block diagram specified by figure to filename. Specify the file name as a character vector or string that includes a file extension. The file extension defines the file format. If we do not specify an extension, then saveas saves the figure to a FIG-file. To save the current figure, we need to specify
fig as gcf.
9.
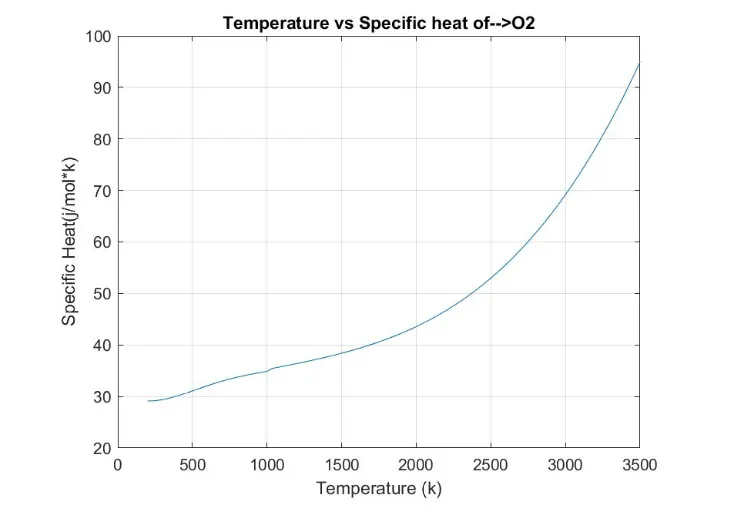
figure(3);
plot(t,c_p);
grid on
data1 = strcat(species_name,'Specific Heat vs Temperature');
xlabel("Temperature (k)");
ylabel("Specific Heat(j/mol*k)");
title(strcat('Temperature vs Specific heat of-->',species_name));
f = fullfile(cd);
cd(f);
saveas(gcf,[pwd '/Specific Heat vs Temperature.jpg']);
cd(f);
- We plot figure(3) to have the temperature vs specific heat graph.
- 'strcat' horizontally concatenates each value
. Each input argument can be a character array, a cell array of character vectors, or a string array. - xlabel 'Temperature' is defined.
- ylabel 'specific heat' is defined.
- 'fullfile' builds a full file specification from the specified folder and file names. 'fullfile' inserts platform-dependent file separators where necessary.
- 'saveas(specific heat vs temperature)' saves the figure block diagram specified by figure to filename. Specify the file name as a character vector or string that includes a file extension. The file extension defines the file format. If we do not specify an extension, then saveas saves the figure to a FIG-file. To save the current figure, we need to specify
fig as gcf.
8.
%molecular weight
m = molecular_weight(species_name);
fprintf('%s mol = %f \n',species_name, m);


title(species_name);
end
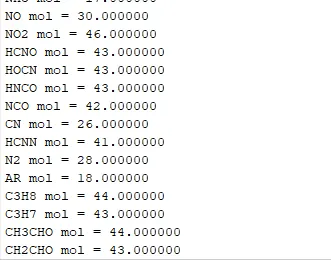
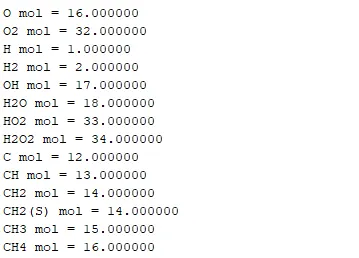
- The molecular weight is defined by the variable 'm' for the entire species of the data.
- fprintf applies the formatspec to all elements of arrays in column order, and writes the data to a text file.fprintf uses the encoding scheme specified in the call to fopen
. - Each species name is given a title.
Molecular values :
Main code :
clear all
close all
clc

f1 = fopen('THERMO.dat','r');

%skipping the lines
for i = 1:5;
   fgetl(f1);
end

for i = 1:53;
tline = fgetl(f1);
O = strsplit(tline,' ');
species_name = O{1};
z = length(O);

locallow_temp = str2double(O{z-3});
localhigh_temp = str2double(O{z-2});
localmid_temp = str2double(O{z-1});


tline1 = fgetl(f1);
a = findstr(tline1,'E');

%first coefficient
a1 = tline1(1:a(1)+3);
a1 = str2num(a1);

%second coefficient
a2 = tline1(a(1)+4:a(2)+3);
a2 = str2num(a2);

%third coefficient
a3 = tline1(a(2)+4:a(3)+3);
a3 = str2num(a3);

%forth coefficient
a4 = tline1(a(3)+4:a(4)+3);
a4 = str2num(a4);

%fifth coefficient
a5 = tline1(a(4)+5:a(5)+3);
a5 = str2num(a5);


tline2 = fgetl(f1);
b = findstr(tline2,'E');

%sixth coefficient
b1 = tline2(1:b+3);
b1 = str2num(b1);

%seventh coefficient
b2 = tline2(b(1)+4:b(2)+3);
b2 = str2num(b2);

%eighth coefficient
b3 = tline2(b(2)+4:b(3)+3);
b3 = str2num(b3);

%ninth coefficient
b4 = tline2(b(3)+4:b(4)+3);
b4 = str2num(b4);

%tenth coefficient
b5 = tline2(b(4)+4:b(5)+3);
b5 = str2num(b5);


tline3 = fgetl(f1);
c = findstr(tline3,'E');

%eleventh coefficient
c1 = tline3(1:c(1)+3);
c1 = str2num(c1);

%twelvth coefficient
c2 = tline3(c(1)+4:c(2)+3);
c2 = str2num(c2);

%thirteenth coefficient
c3 = tline3(c(2)+4:c(3)+3);
c3 = str2num(c3);

%forteenth coefficient
c4 = tline3(c(3)+4:c(4)+4);
c4 = str2num(c4);


%universal gas constant
R = 8.314;
t = linspace(locallow_temp,localhigh_temp,100);


%
%  creating folders
    mkdir(['C:\Users\Student-54\Documents\MATLAB\File parsing\plots\',species_name]);
   cd(['C:\Users\Student-54\Documents\MATLAB\File parsing\plots\',species_name]);


%To calculate the
%specific_heat of the data
[c_p] = specific_heat(a1,a2,a3,a4,a5,b1,b2,b3,b4,b5,c1,c2,c3,c4,locallow_temp,localmid_temp,localhigh_temp,t,R);


%To calculate the
%enthalpy of data
[h] = enthalpy(a1,a2,a3,a4,a5,b1,b2,b3,b4,b5,c1,c2,c3,c4,locallow_temp,localmid_temp,localhigh_temp,t,R);

%To calculate the
%entropy of data
[s] = entropy(a1,a2,a3,a4,a5,b1,b2,b3,b4,b5,c1,c2,c3,c4,locallow_temp,localmid_temp,localhigh_temp,t,R);


figure(1);
plot(t,h);
grid on
data1 = strcat(species_name,'Enthalpy vs Temperature');
xlabel("Temperature (k)");
ylabel("Enthalpy(j/mol*k)");
title(strcat('Temperature vs Enthalpy of-->',species_name));
f = fullfile(cd);
cd(f);
saveas(gcf,[pwd '/Enthalpy vs temperature.jpg']);
cd(f);


figure(2);
plot(t,s);
grid on
data1 = strcat(species_name,'Entropy vs Temperature');
xlabel("Temperature (k)");
ylabel("Entropy(J/mol");
title(strcat('Temperature vs specific heat of-->',species_name));
f = fullfile(cd);
cd(f);
saveas(gcf,[pwd '/Entropy vs Temperature.jpg']);
cd(f);

figure(3);
plot(t,c_p);
grid on
data1 = strcat(species_name,'Specific Heat vs Temperature');
xlabel("Temperature (k)");
ylabel("Specific Heat(j/mol*k)");
title(strcat('Temperature vs Specific heat of-->',species_name));
f = fullfile(cd);
cd(f);
saveas(gcf,[pwd '/Specific Heat vs Temperature.jpg']);
cd(f);


%molecular weight
m = molecular_weight(species_name);
fprintf('%s mol = %f \n',species_name, m);


title(species_name);
end
Plots :
1. For 'O2' -
Temperature vs enthalpy
Temperature vs entropy
Temperature vs specific heat
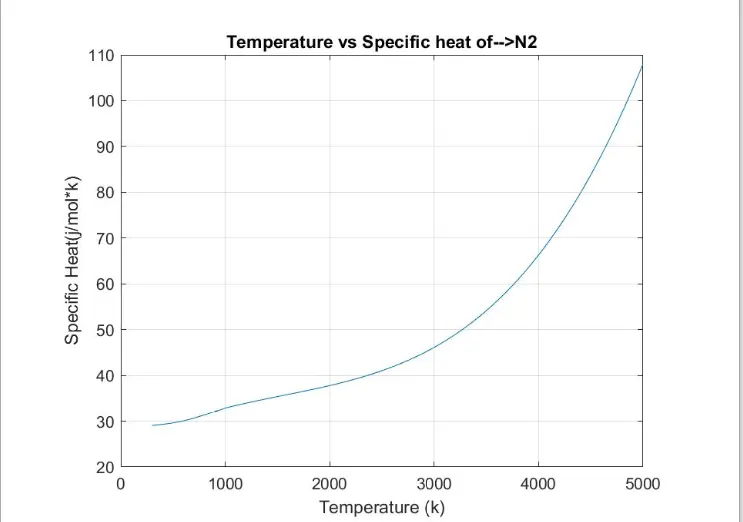
2. For 'N2'
Temperature vs Enthalpy
Temperature vs Entropy
Temperature vs specific heat
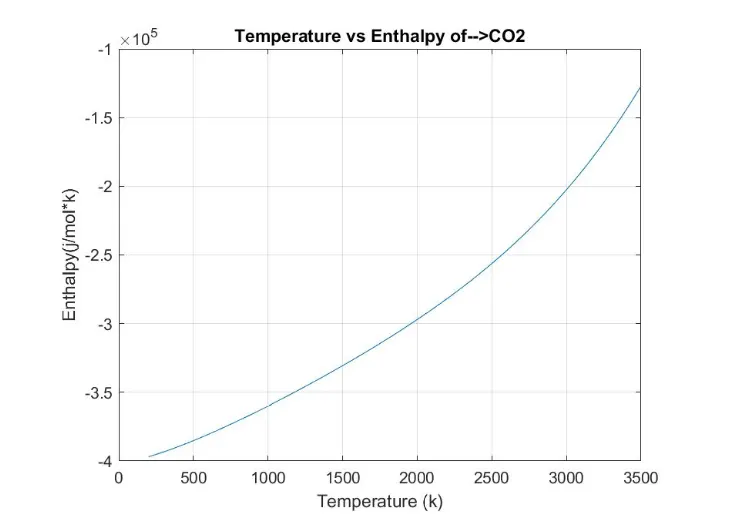
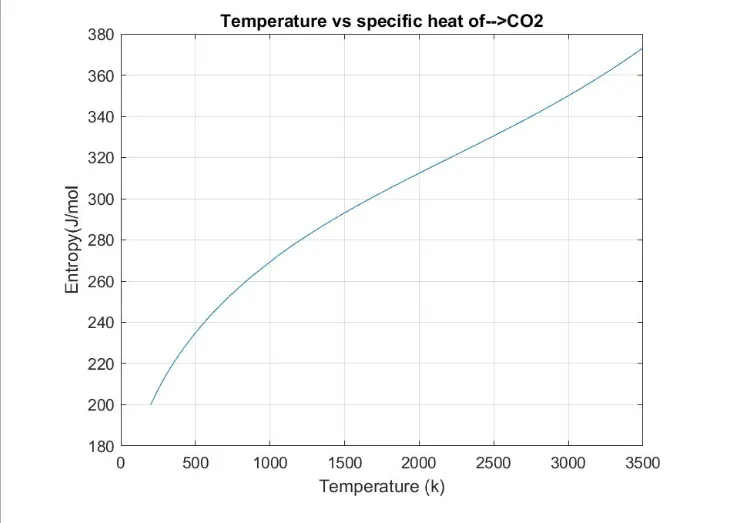
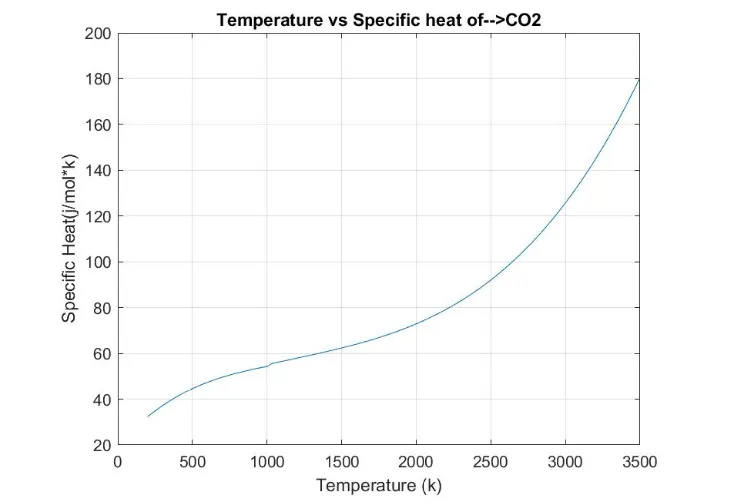
3. For 'CO2
Temperature vs Enthalpy
Temperature vs Entropy
Temperature vs specific heat
Output saved for all the species inside a folder (File parsing).

Error :
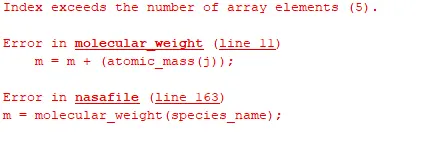
1. 'Elements Error'
Solution:
- We took the species_name 'AR' as a result of which the number of input arguments exeeced the data that is there on the sheet.
- We corrected the function by replacing the element 'A'
- Hence the correct molecular value was claculated.
2. 'For Loop' Error

Solution:
- We did the mistake of ending the for loop as a result the error was evident.
- Hence, the for loop was corrected by end command.