Week 4.1: Project - Steady state simulation of flow over a throttle body
AIM: Steady state simulation for flow over throttle body using converge cfd.
OBJECTIVE:
- To show pressure and velocity contours after post processing the results.
- To show the plots for pressure and velocity contours.
- Showing mesh with surface edges.
- To create an animation in which throttle is visible
INTRODUCTION:
- A throttle is a mechanism by which fluid flow is managed by obstruction or constriction.
- In an IC engine ,the throttle valve plays a major functionality as it is a means of fuel or air entering the engine.
- The throttle on a gasoline engine is a butterfly valve .As the entire valve comes in contact with the fluid flow, erosion also takes place.
- Some modern engines relying on their variable intake valve system to regulate the airflow into the cylinders.
- In an IC engine, throttle body injection allows an older engine design to be converted from carburettor to fuel injection without significantly altering the intake manifold design.
- Throttling valves will have a higher pressure on one side and lower pressure on other end.
- These are used in the following industrial applcations:
- air conditioning
- refrigeration
- hydraullics
- High Temperature application
CASE SET UP
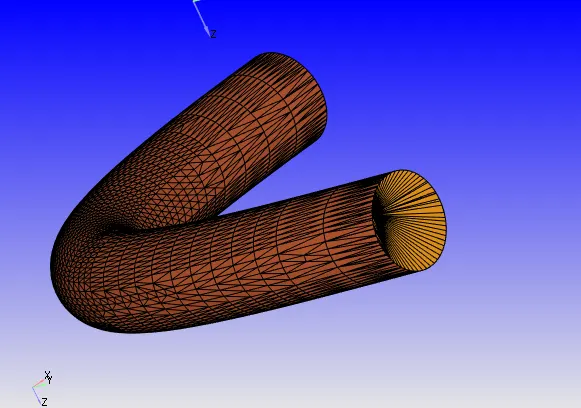
Fig.1 throttle body
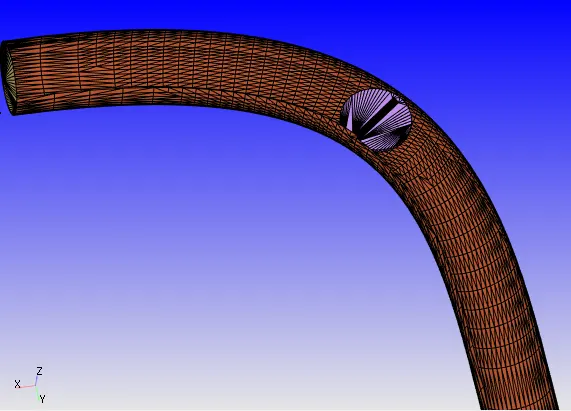
Fig.2 Throttle valve inside throttle body
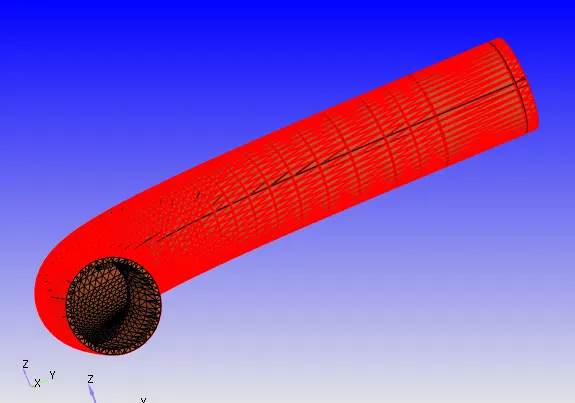
Fig.3 selecting outer surface for hiding
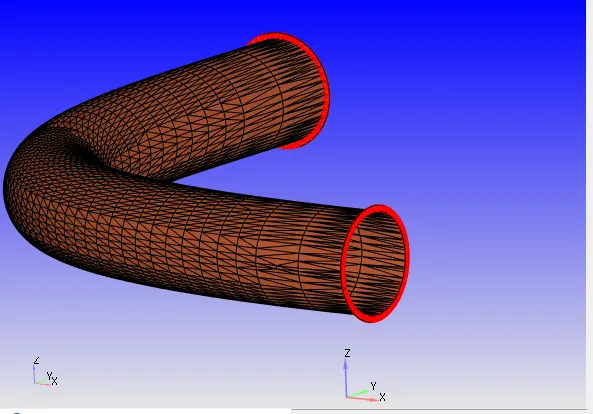
Fig.4
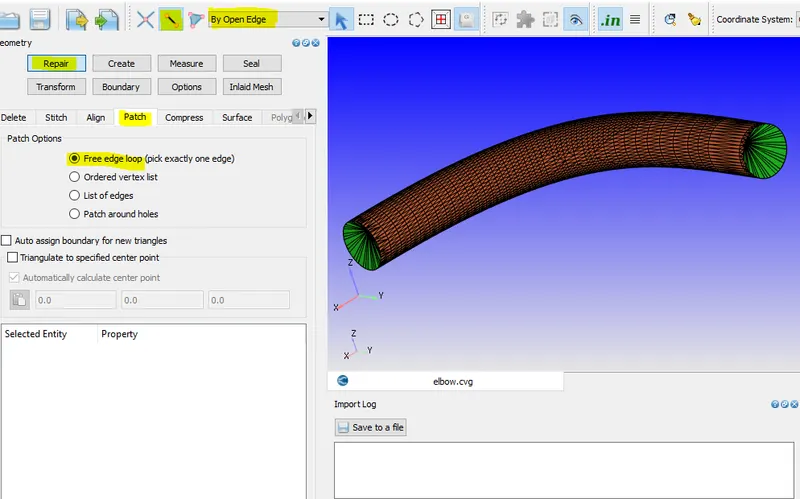
Fig.5 Patching inlet and outlet face
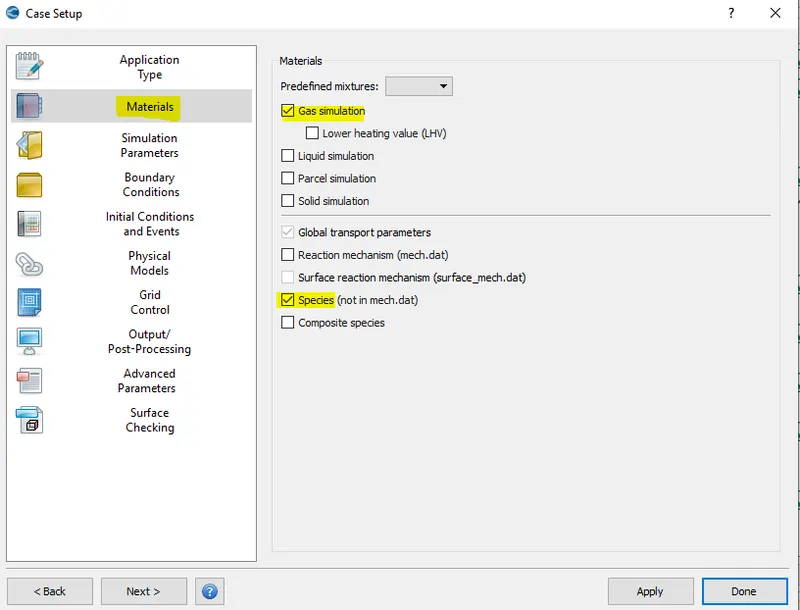
Fig.6 Material selection
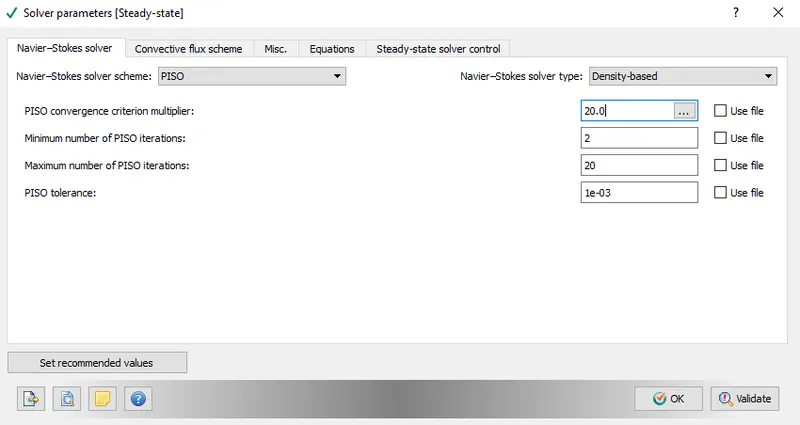
Fig.7 Solver parameter set up
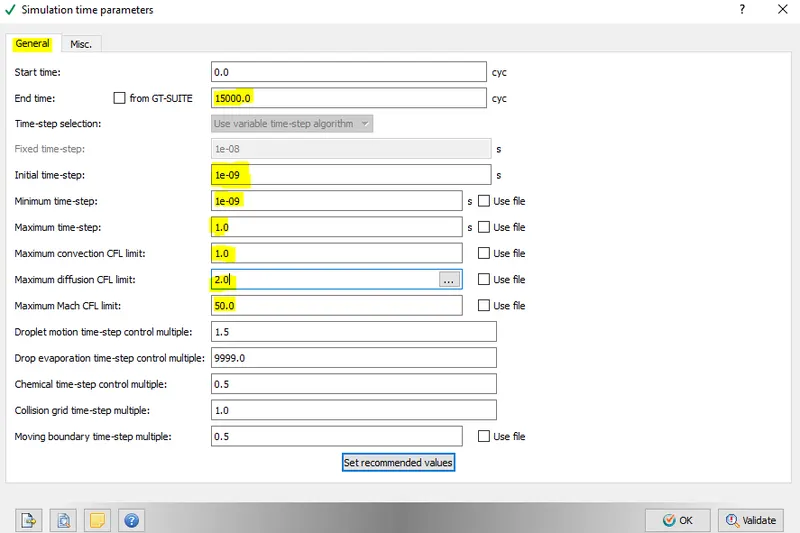
Fig.8 Simulation time parameter set up
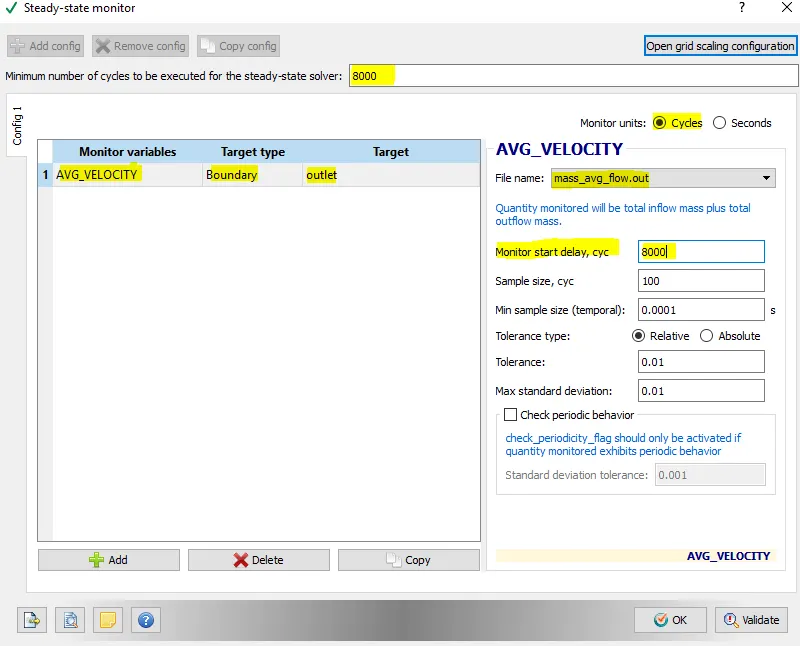
Fig.9 Steady state monitor
- Here the minimum number of cycles to be executed for steady state solver is set at 8000 cycles.
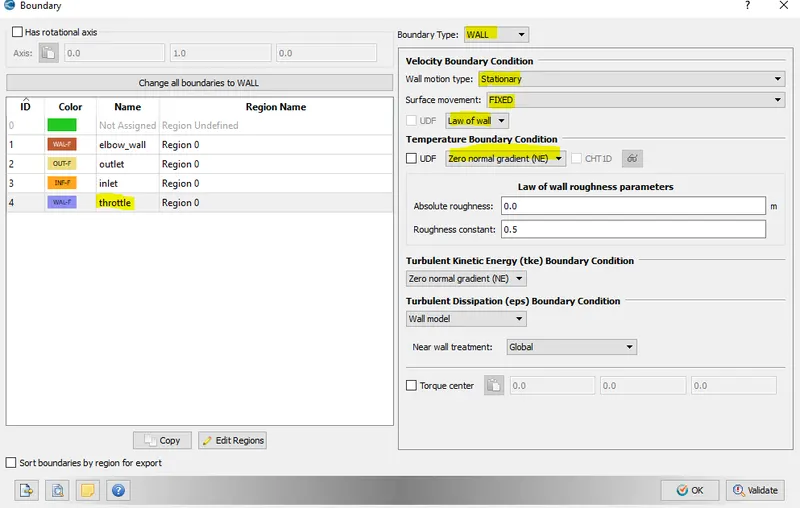
Fig.10 Throttle boundary condition
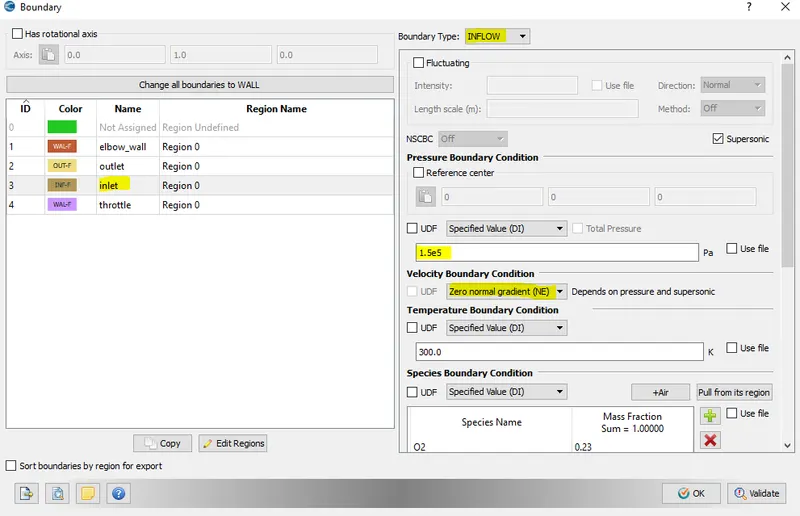
Fig.11 Inlet boundary condition
- The inlet pressure is set at 1.5 bar and at outlet is at 1 bar.
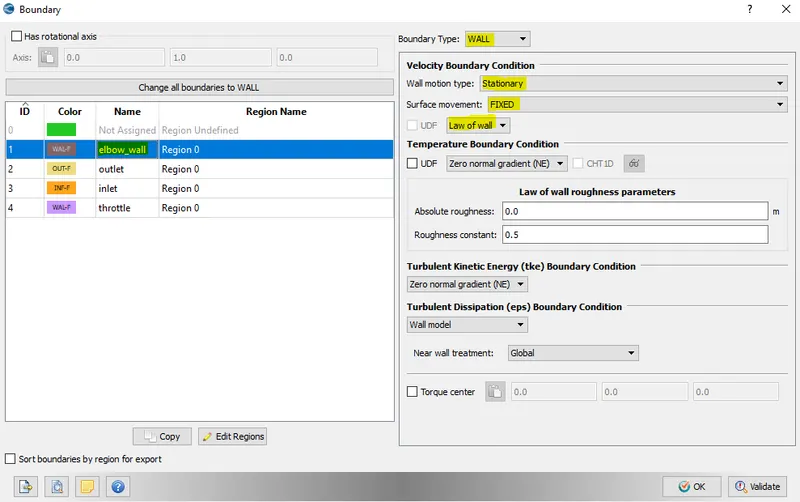
Fig.12 Elbow wall boundary set up
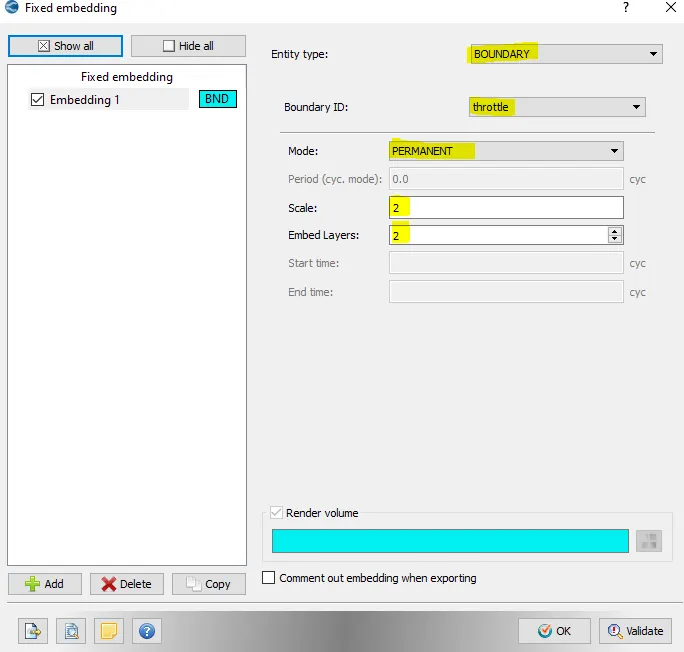
Fig.13 embedding ( local mesh refinement)
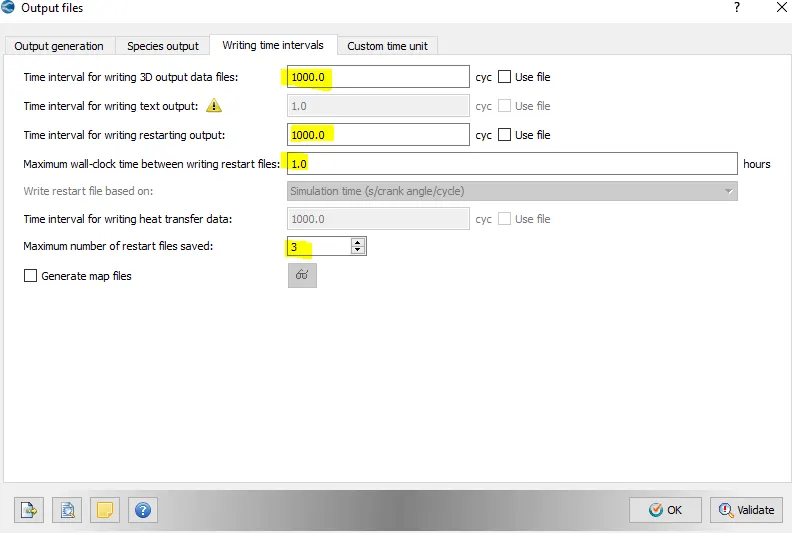
Fig.14 writing time interval (output files) set up
RESULTS
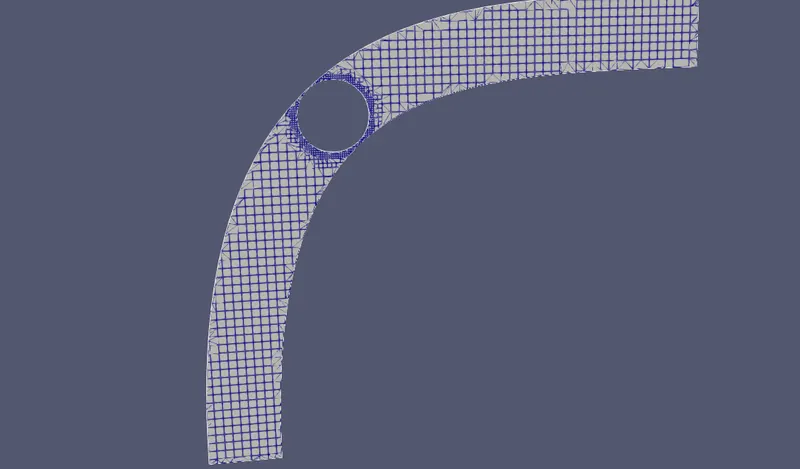
Fig.15 mesh( size of 2mm)
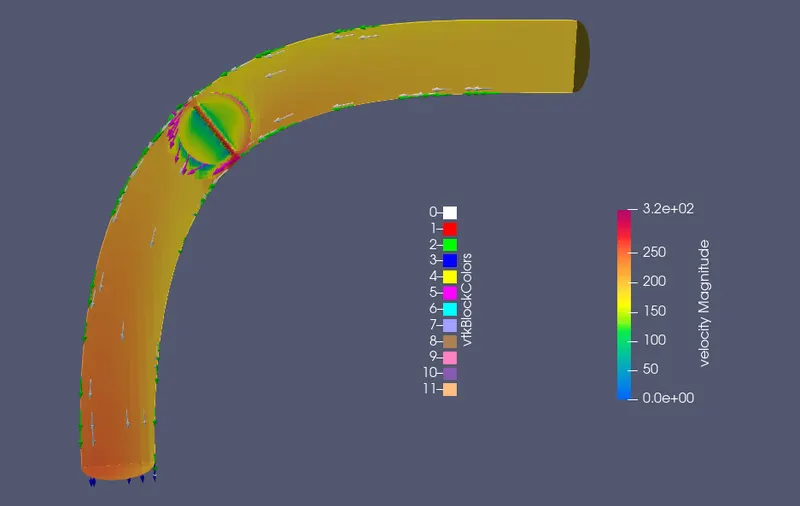
Fig.16 Velocity Contour
- As shown in fig. the magnitude of velocity is increasing towards the downstream and it is maximum at throttle.The results seem to be practical ,as the area available at throttle part is minimum.So velocity increases at that point.
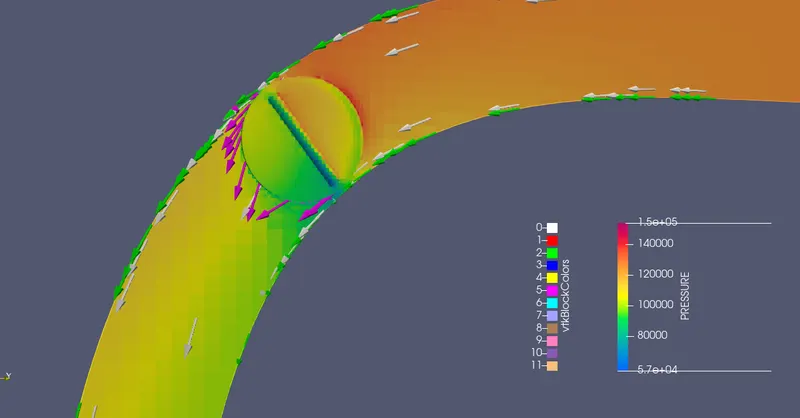
Fig.17 Pressure Contour
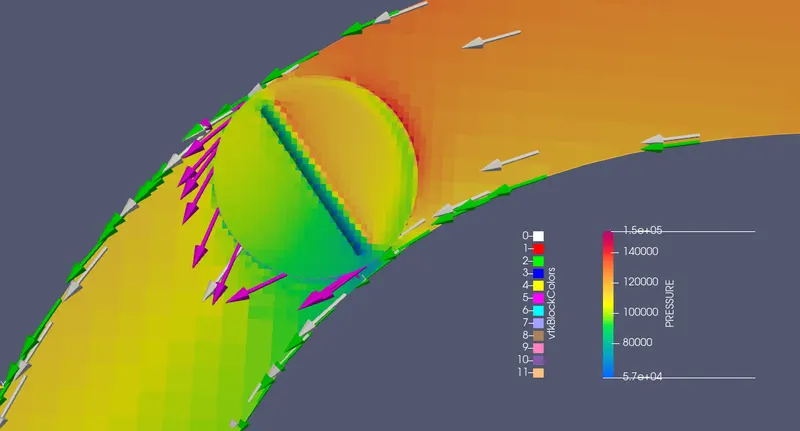
Fig.18 Pressure contour near valve
- At the downstream of valve ,there is low pressure region marked by green colour. This is due to flow separation occuring at this part.
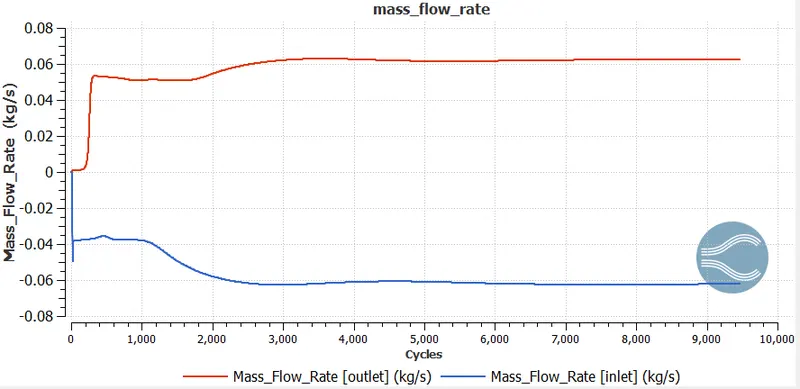
Fig.19 mass flow rate
- The mass flow rate is steady after 6000 cycles.There is deflection or fluctuation of mass flow rate at the throttle valve region.
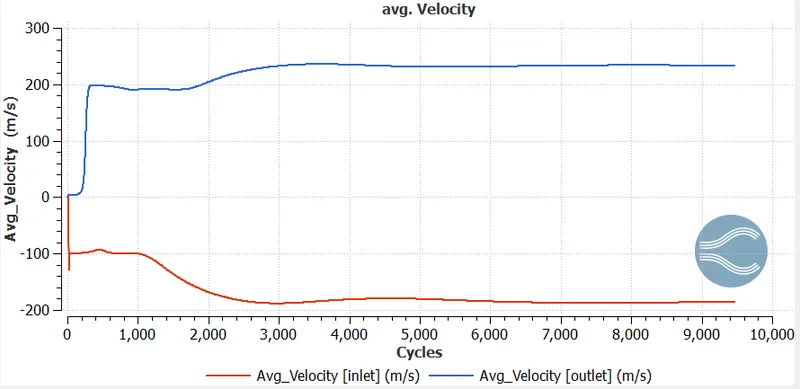
Fig.20 Average velocity plot
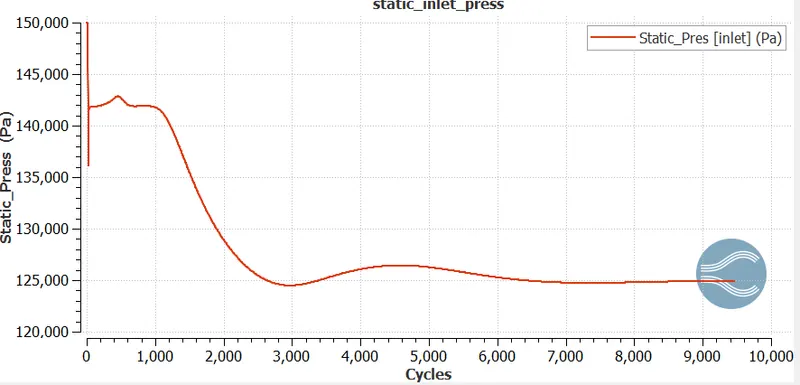
Fig.21 Static pressure at inlet
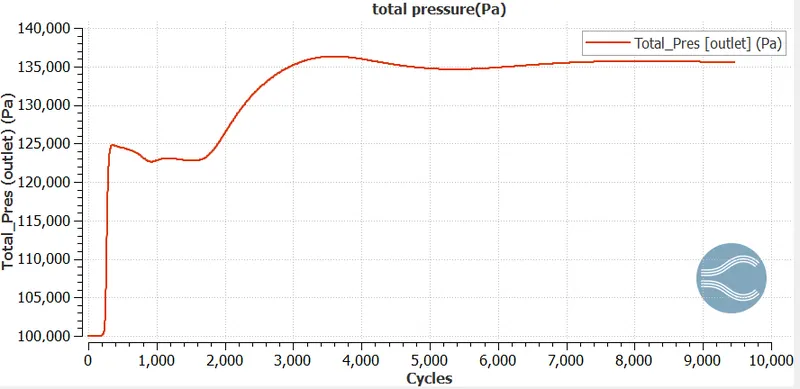
Fig.22 Total pressure at outlet
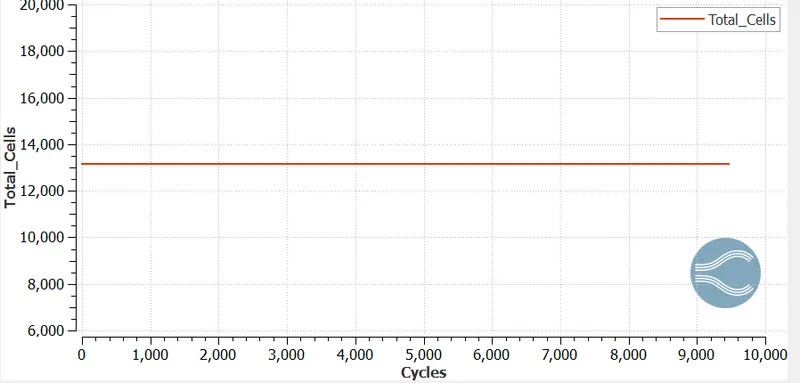
Fig.23 Total cell count
- Velocity contour animation
CONCLUSION
- In this set up ,the mass flow rate is decreasing at the throttle part and then remains constant.
- The velocity and pressure contour showing appropriate results.
- RNG turbulence model is used in the set up.
- Embedding is done to refine the mesh near the valve region to capture better flow physics.