Week 4.1 - Genetic Algorithm
# Gnetic Algorithm
AIM: to study about the genetic algorithm and to calculate the global maxima of stalagmite function GA algorithnm in matlab.
Objectives:
1)Introduction of GA and stalagmites
2)Explaining the Syntax used for GA
3)Code for GA and outputs
4)Code explanation
5)Errors
1)Intoduction to GA
Gentic algorithm is also known as evalutionary algorithm.They demonstrate self-organization and adptation similar to the way that the fittest biological organism survive and reproduce.Like the Darwin's theory of evolution.
Genetic algorithm are a particular class of evalutionary algorithms that use techniques inspired by evalutionary biology such as inheritance ,mutation, selection,and crossover(recombination).
Need of GA-Most optimization problems in real world involve complex conditions like discrete,continuos or mixed variables.the existing methods are not sufficient and efficient as GA and also much expensive to solve such a problems.
Biological background-Every organism has set of rules or a blue prints , describing how that organism is built up from the tiny building blocks of life.This rules are encoded in the genes of an organism.,which conected by long string called chromosomes . Each gene represent the specific featuresof a organism,like eye color,baldness.these gens and there settings are called as genotype.the physical expression of genotype i. e. the organism itself called as phenotype.
Key terms of Genetic Algorithm- are as follows
-Indivisuals-Any posible solution
- Population-Group of indivisuals
-Search space-All posible solutions to th problem
-Trait-Posible aspects of indivisuals
-Allele-posible settings for trait
-Locus-The position of the gene on chromosomes
-Genome-Colection of cromosomes for indivisuals
-Crossover-It is the process in which two chromosomes combines their genetic material to produce a new offsrings which posseses both their characteristics
#2).Working of genetic algorithm
Apopulation is created with the group of indivisuals ccreated randomly.the larger the population ,the smaller the no of generations neede to have a good chance of finding the optimum.
An indivisual consist of a genottype and a fitness function.Fitness represents the quality of the solution.
After the initial population is randomly generated ,the algorithm envolves the through three operations:
1.selection which equates tho survival of fitness
2.crossover which represent mating between indivisuals;
3.mutation which introduces random modifications.
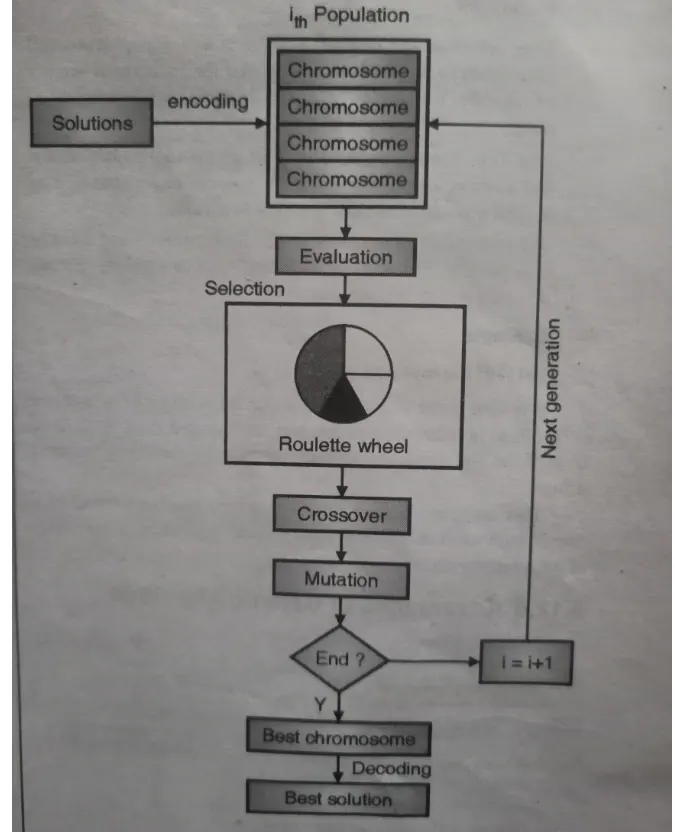
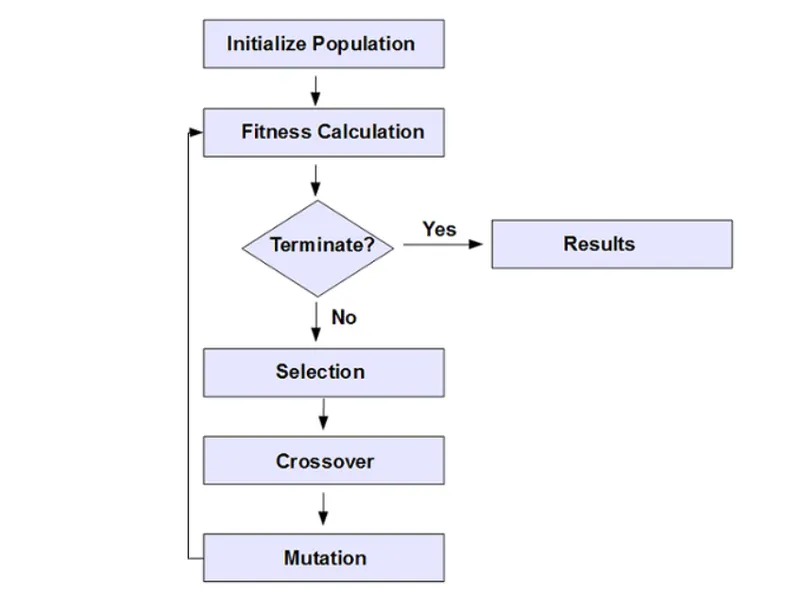
working of ga is as shown in figure 1 and figure2
genetic algorithm is done in following three steps as follows
1.selection:A number of indivisuals are selected from the population in the mating pool.Based on the previously calculated fitness value ,the best indivisuals based on thresold are selected.After that step,wewill end selecting a subset of the population in the mating pool.
2.crossover:These indivisuals then'reproduce'to create one or moere offsprings.the most common solution is some time called as crossover.In sigal point crossover the children taking the one section of cromosomes from each parents and here onlh one crossover point exist.the probability of this crossover is 60%-90%
3.Mutation:After the selection and crossover ,thre is a new population full of indivisuals.the probability of mutation is 1-2 tenth of a pecentage.
#3) stalagmite function :
Stalagmite function is the mathematical model which heps to generate local minima and maxima.It is tree dimensinal function with lot of local maxima and minima and one global maxima or minima.stlagmite and stalactites are as shown in figure,
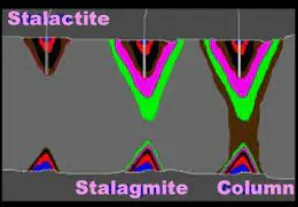
-Stalactites are structures formed from mineral deposites that hang from caves.These formation s hold tightly to the ceilling and hang down.As oppposed to hanging from ceilling
- Stalagmite sructures are formed from the cave floor that point upward.Stalgmite and Stalactites function which represents the shapes similar to the stalagmite and stalactite functions.
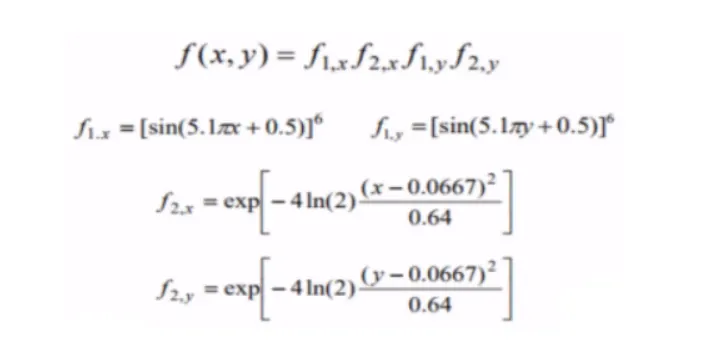
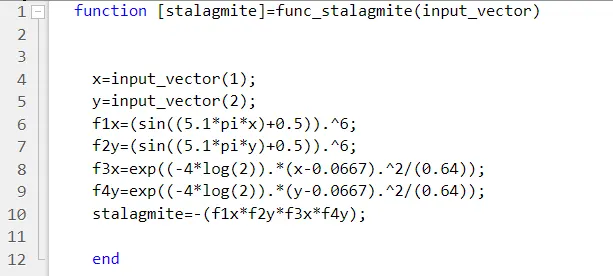
-This is the stalgmite function for getting the minimum value of GA.Bt in assignment we have to calculate the maximum ga value so that wwe have to change the sign of our function to minus(-).After that we get the result that we want.
#4) syntax of GA in matlab
x=ga(fun,nvars)
x=ga(fun,nvars,A,b)
x=ga(fun,nvars,A,b,Aeq,beq)
x=ga(fun,nvars,A,b,Aeq,beq,lb,ub)
x=ga(fun,nvars,A,b,Aeq,beq,lb,ub,nonlcon)
x=ga(fun,nvars,A,b,Aeq,beq,lb,ub,nonlcon,options)
x=ga(fun,nvars,A,b,[],[],lb,ub,nonlcon,options)
x=ga(fun,nvars,A,b,[],[],lb,ub,nonlcon,IntCon)
x=ga(fun,nvars,A,b,[],[],lb,ub,nonlcon,IntCon,options)
where,
func=function name,
nvars=number of variables
A=Linear equality constaints as real matrix
B=Linear inequality constraints as real vetcor
Aeq=Linear equality constraints as real matrix
Beq=linear equality constains as real vector
lb=lower boundary
ub=upper boundary
nonlcon=nonlinear consraints
options=creating optimizatin option using 'optimoptions'
[]=If there are no inequalities and inequalities and non linear constaints and integer values,then A,B,Aeq,Beq and nonlcon and IntCon are set to'[]'
#5) code:
study1:
study2:
study3:
# stalagmite function:
#6)otputs of GA:
output1: for study 1:statical behavior
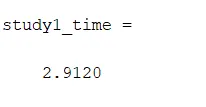
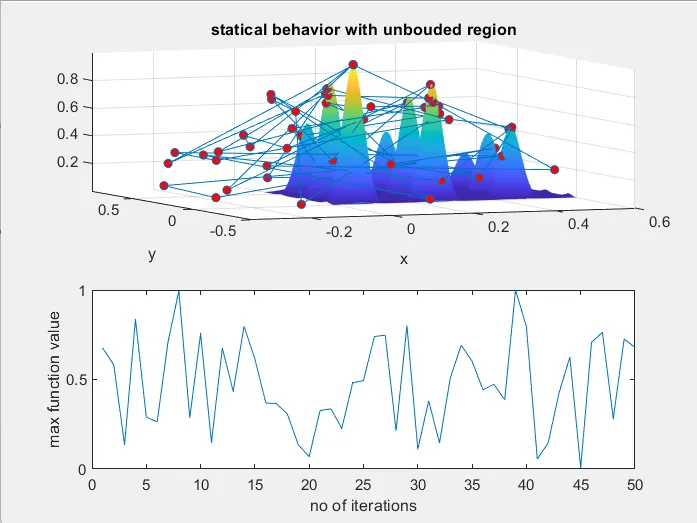
In the above plot ,it can be observed that how the random sampling of GA generates the new optimum value for function every time the code runs.here we can see that the large no of red dots which shows the x and y values each time iteration runs.
output2: from study 2:statical behavior with upper and lower boundary
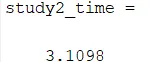
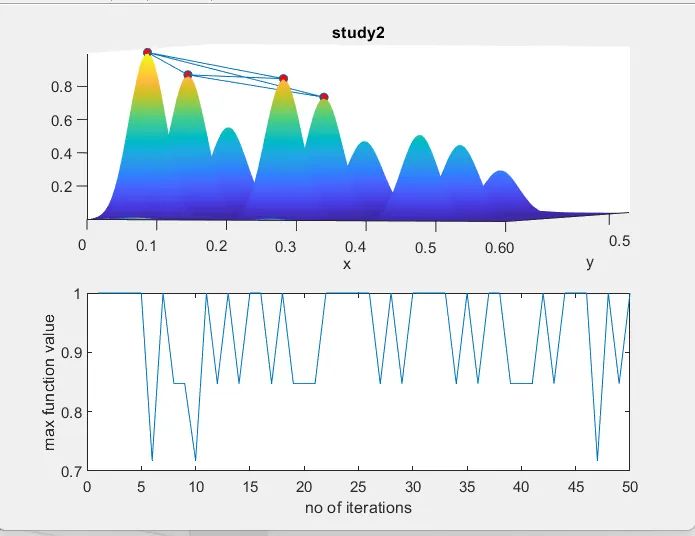
above figure shows the study 2, in which the no of red dits are just minimum as compared to the previous plot.this happens becaouse the boundaries provided for function.
Output3: by study 3:staical behavior with increasing behavior of GA
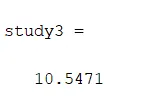
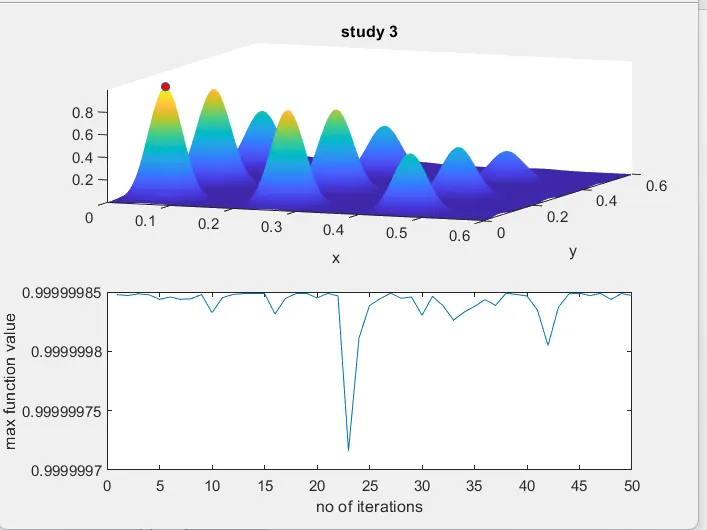
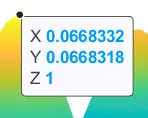
In this study we are actually get the global maxima.here the no of iteretions are 300 to converge and find the global maxima.Here we see only one dot on the stalagmite i.e global maxima.after roatating we clearly find the point.as shown above.
#code explanation:
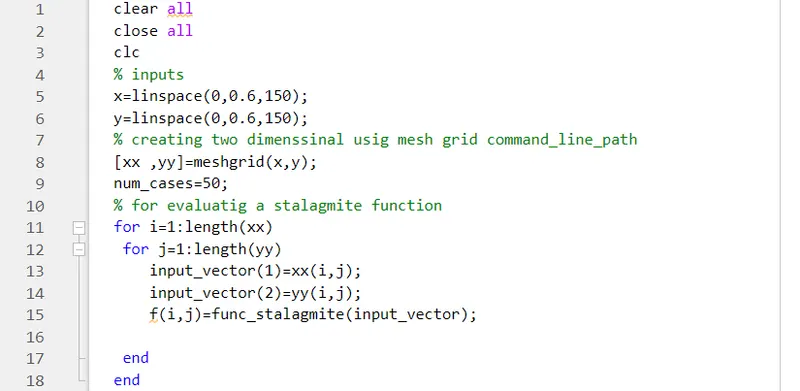
-Code start with clear all, close all and clc
-clear all-used to clear the stored in work space
-close all-is used for close the all plots and commands
-clc-used for clear the command window.
-Then the 'x'array and 'y' arrays is defined using the linspace command to create 150 equal intervals.
-Meshgrid command ois used to make the 2D array.
-for limiting the no of iterations or case the num_cases= 50 is introduce.
-to evaluate the stalagmite function the for loop is used ,where the 'i ' is used to give the all value for' xx' and 'j' ifs for' yy'
-the input vector defines the all values of xx and yy.
-then stalagmite function for these inputs is defined.this is the basic stalagmite function.we can draw it for practice but not for the challenge.
-from this step we are just preparing inputs for our further three cases or studies on genetic algorithm.
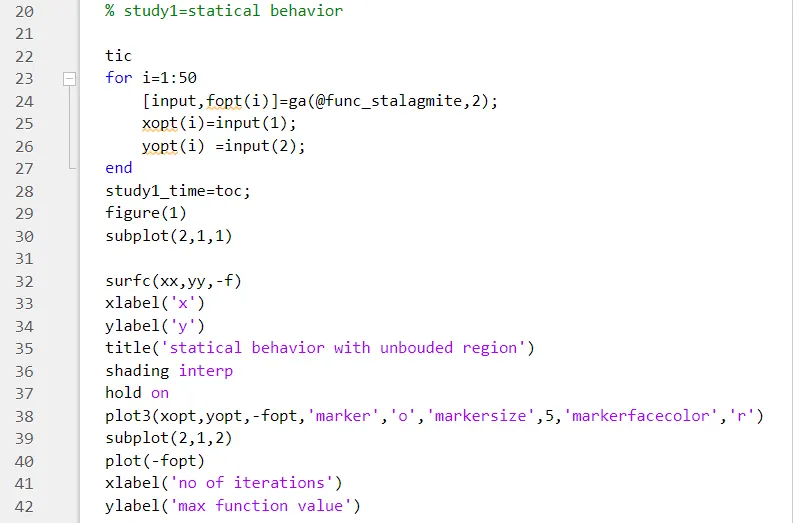
-for study 1 the maximum value of function is found out with no resrictions,no bounds and no limits.here we using the GA fuction in for loop for providing the inputs and optimum value.for that we call the stalagmite function in GA syntax and no of variables are 2.
-for getting the time required for performing the loops for 50 iterations is calculated by tic and toc cammand. this command is used before and after loop respectively.
-then the function created by loop is plotted with the help of surfc command for xx,yy and the fuction output(-f)
- for obtaining the smooth and clean plot use the shading interp for avoiding the grid lines.
-subplot is used for generating the multiple plots in one figure.subplot(2,1,1) means figure devided into 2by1 and the axis to be placed at 1.
-plot3 command is used ton plot the points on 3D figure, at xopt,yopt and optimum value of function with 'o' shape and 'r ' color.The labels and the titles are then provided.now in same figure the value of optimum function is calculated for 50 iterations.
-the result of the above case is different for each time we run the code.for getting the same value each and every time ,we need to restrict the program within specific bound namely as lower boundary(lb)and upper boundary(ub).
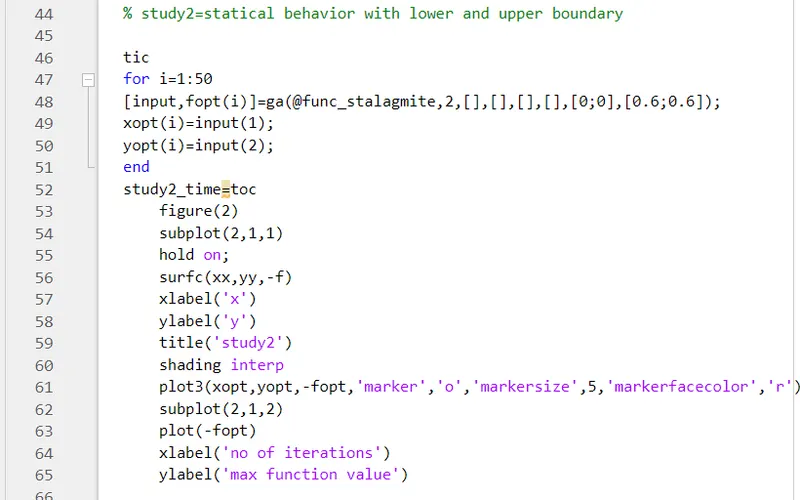
-for each study the procedure for coding and plotting is same.The only difference is in GA syntax
-for study 2 the lb and ub is provide as [0,0] and [0.6;0.6] respectively.
-after ploting we see that still the result is different for each case. hence we have to do change in the no of iterations means we have to increase the num_case value.
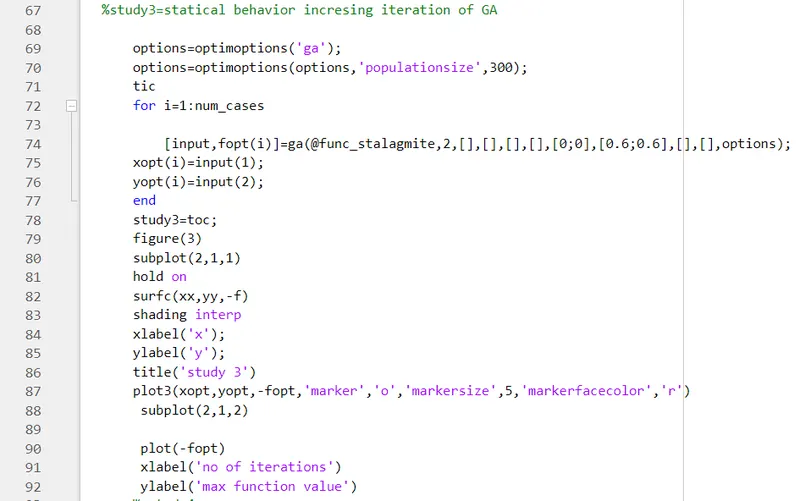
-So far study 3 we are going to increase the the no of iterations to 300.
- the syntax''options = optimoptions('solver name','name','value') ''which returns the options with specified parameters i e 300 values.
-the syntax for GA contains the 'option' and the rest of the code is same as study 1 and sudy 2.
#Errors
1.With shading interp as
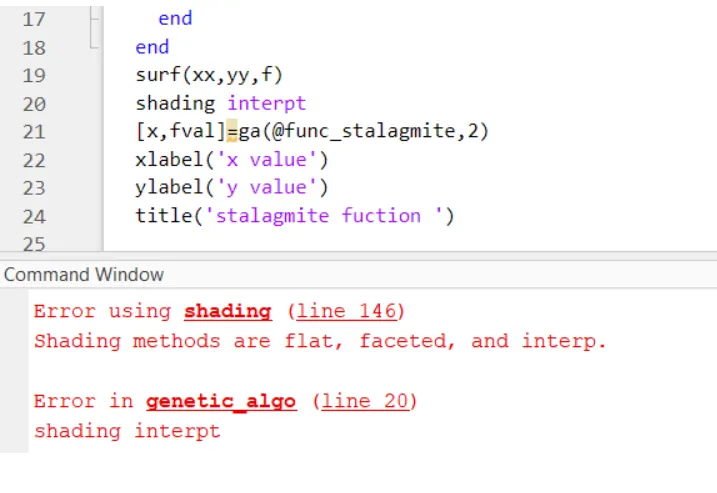
2.Also some in function name and something minor which i solved it myself.
# References
1.https://www.britannica.com/science/stalactite
2.https://in.mathworks.com/help/gads/ga.html
3.https://en.wikipedia.org/wiki/Genetic_algorithm
4.Book of numerical methods and optimizaton by Dr.A.B.Auti