Project 1 - Parsing NASA thermodynamic data
File parsing of NASA Thermodynamic data from THERMO.dat file.
#.objectives:
1.To write a matlab code to extract the dat from the THERMO.dat file .
2.Calculate and plot the Cp,S and H for all the gas species for the entire range of there local temperatures(T_min to T_max).
3.Calculate thge molecular weight of species and display on command window.
4.Save the plots for each species and save them in a different folder.
5.Also attach the plots for O2,N2 and Co2.
#.Introduction:
Parsing:
Parsing a file means reading in adata sream and building a memory of the content of that data.This aims at faciliating performing some kind of transformation on the data.Parsing soplits a file or other input into pieces of data that can be easily stored or manipulated.
The input parser provides a consistent way to validate and assign defaults to inputs,improving the robustness and maitainability of your code
Parse essentially means to "resolve into its components parts and describe their syntactic role".File parsing in computer language means to give a meaning to the characters of text file as per the formal grammar.
Parsing is the process of analizing a string of symbols ,either in natural language ,computer language or dat srtucture ,conferming the role of the formal grammer.
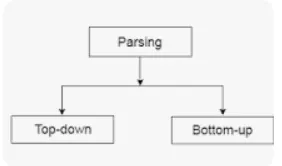
Parser is the compiler that breaks the data into smaller elements coming from lexical anlysis phase.A parser takes inputs in the form of sequence of tokens and produce outputs in the form of parse tree.Parsing is of two types: 1.top down parsing ,
2. bottom up parsing
File writting:
It refers to the process of writting data to a perticular file.
Syntax: f1=fopen('file_name.txt','w')
where,w=writing mode
f1=pointer to yhe file which we can write data to the file.
Note:
- f1 gives the some values which doesnot matters but should not be -ve
- we use fclose(f1) to close the file.
1)File printf command is used to write inside a file.
Syntax:fprintf(f1,'hello,how are you')
2)for adding float value point number syntax used is
syntax:fprintf(f1,'%f',2.15)or fprintf(f1,'%f %f',2.1,2.5)
3)adding a new line
syntax:fprintf(f1,"\n")
4)adding header to the file
syntax:fprintf(f1,'%16s,%16s',"time",'pressure')
where,16=character spaces before time and
%s=string format specifier
5)adding decimal no places
syntax:fprintf(f1,'%16f %16f\n',var1,var2)
where,f=floating point no
var=variable
File reading :
It is the process of reading the data from a perticular file.
Syntax:f1=fopen('file_name.txt','r')
where,
r=reading mode
f1=is the pointer to the file with which we can read data to the file
note:
- f1 gives some values which does not matters but should not be -ve.
- we can use fclose(f1) to close the file.
1)fgetl()command is used to get the content of file line by lkine.If we use the the fgetl() command first time then is gives the first line.
syntax:line_1=fgetl(f1
2)Inn many cases we have to split data therefore we have to use strsplit() command
syntax:strplit(line,'')
where,'' is a delimter and A{} is contains the all type of data so called as cell array,
3)To convert string to number we using the str2num() command and for converting cell array we have to use str2num(a{1})
# Steps to extract the data from the file
- they are provided us THERMO.dat file of NASA.
- Our first step is to read the file for our calculations.
- for that use the" fopen(filename,'r')" .where r is to read the file .if we want to write a file then use the 'w'.
- hence we get access into the file by the above command.
- Now for get the first line i.e. THERMO as shown in dat file we have to use 'fgetl()' command.
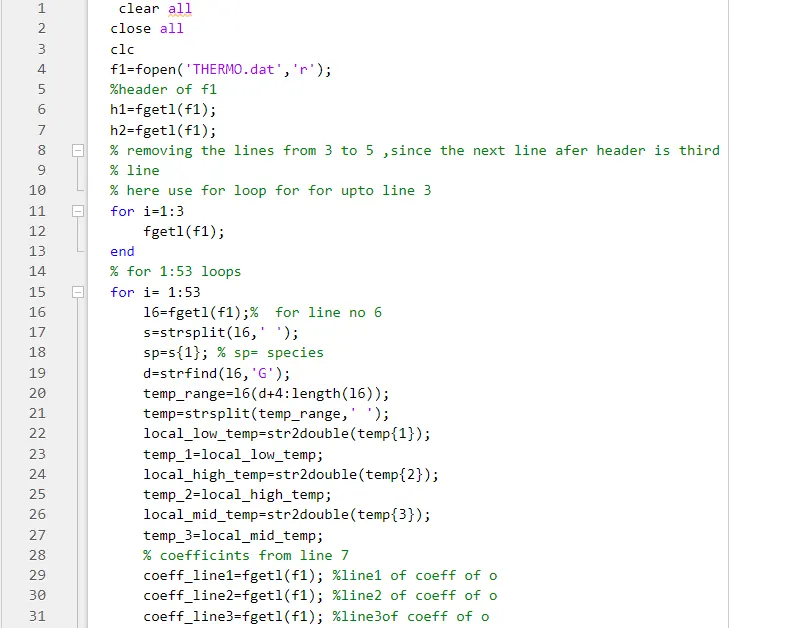
- But all the first 5 lines are useless for our calculations hence we have to ignore this lines by just calling fgetl command for each the line,here we can use the for loop for i=1:5
- Our main task strats from the line 6.here we want to assign the last three temp values which are local temperatures (low temp, high temp ,mid temp).we know there are 53 species so we have to use for loop for next 1:53 species
- after use of fgetl command for line 6 we going to use the strfind command for finding the 'G'.After that we give the location of three temperature values .
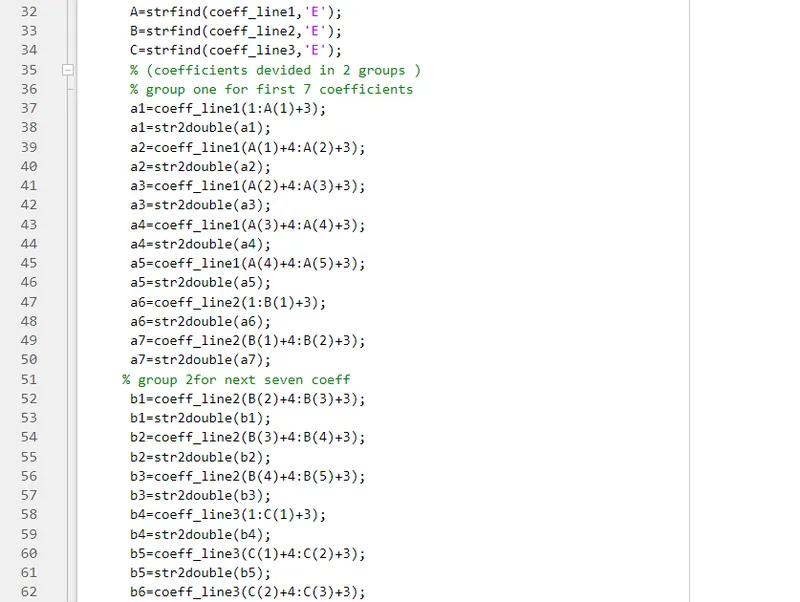
- We see that there are 14 coefficients for monoatomic oxigen and for every following species.So we are deviding that 14 coefficients into two parts .for that we giving the name for each row of coefficients as A,B,C.for that we are calculating 14 coefficients i.e. a1 to a7 and b1 to b7.
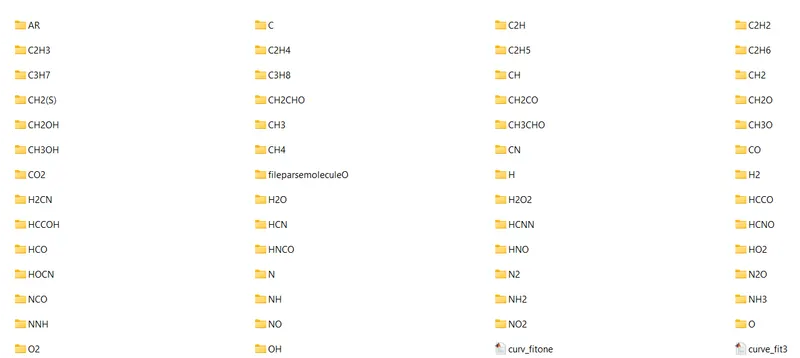
- We have 53 spacies for that we have to creare the 53 no of folders to store the data of each indivisual spacies.
- For that we have to use the 'mkdir(spacies_name)'for creating the folders in directory.
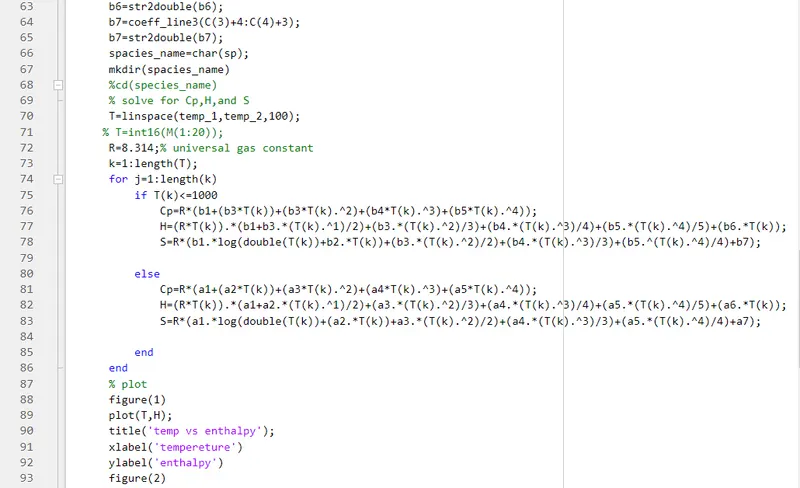
- Now we only two temp limits that is local max temperature and local min temp but we cant get the smoother graph by only this two points.so we have to create the multiple points between these two temperature limits.So that we are using linspace command for making equal intervals of temp.
- now here we have to create the loop for calculating the Cp,H,S at diifferent temp limits .So we have to define the for loop for total legth of temperature.
- Also we want some constants to calculate the Cp,H and S that is universal gas constant(R).
- We know that the local mid temperature is 1000.so if the temperature is less than 1000 we called it as min temperature and we are going to use 'b' coefficient .Else the temp is more than the 1000 then we got the max temp.
- Now our task of plotting the temperature vs Cp/H/S.we are going to use plot command with proper title and lebels.
- now we have to save that graphs somewhere ,so that we are using cd(spacies_name).Also we have to save that files in jpg format.so we are using saveas command .
- Our last task or challange is to create the molecular _weight function for calculating the weight of each spacies.
#code
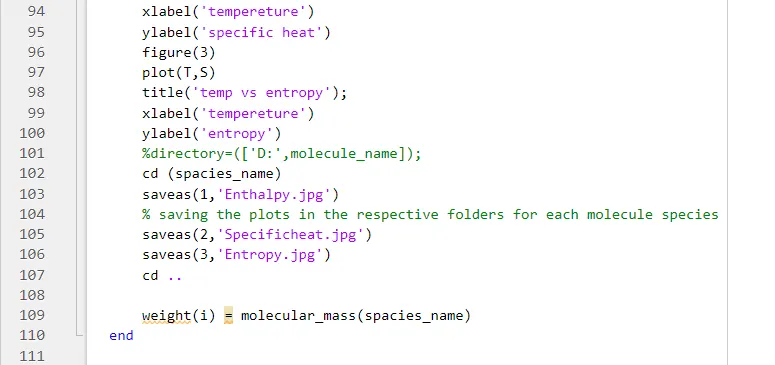
#code function
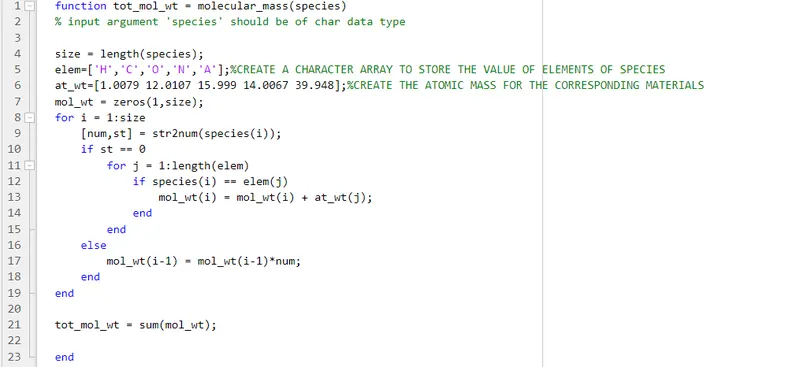
from above function the calculations for the molecular wt is done.the different types of elements for which we have to calculate the weight are stoared in array.
#code output
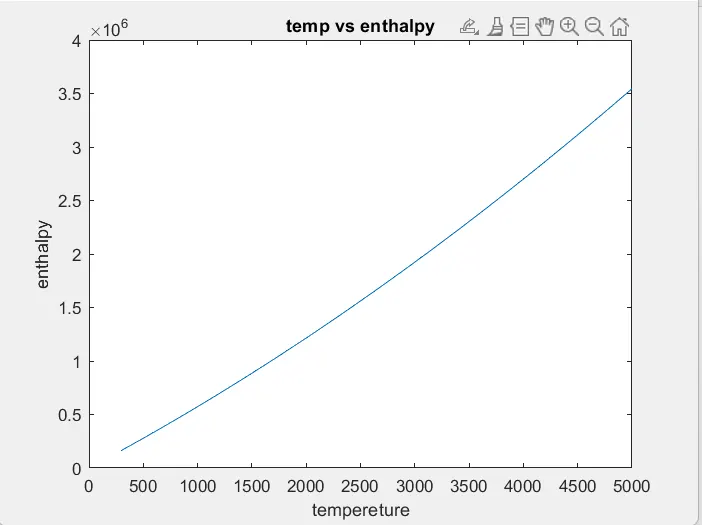
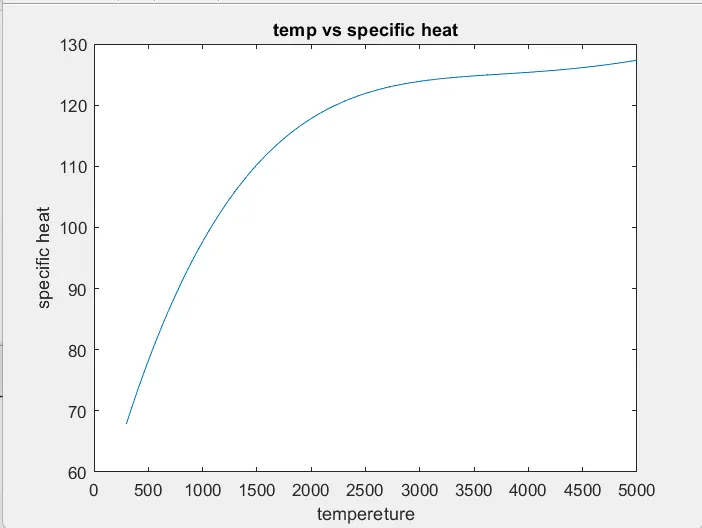
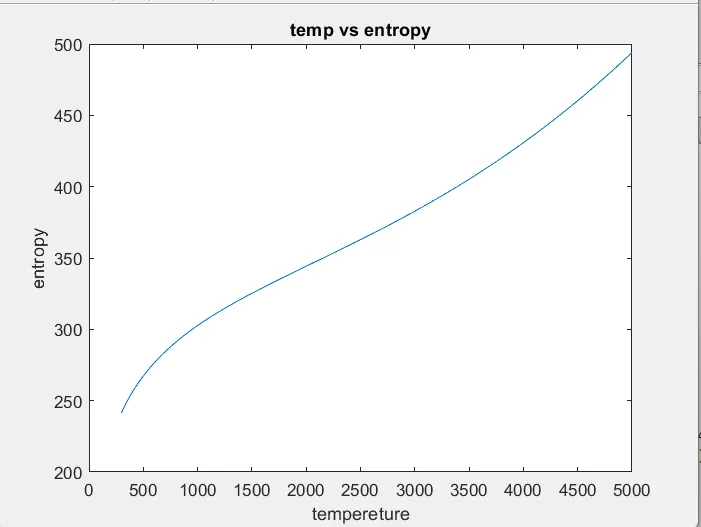
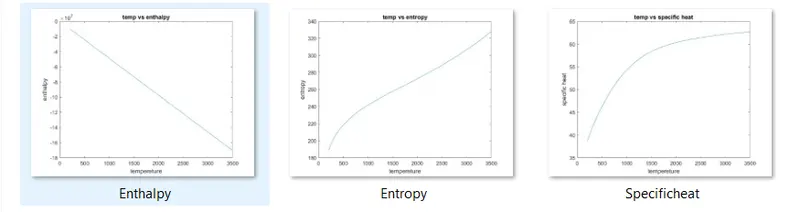
output plots for O2
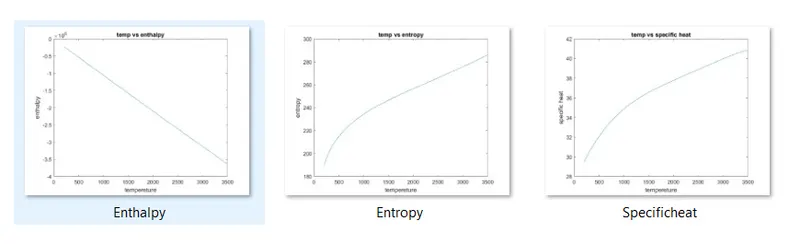
output plots for H2
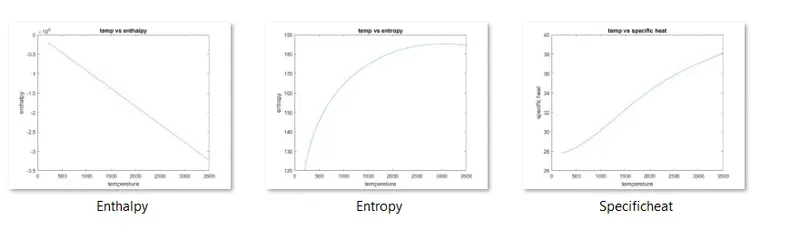
output plots for N2
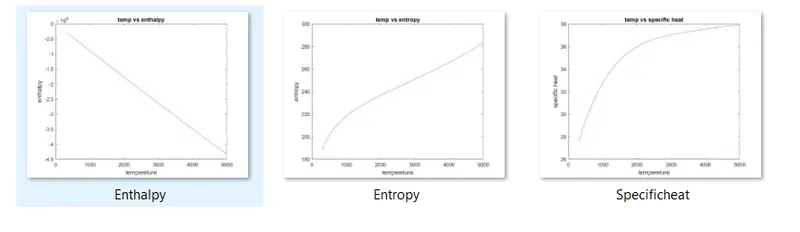
output plots of Co2
#location of folders

#Errors
1.All the errors i got just in 'mkdir ' command while stoaring the data.I got help from support enginner to solve this error
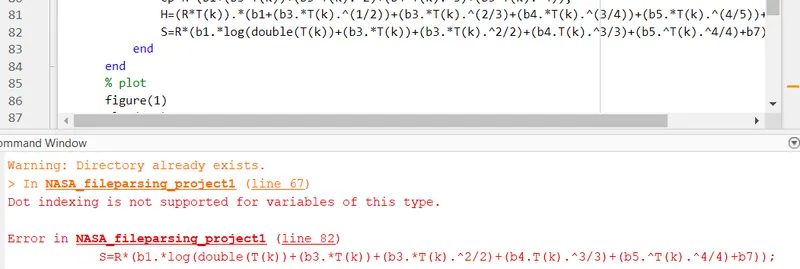
a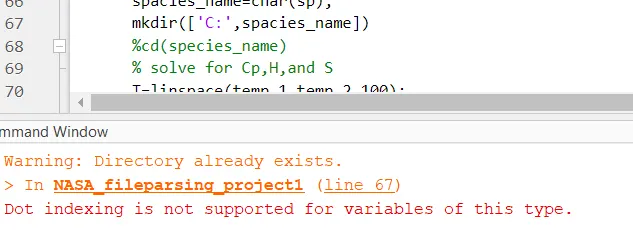
2.here i forget to * multiply the b4 with T(k) .this error i solved by myself.
# conclusion:
Hence all the properties for various elements are plotted to know their variation with temp.