Verification of Weld Joints using ANSYS Workbench
AIM: To verify weld joints using structural analysis in ANSYS Workbench.
PROCEDURE:
The given geometry with weld joints was imported into ANSYS and is shown below:
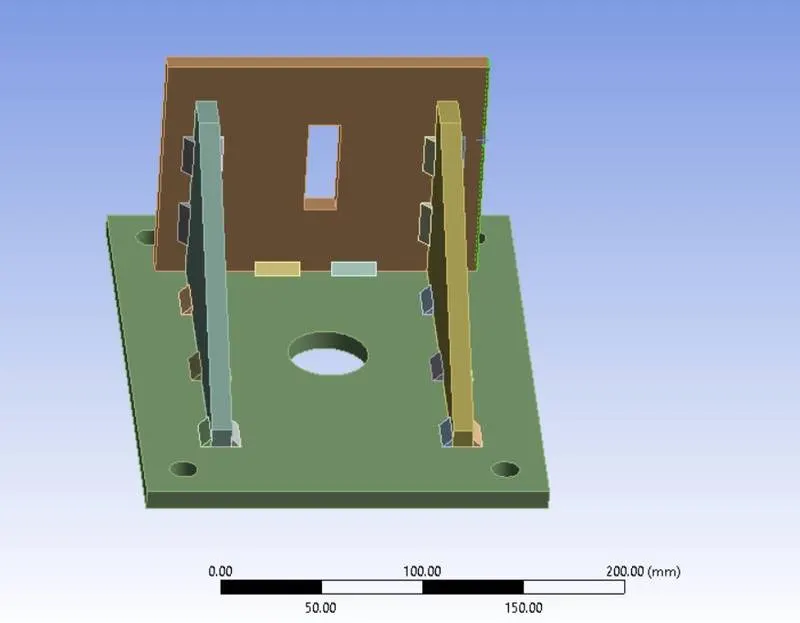
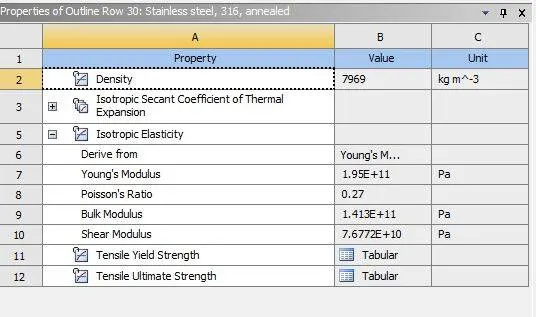
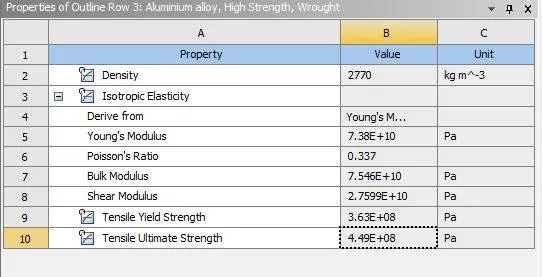
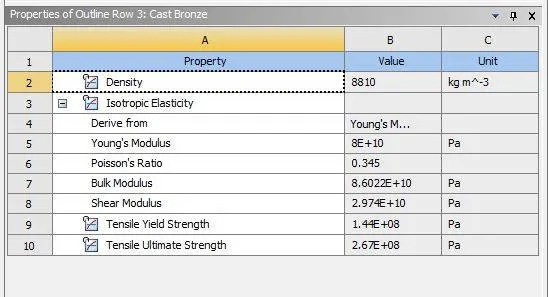
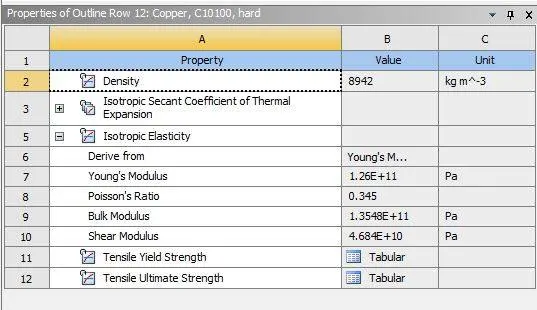
The geometry consists of two plates, two ribs and 20 welds. The materials used for this assignment are Aluminium, Bronze, Copper and Stainless Steel. Their mechanical properties are given below:
Stainless Steel:
Aluminium:
Bronze:
Copper:
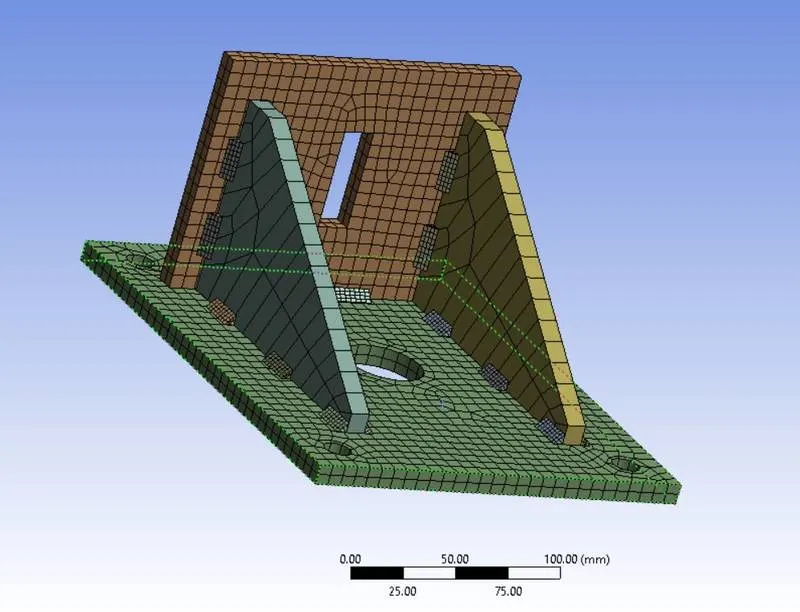
The plates were meshed with 7 mm elements whereas the rest of the geometry was meshed with default size. The mesh is given below:
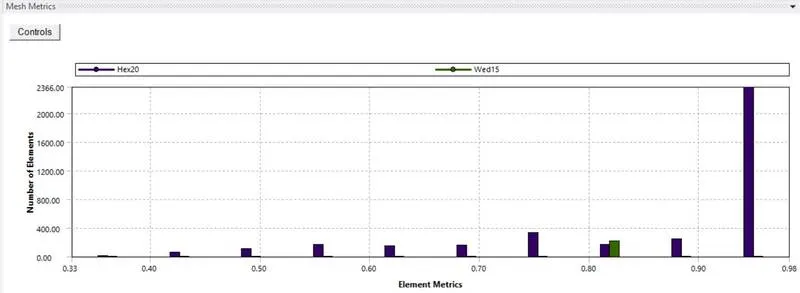
The mesh size distribution graph is given below:
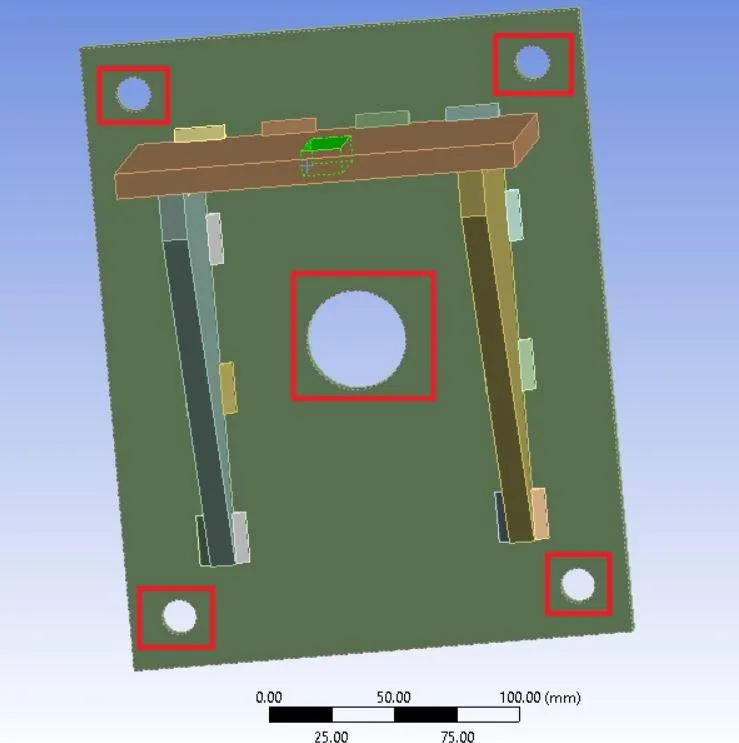
The holes indicated in the below figure were given fixed supports by going to Analysis Settings => Insert => Fixed Support:
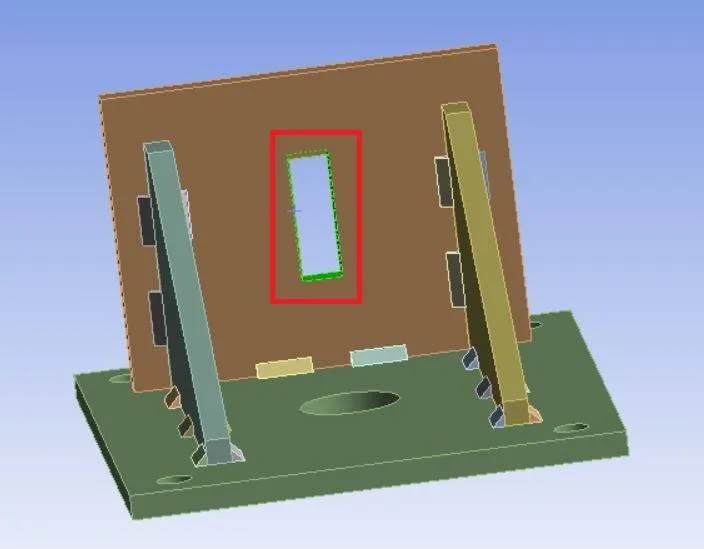
Force was applied on the rectangular hole in the smaller plate indicated below:
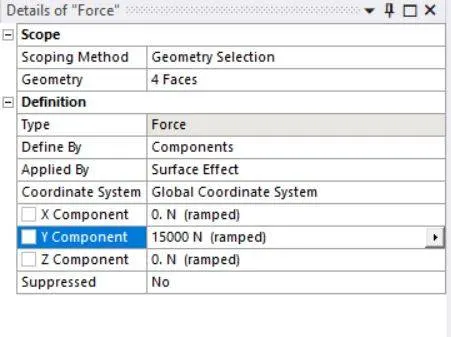
The y-component was given force of 15000 N as shown below:
Contact between the plates and the ribs were given as frictional with a coefficient of 0.2. The output blocks given were directional deformations, von-mises stress and von-mises strain.
Case 1: Weld Material = Stainless Steel, Plate Material = Stainless Steel, Rib Material = Stainless Steel:
All components were assigned Stainless Steel material. The simulation was solved in one step. The deformation contour in x-direction is given below:
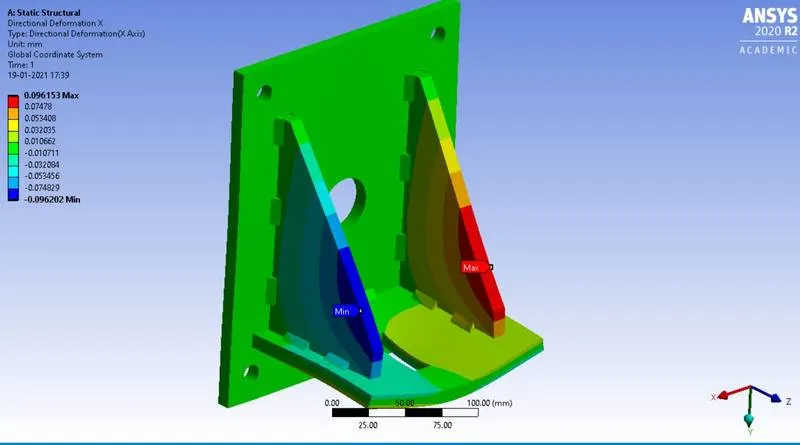
Maximum deformation is x-direction is 0.096 mm. The maximum deformation is at the ribs. The deformation contour in y-direction is given below:
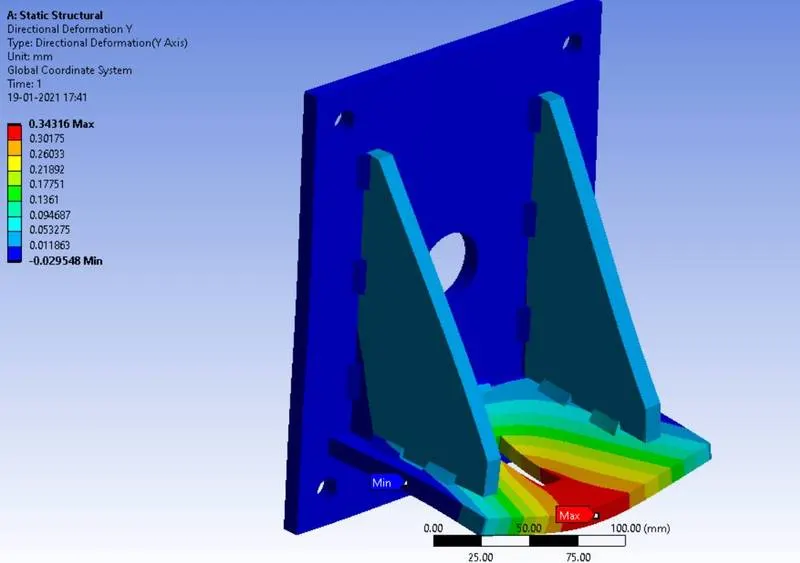
Maximum deformation in y-direction is at the small plate near the region where force is applied. Maximum deformation of 0.343 mm is seen. The Von-Mises stress contour is given below:
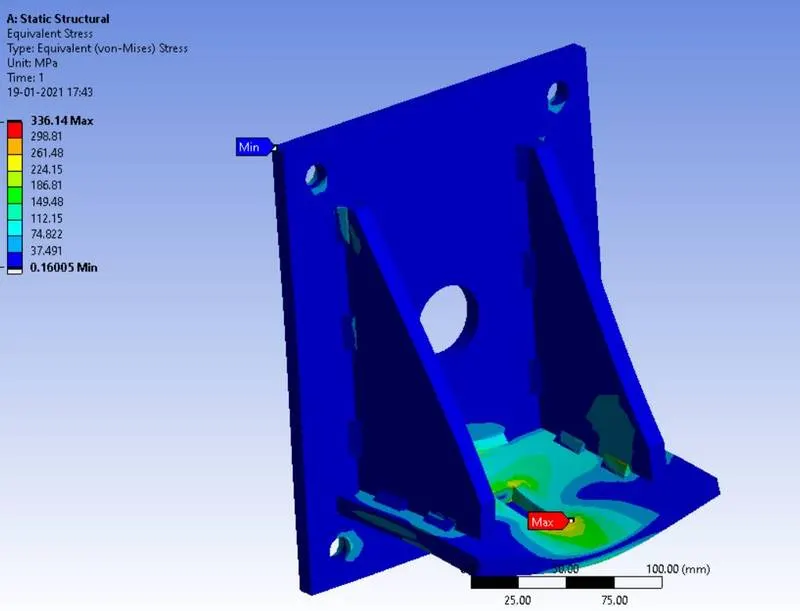
Maximum stress is seen near the hole where force is applied. The maximum stress magnitude is 336.14 MPa. The Von-Mises strain contour is given below:
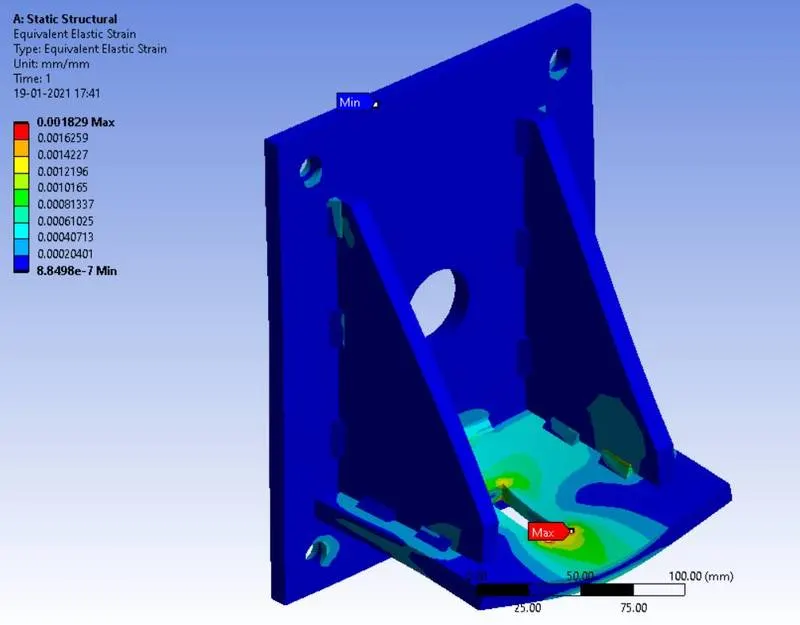
Maximum strain also appears near the hole where the force is applied. The magnitude of maximum strain is 0.001829. The maximum stress in welded regions is shown below:
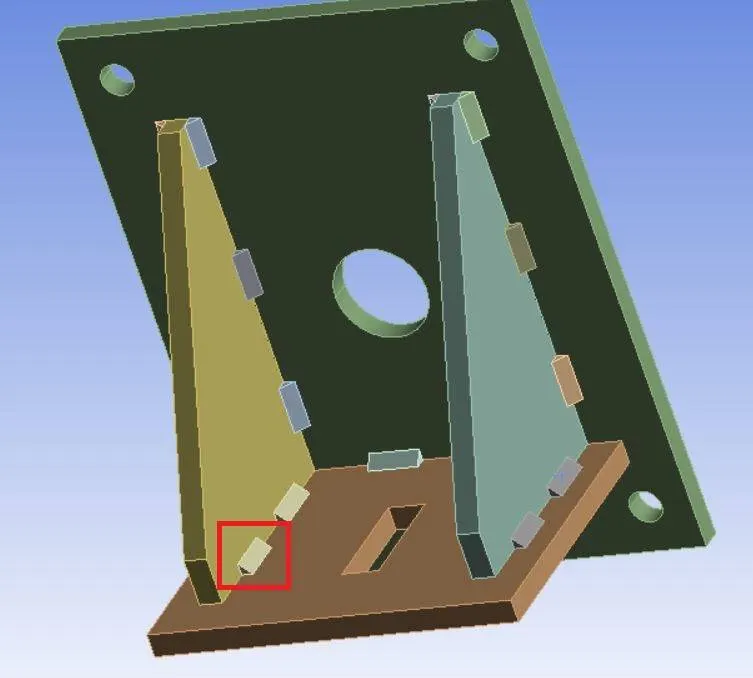
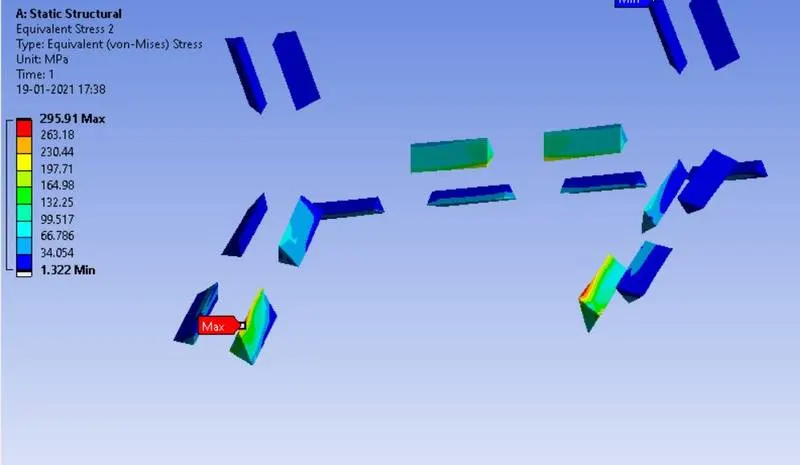
The weld marked in red has the highest stress value of 295.91 MPa as shown below in the stress contour:
Case 2: Weld Material = Aluminium, Plate and Rib Material = Stainless Steel:
The weld material was changed from Stainless steel to Aluminium. The simulation was solved in one step. The deformation contour in x-direction is given below:
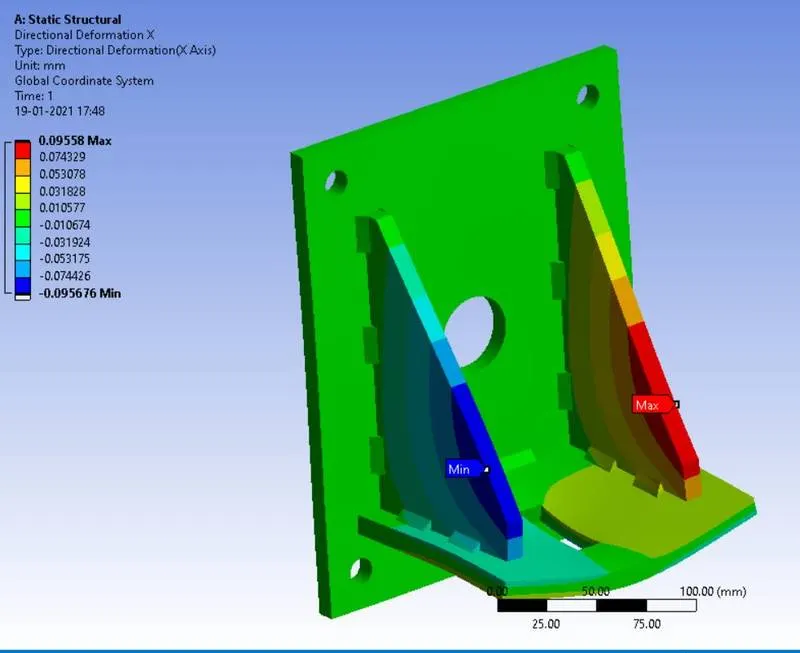
Maximum deformation in x-axis is 0.09558 mm and is seen in the ribs. The deformation contour in y-direction is given below:
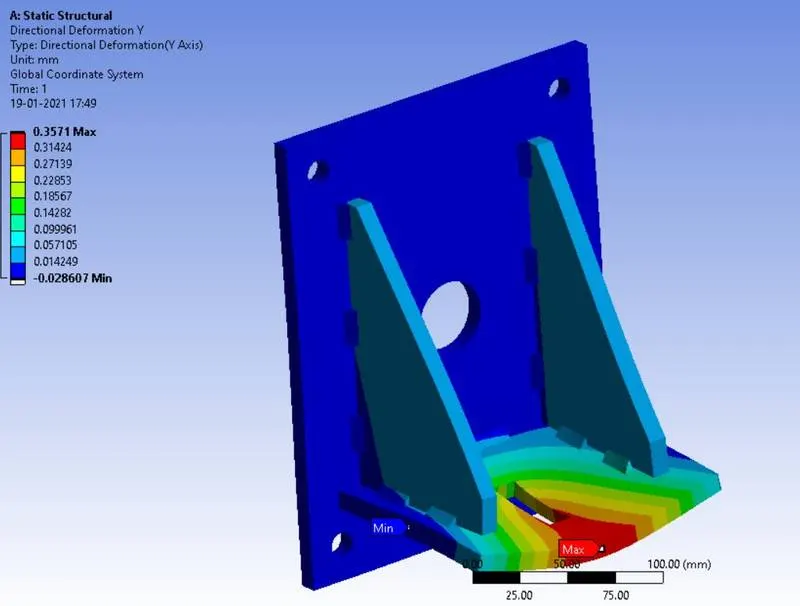
Maximum deformation in y-direction is seen near the hole where force is applied. The maximum deformation is 0.3571 mm. The Von-Mises stress contour is given below:
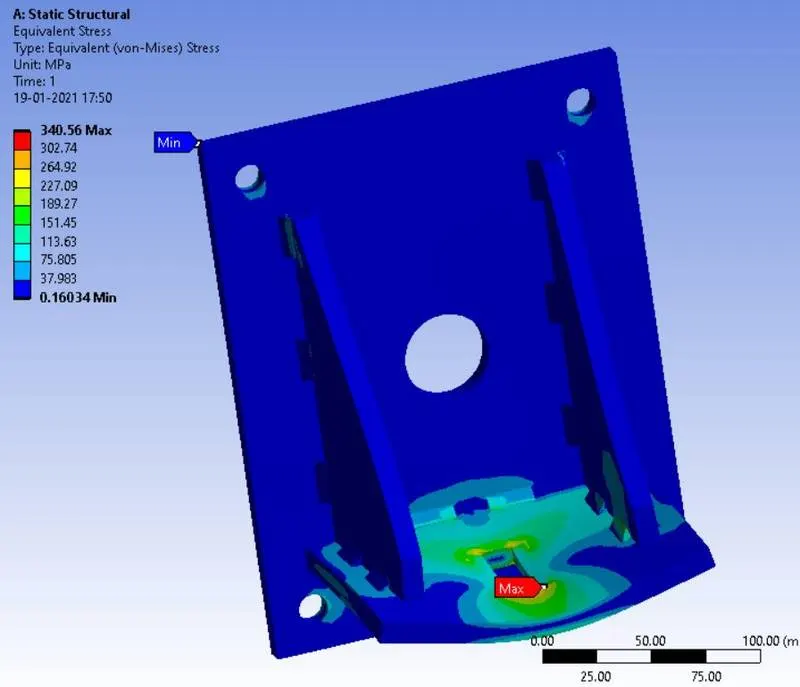
Maximum stress is observed near the hole where force is applied. Maximum stress value of 340.56 MPa is observed. The strain contour is given below:
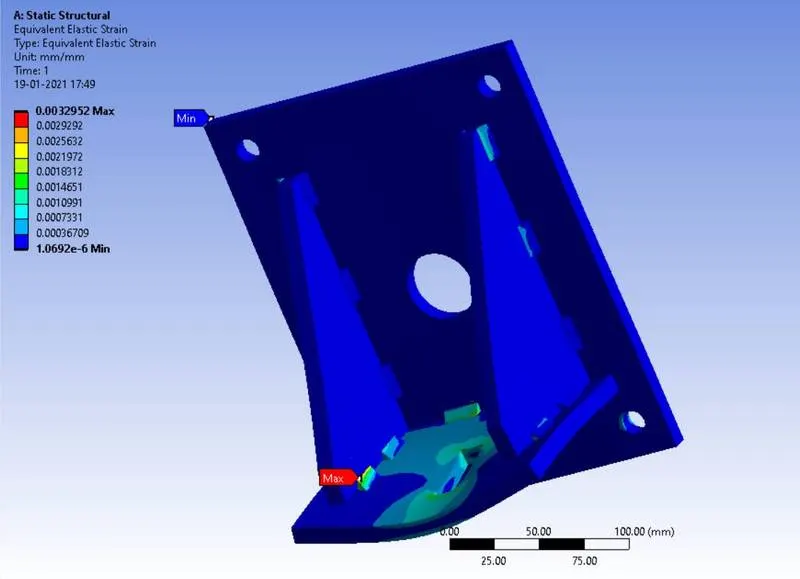
Maximum strain is seen at the welded region and has magnitude of 0.0032952. The stress at this weld spot is also maximum when compared to other weld regions as shown below in the stress contour:
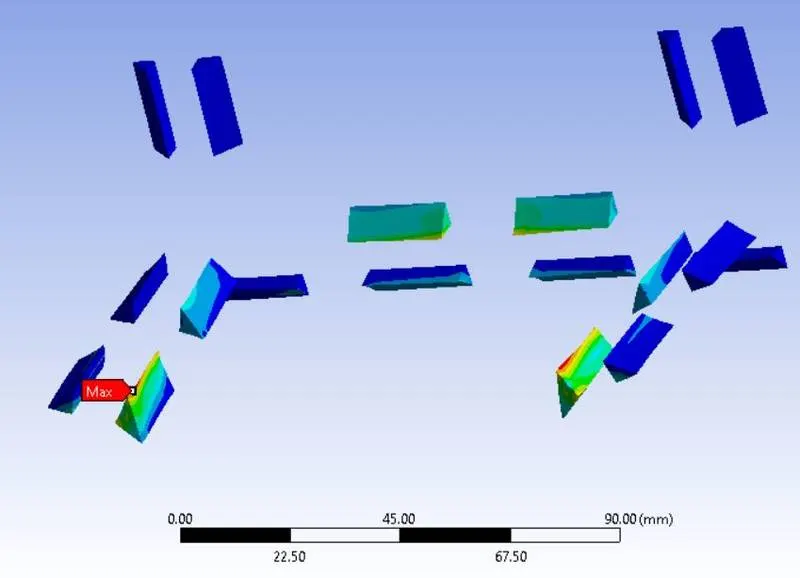
Maximum stress at that region is observed to be 242.97 MPa.
Case 3: Weld Material = Bronze, Plate Material = Stainless Steel, Rib Material = Copper:
The weld material was changed to Bronze and the ribs were changed to Copper. The deformation contour for this combination is given below for x-direction:
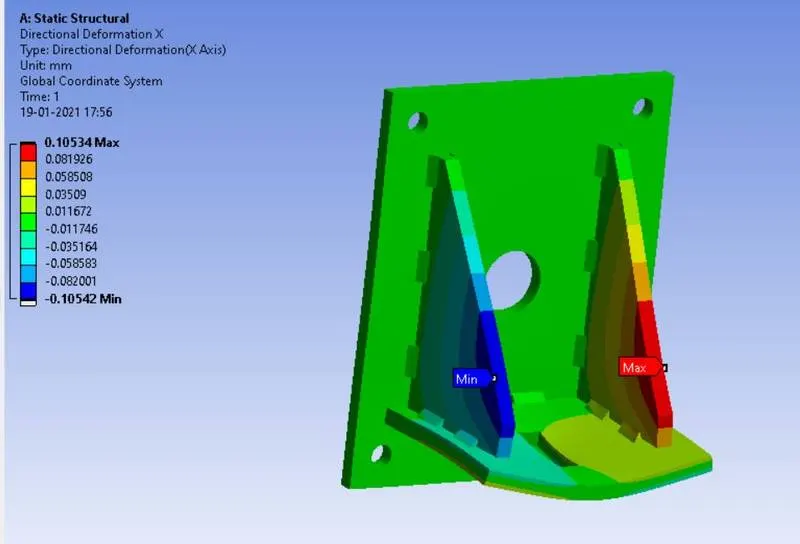
Maximum deformation in x-direction was observed on the ribs with magnitude of 0.105 mm. The deformation contour in y-direction is given below:
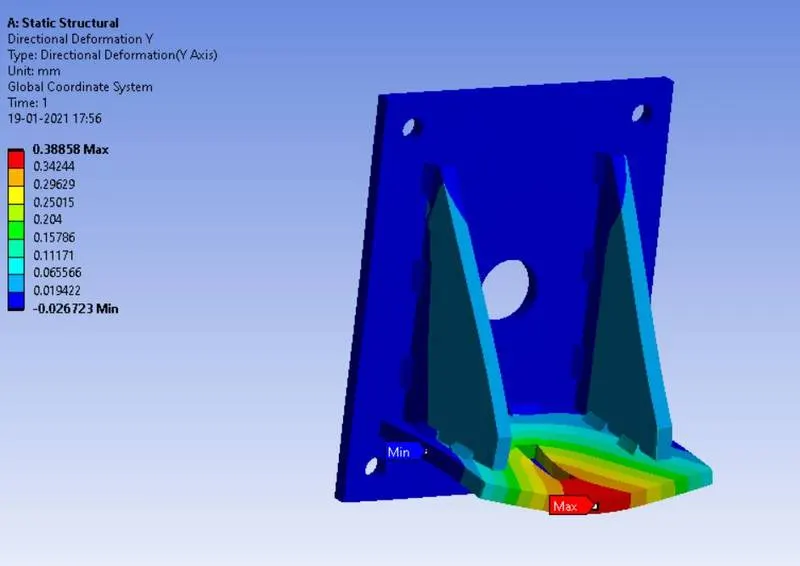
Maximum deformation in y-direction is seen close to the hole where force is applied. The magnitude of deformation is 0.38858 mm. The stress contour is given below:
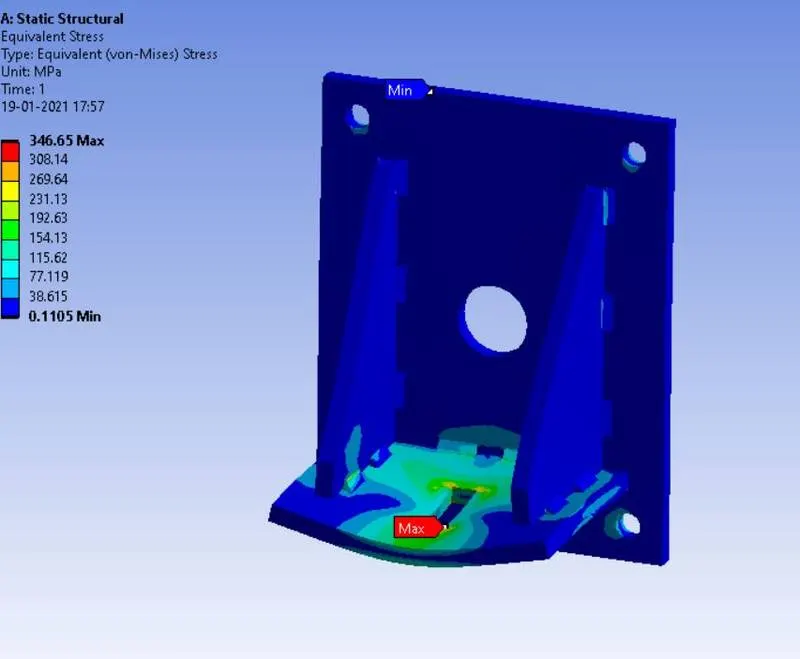
Maximum stress is observed at region close to the hole where force is applied with magnitude of 346.65 MPa. The strain contour is given below:
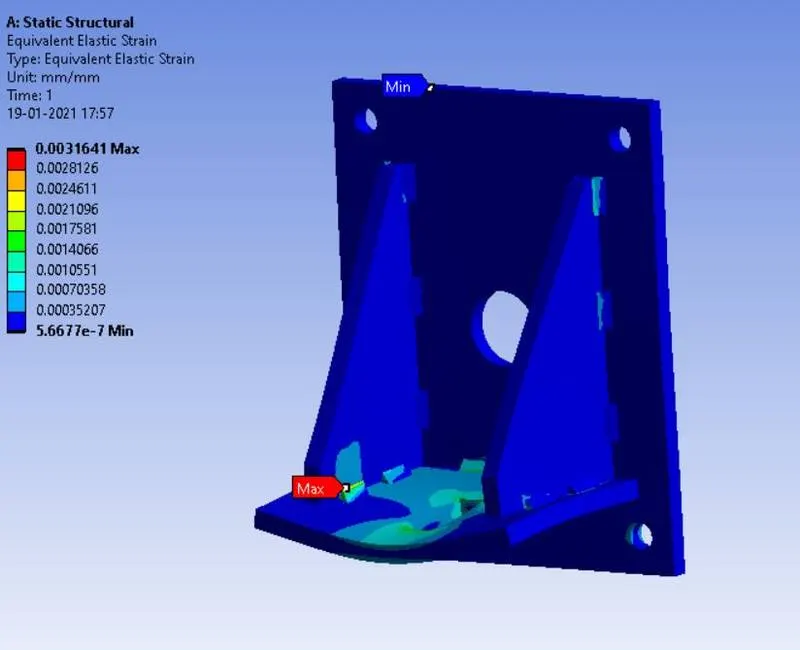
Maximum strain is again seen at the weld region with magnitude of 0.0031641. Corresponding stress value at the weld region is shown in the stress contour below:
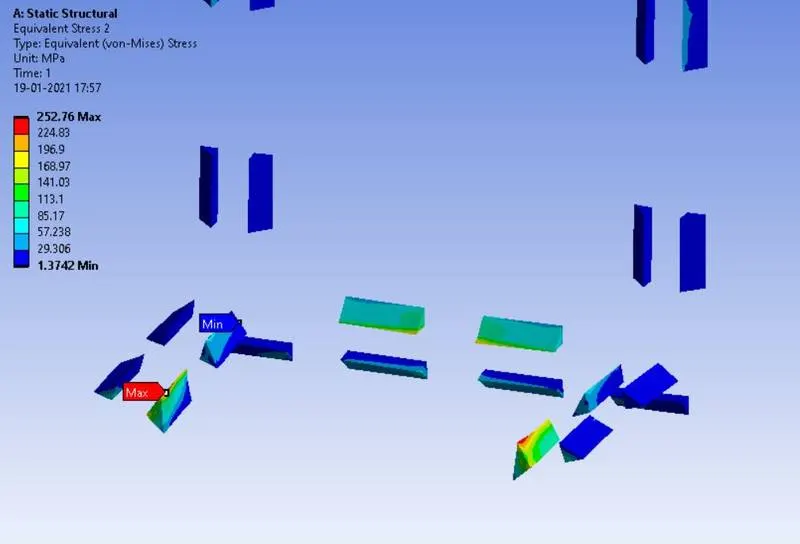
Maximum stress at the welded region reaches 252.76 MPa.
The results from the three cases can be summarized by the following table:
|
Weld Material |
Max Weld Stress |
Max Deformation x-axis |
Max Deformation y-axis |
Max Stress |
Max Strain |
|
Steel |
295.91 MPa |
0.096 mm |
0.343 mm |
336.14 MPa |
0.001829 |
|
Aluminium |
242.97 MPa |
0.09558 mm |
0.3571 mm |
340.56 MPa |
0.003295 |
|
Bronze |
252.76 MPa |
0.105 mm |
0.3885 mm |
346.65 MPa |
0.003164 |
The steel weld has the highest stress which leads to least deformation at the plate where force is applied. Whereas Aluminium and Bronze are not capable of handling high stresses and therefore welded regions experience low stress but also very high strain and thus the deformation experienced by the plate is also high. Therefore, the stainless steel weld is the best out of the three options.
CONCLUSION: The weld joints for the given component were successfully validated using ANSYS workbench for stainless steel, bronze and Aluminium. The resulting directional deformations, strains and stresses were tabulated and compared quantitatively.