Week 3 - Solving second order ODEs
% PROG. TO SOLVE 2nd ORDER D.E%INPUTS
g=9.81;
b=0.05;
l=1;
m=1;
% INTIAL CONDITION

t_span=linspace(0,20,20);
a=[0,5];
%RESULTS CALLING THE FUNCTION PROG.
[t,results]=ode45(@(t,theta)ode_func(t,theta,b,g,l,m),t_span,a)% PLOTING
figure(1)
plot(t,results(:,1);
hold on
plot(t,results(:,2);
y label('plot')
x label('time')
% PENDULUM ANIMATION USING FOR LOOP
theta=results(:,1)
ct=1;
for i=1:length(theta)
T=theta(i)
x0=0;
y0=0;
x1=l*sin(T)
y1=-l*cos(T)
figure(2)
plot([-1 1],[0 0],'linewidth',3,'color','b')
hold on
plot([x0 x1],[y0 y1],'linewidth',3,'color','r')
plot(x1,y1,'marker','.','markersize',30,'color','g')
hold off
axis([-3 3 -1.5 1])
pause(0.003)
M(ct)=getframe(gcf);
ct=ct+1
end %movie annimation
movie(M)
videofile=VideoWriter('PENDULUM_ANIMATION.avi','uncompressed avi')
open(videofile)
writeVideo(videofile,M)
close(videofile)% CALLING FUNCTION (ode_func)
function[dtheta_dt]=ode_func(t,theta,b,g,l,m)
theta1=theta(1)
theta2=theta(2)
dtheta1_dt=theta2
dtheat2_dt=-(b/m)*theta2-(g/l)*sin(theta1)
dthata_dt=[dtheta1_dt;dtheta2_dt]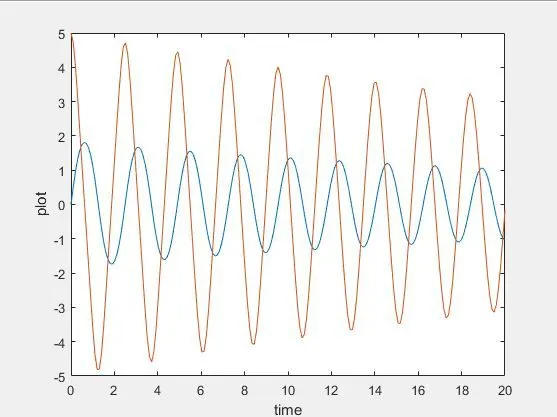
https://drive.google.com/file/d/1rw3oKm3rWBesHAdWC_HXQi4cWCV5woQ9/view?usp=sharing
EXPLATION ABOUT LOOP AND ODE 45
ODE 45
- ODE 45 is a function in MATL AB that solves ordinary as well as partial differential equation using numerical methods.
- It takes three inputs
1-Function to be intigreted
2-The time span
3-Initial condition
- Any ODE45 must be provided as a set of first order ODE.
syntacx-: [t,resuts]=ode45(Function to be intigreted,time span,Initial condition)
FOR loop
- When Matlab reads the for statement it constructs a vector
- It will take on each value within the vector in order.
- Matlab reads the end statement, it will execute and repeat the loop. Each time the for statement will update the value and repeat the statements within the loop.
CODES
hold on
hold on retains plots in the current axes so that new plots added to the axes do not delete existing plots.
hold off
- hold off sets the hold state to off so that new plots added to the axes clear existing plots and reset all axes properties.
- hold off resets axes properties to their defaults before drawing new plots. hold off is the default.
MARKER
It is usced to mark the co-ordinate point. you can increase the size and change the color of point by using 'markersize' and 'color' code.
plot
it is used to plot graphs.
axis
It specify the axis limts.
getframe
It captures the current axes as it appears on the screen as a movie frame.
VideoWrite
it is used to create a video file from an aaray or MATLAB movie.