Week 3 Sheet metal Bending challenge
STATIC STRUCTURAL ANALYSIS OF SHEET METAL BENDING
Objective
The main objective of this challenge is to perform a static structural Analysis on sheet metal bending for 3 Different materials.
To find out the Equivalent stress, Equivalent elastic strain and Deformation in Y direction and compare the results for the three materials .
Case 1: Aluminium Alloy 1199
Case 2 : Copper Alloy NL and
Case 3 : Magnesium Alloy NL
Case 4 : Change the Friction Coefficient (FC) to 0.19 and run the simulation with the material mentioned in Case 1 and compare the results with it.
Case 5 : Refine the plate's mesh so that it doesn't go beyond the permitted academic limit. Run the simulation with aluminium alloy as the material, then compare the outcomes.
Material data
Figure. 1 shows the structural steel's properties in Ansys Workbench engineering data. It was used as the punch & die material of the sheet metal bending model's material input.
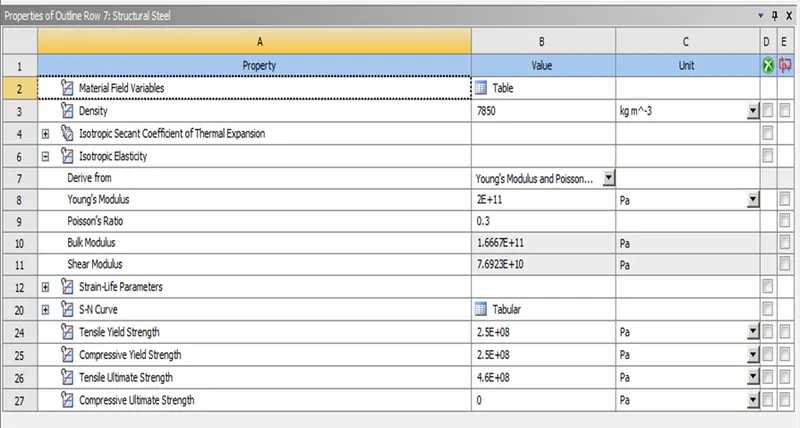
Figure. 1 structural steel engineering data
Figure. 2 shows the Aluminium Alloy 1199's properties in Ansys Workbench engineering data. It was used as the sheet material in Case 1 of the sheet metal bending model's material input.
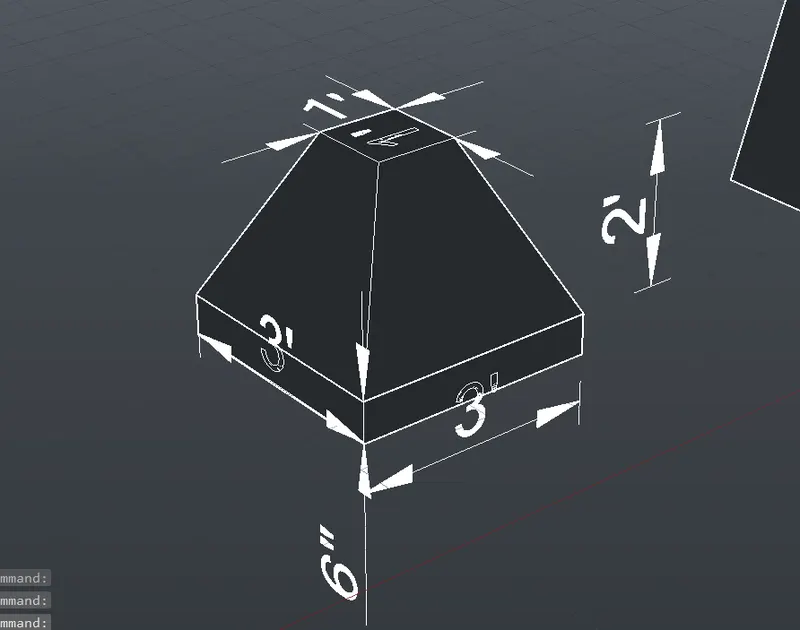
Figure. 2 Aluminium Alloy 1199 engineering data
Figure. 3 shows the Copper Alloy NL's properties in Ansys Workbench engineering data. It was used as the sheet material in Case 2 of the sheet metal bending model's material input.
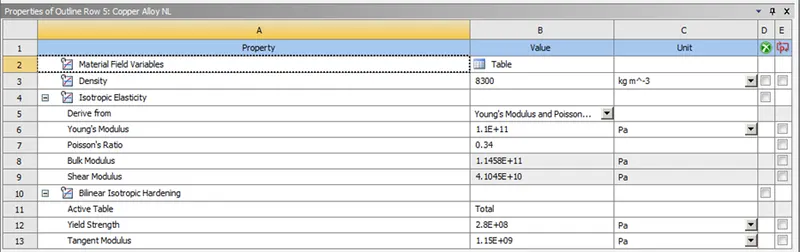
Figure. 3 Copper Alloy NL engineering data
Figure. 4 shows the Magnesium Alloy NL's properties in Ansys Workbench engineering data. It was used as the sheet material in Case 3 of the sheet metal bending model's material input.
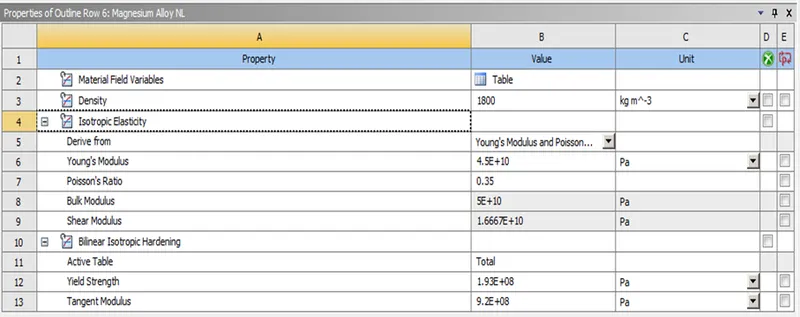
Figure. 4 Magnesium Alloy NL
Model Geomentry
Figure. 5 shows the imported given sheet metal bending model in the mechanical modular.
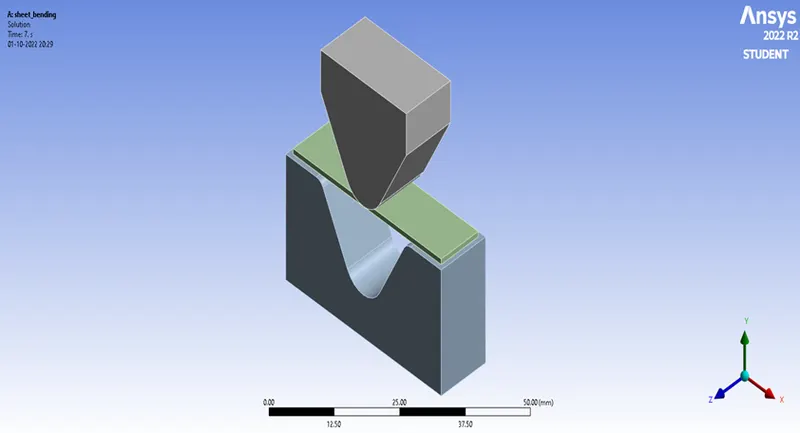
Figure. 5 Sheet metal bending model
Contact and Target faces
Figure. 6 & Figure. 7 illustrates the contact and target faces of the sheet metal bending. In which the connection in between punch and sheet upper face is taken as frictional connection and the punch is assigned as “Contact Bodies” then the sheet is assigned as “Target Bodies”.
Similary the connection in between die and sheet lower face is taken as frictional connection and the sheet is assigned as “Contact Bodies” then the die is assigned as “Target Bodies”.
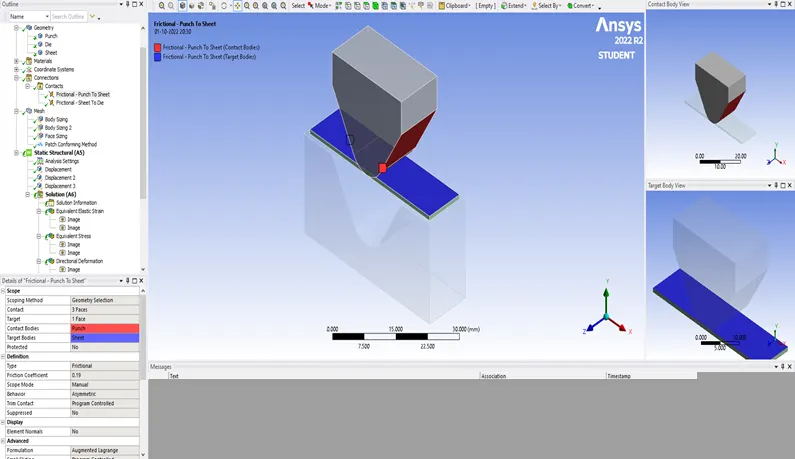
Figure. 6 Frictional - Punch to Sheet
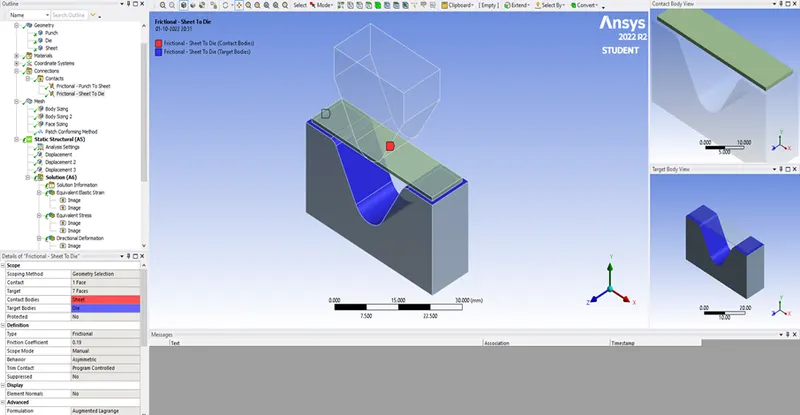
Figure. 7 Frictional - Sheet to Die
Meshing
Meshing was done in different element sizing for the three bodies in the model. Die & Punch is 3mm mesh sized then the Punch contact face and Die contact face is 0.8mm meshed and the sheet body is 0.7mm meshed is shown in Figure. 8. For element size refining the sheet body is 0.4mm meshed is shown in Figure. 9.
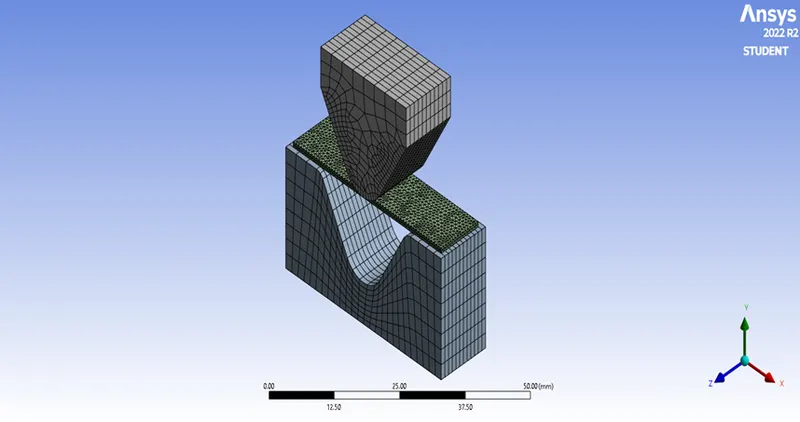
Figure. 8 Meshed Sheet metal bending model
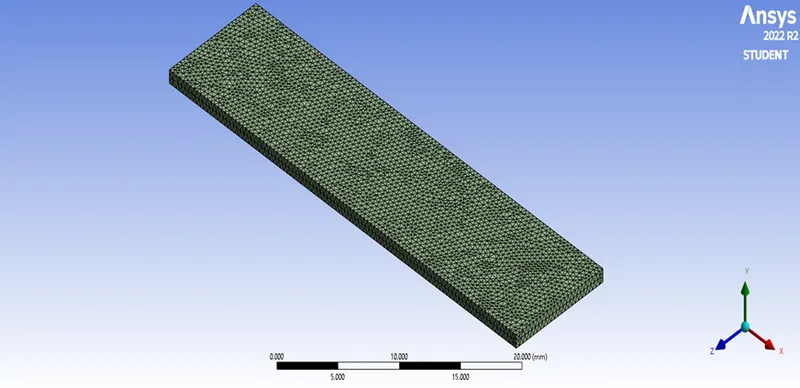
Figure. 9 Refined Meshed Sheet
Joint Displacements
Figure. 10 illustrates the vertical displacement joint of the punch. Since the number of steps in the analysis settings is 10 the displacement is increased to 13.5 mm then retracted back with in that 10 steps and the displacement was in the negative Y axis direction.
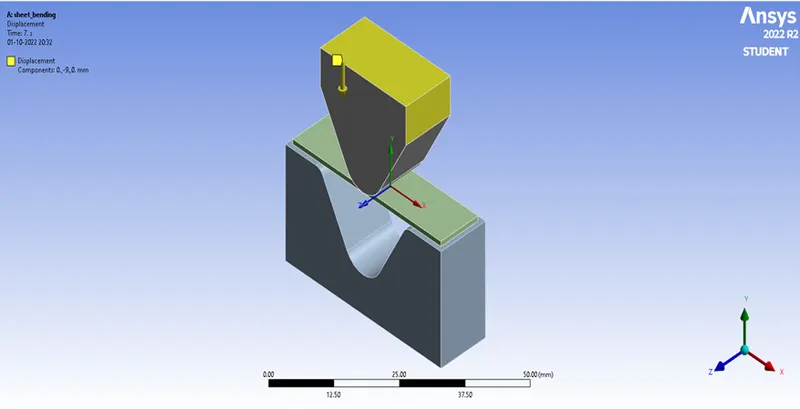
Figure. 10 Punch Displacement joint
Figure. 11 illustrates the displacement joint of the sheet, since the displacement is will be in the Z axis, the two faces perpendicular to the Z axis of the sheet is assigned as the displacement joint.
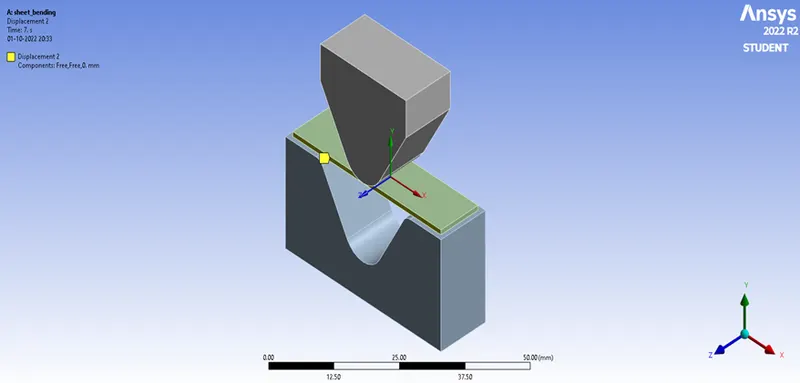
Figure. 11 Sheet Displacement joint
The vertical displacement joint of the die is shown in Figure 12. Since there are 10 steps in the analysis settings, the displacement is downward so that the sheet findings can be seen independently. Therefore, the die will be at rest for 8 steps before moving to -3mm in the final two stages.
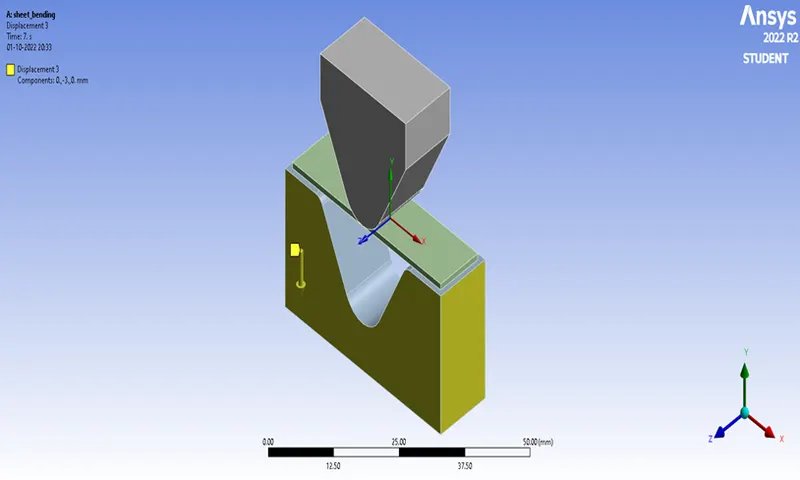
Figure. 12 Die Displacement joint
Simulation results
Case 1
The friction coefficient was taken as 0.1 in this simulation
Equivalent Elastic Strain
Figure. 13 illustrates the Equivalent Elastic Strain of Aluminium Alloy 1199 with the whole model. Since the maximum and minimum Equivalent Elastic Strain was not in the sheet, the individual maximum and minimum Equivalent Elastic Strain is shown in Figure. 14.
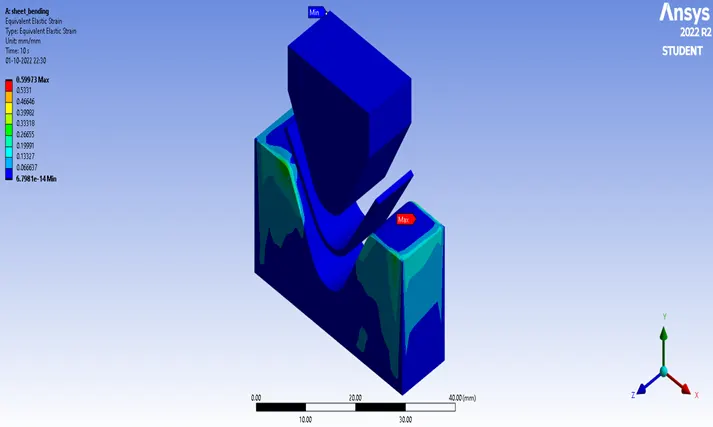
Figure. 13 Equivalent Elastic Strain of Aluminium Alloy 1199 with all bodies
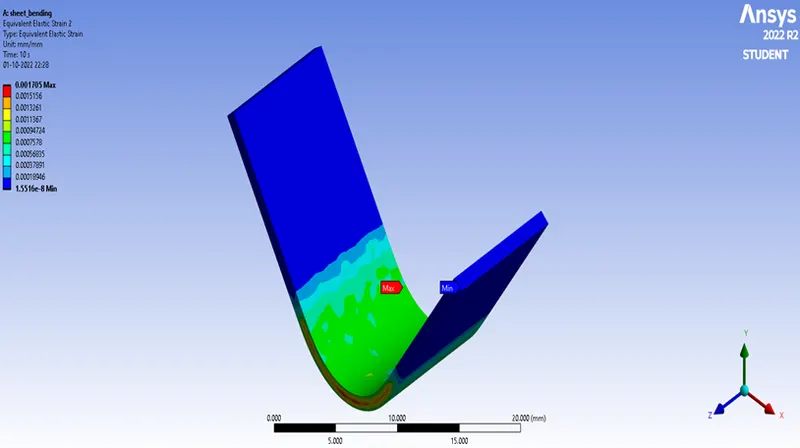
Figure. 14 Equivalent Elastic Strain of Aluminium Alloy 1199
Equivalent Stress
Figure. 15 illustrates the Equivalent Stress of Aluminium Alloy 1199 with the whole model. Since the maximum and minimum Equivalent Stress was not in the sheet, the individual maximum and minimum Equivalent Stress is shown in Figure. 16.
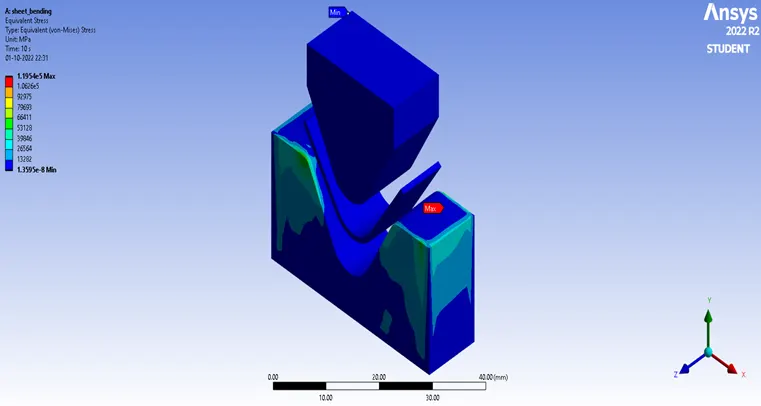
Figure. 15 Equivalent Stress of Aluminium Alloy 1199 with all bodies
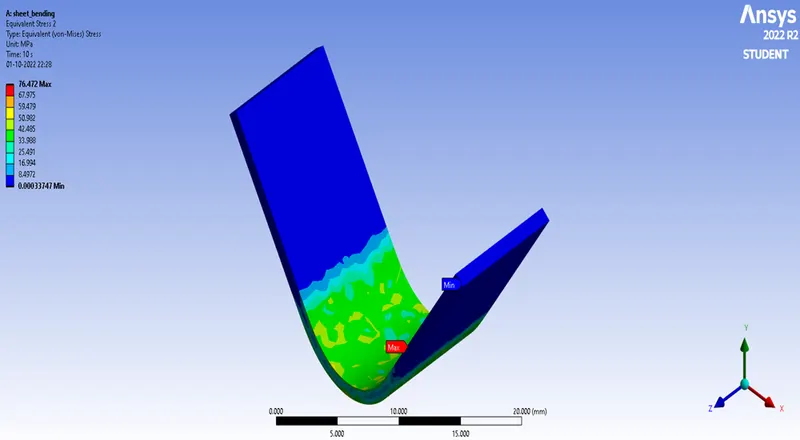
Figure. 16 Equivalent Stress of Aluminium Alloy 1199
Deformation in Y direction
Figure. 17 illustrates the Deformation in Y direction of Aluminium Alloy 1199 with the whole model. The maximum and minimum Deformation was in the sheet which shows also proven by reteriving the results individually and it is shown in Figure. 18.
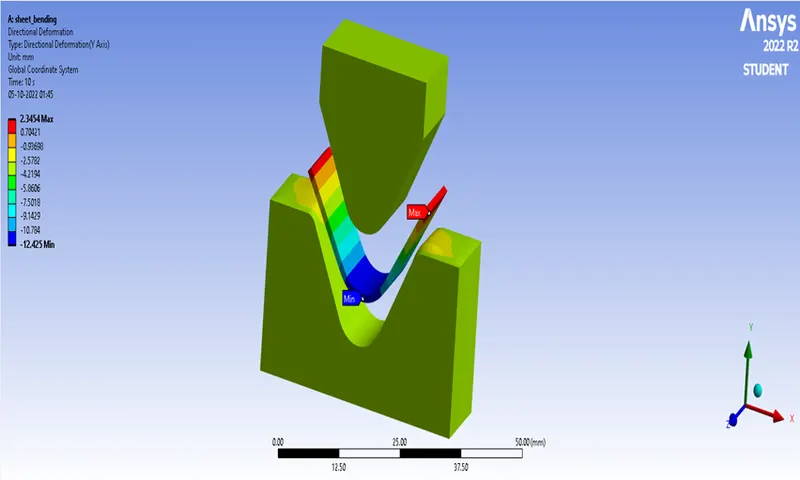
Figure. 17 Deformation in Y direction of Aluminium Alloy 1199 with all body
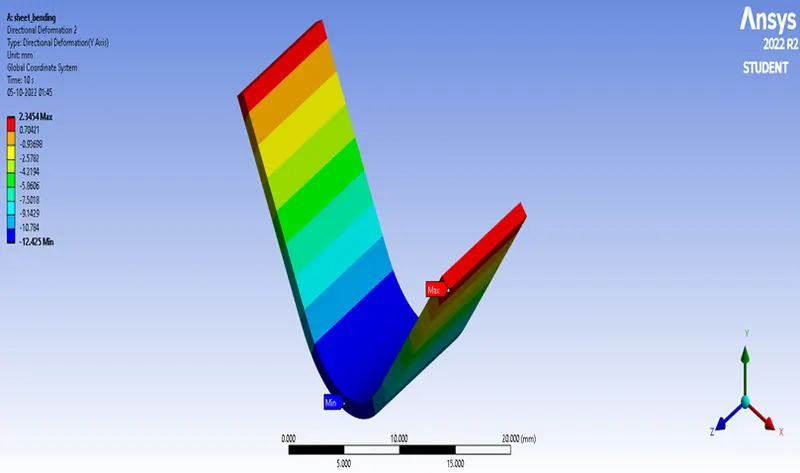
Figure. 18 Deformation in Y direction of Aluminium Alloy 1199
Case 2
The friction coefficient was taken as 0.1 in this simulation
Equivalent Elastic Strain
Figure. 19 illustrates the Equivalent Elastic Strain of Copper Alloy NL with the whole model. Since the maximum and minimum Equivalent Elastic Strain was not in the sheet, the individual maximum and minimum Equivalent Elastic Strain is shown in Figure. 20.
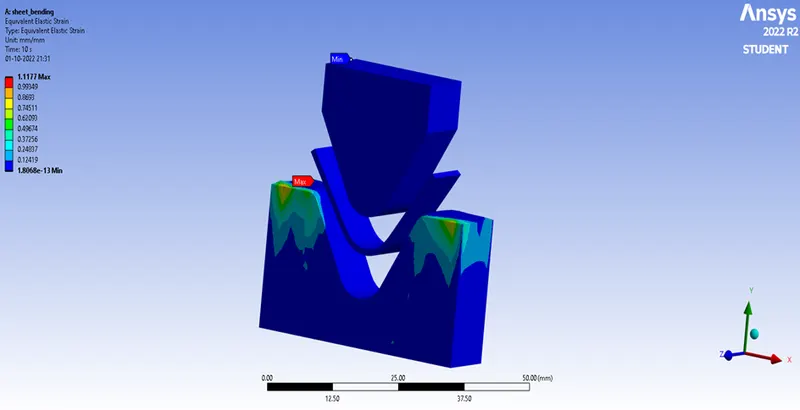
Figure. 19 Equivalent Elastic Strain of Copper Alloy NL with all bodies
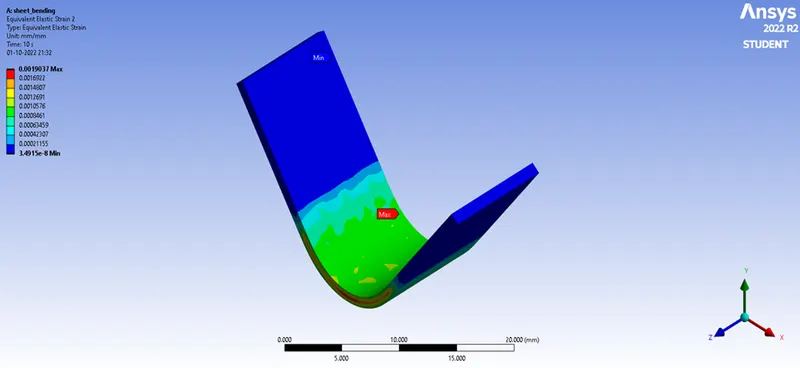
Figure. 20 Equivalent Elastic Strain of Copper Alloy NL
Equivalent Stress
Figure. 21 illustrates the Equivalent Stress of Copper Alloy NL with the whole model. Since the maximum and minimum Equivalent Stress was not in the sheet, the individual maximum and minimum Equivalent Stress is shown in Figure. 22.
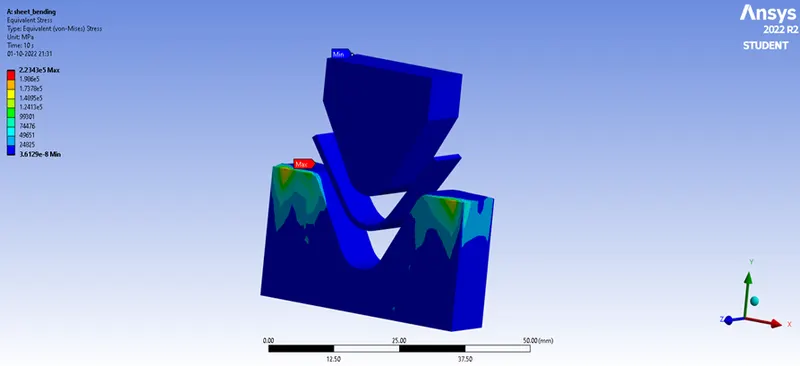
Figure. 21 Equivalent Stress of Copper Alloy NL with all bodies
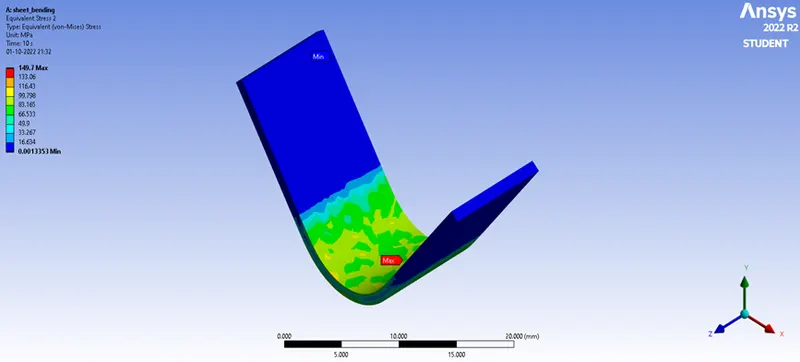
Figure. 22 Equivalent Stress of Copper Alloy NL
Deformation in Y direction
Figure. 23 illustrates the Deformation in Y direction of Copper Alloy NL with the whole model. Since the maximum and minimum Deformation was not in the sheet, the individual maximum and minimum Equivalent Stress is shown in Figure. 24.
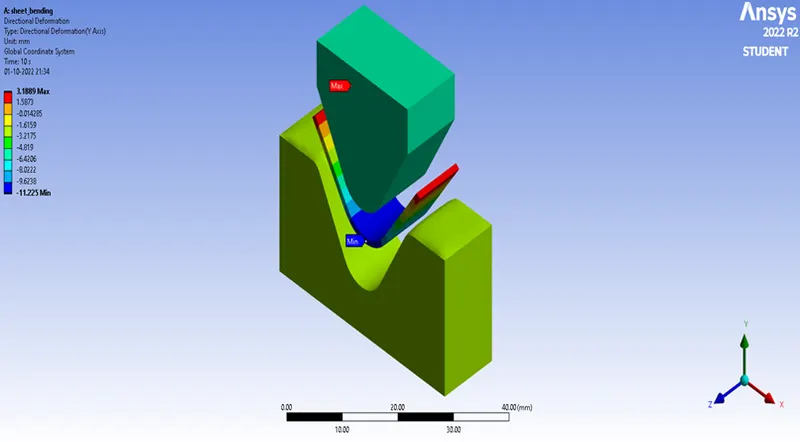
Figure. 23 Deformation in Y direction of Copper Alloy NL with all bodies
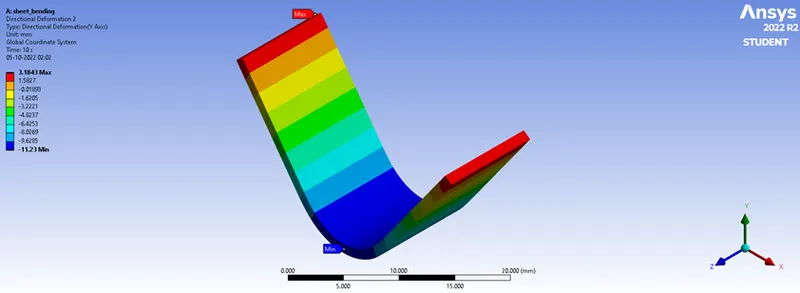
Figure. 24 Deformation in Y direction of Copper Alloy NL
Case 3
The friction coefficient was taken as 0.1 in this simulation
Equivalent Elastic Strain
Figure. 25 illustrates the Equivalent Elastic Strain of Magnesium Alloy NL with the whole model. Since the maximum and minimum Equivalent Elastic Strain was not in the sheet, the individual maximum and minimum Equivalent Elastic Strain is shown in Figure. 26.
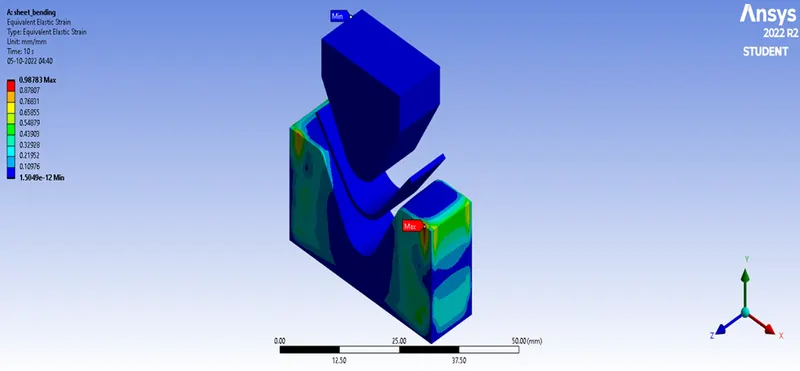
Figure. 25 Equivalent Elastic Strain of Magnesium Alloy NL with all bodies
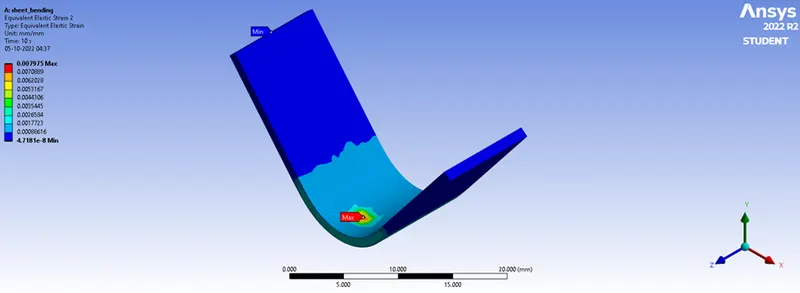
Figure. 26 Equivalent Elastic Strain of Magnesium Alloy NL
Equivalent Stress
Figure. 27 illustrates the Equivalent Stress of Magnesium Alloy NL with the whole model. Since the maximum and minimum Equivalent Stress was not in the sheet, the individual maximum and minimum Equivalent Stress is shown in Figure. 28.
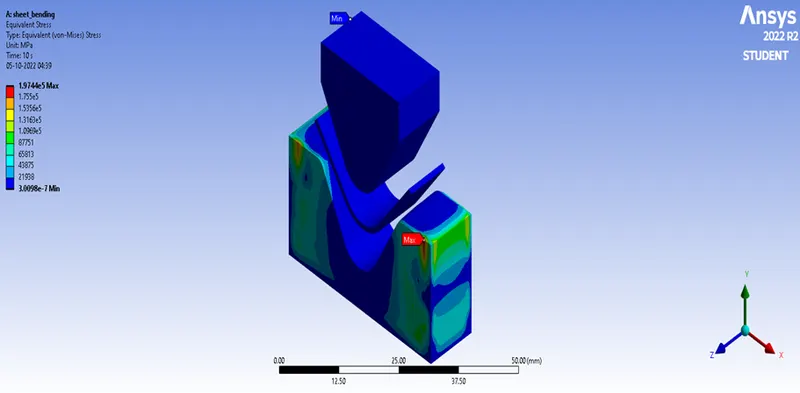
Figure. 27 Equivalent Stress of Magnesium Alloy NL with all bodies
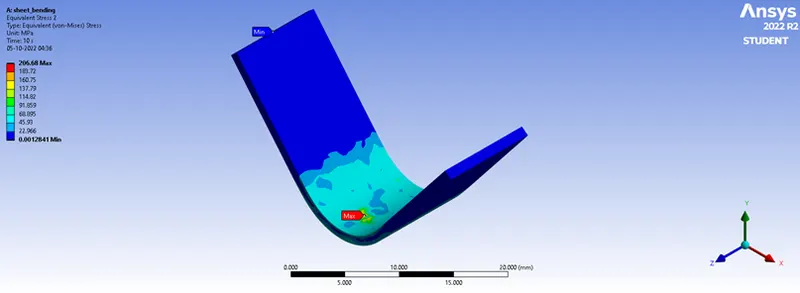
Figure. 28 Equivalent Stress of Magnesium Alloy NL
Deformation in Y direction
Figure. 29 illustrates the Deformation in Y direction of Magnesium Alloy NL with the whole model. The maximum and minimum Deformation was in the sheet which shows also proven by reteriving the results individually and it is shown in Figure. 30.
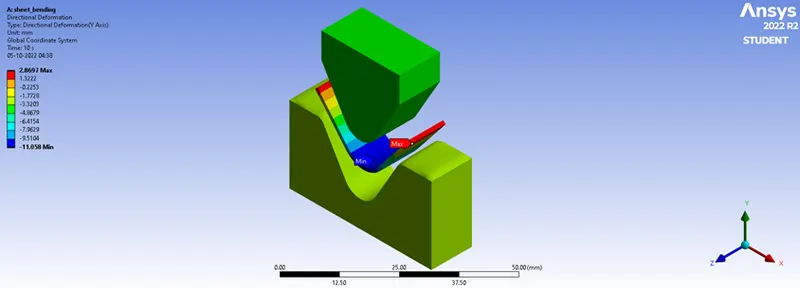
Figure. 29 Deformation in Y direction of Magnesium Alloy NL with all bodies
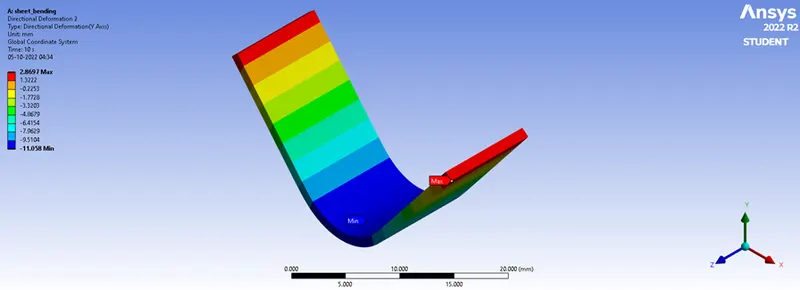
Figure. 30Deformation in Y direction of Magnesium Alloy NL
Comparision of Case1, Case2 & Case3.
|
Materials |
Parameters |
Maximum |
Minimum |
|
Aluminium Alloy 1199 |
Deformation in Y direction |
2.3454 mm |
-12.425 mm |
|
Equivalent Stress |
76.472 MPa |
0.00033 MPa |
|
|
Equivalent Elastic Strain |
0.0017 mm |
1.55e-8 mm |
|
|
Copper Alloy NL |
Deformation in Y direction |
3.1843 mm |
-11.23 mm |
|
Equivalent Stress |
141.7 MPa |
0.00133 MPa |
|
|
Equivalent Elastic Strain |
0.001903 mm |
3.4915e-8 mm |
|
|
Magnesium Alloy NL |
Deformation in Y direction |
2.8697 mm |
-11.058 mm |
|
Equivalent Stress |
206.68 MPa |
0.001284 MPa |
|
|
Equivalent Elastic Strain |
0.007975 mm |
4.7181e-8 mm |
Case 4
The friction coefficient was taken as 0.19 in this simulation
Equivalent Elastic Strain
Figure. 31 illustrates the Equivalent Elastic Strain of Aluminium Alloy 1199 (FC=0.19) with the whole model. Since the maximum and minimum Equivalent Elastic Strain was not in the sheet, the individual maximum and minimum Equivalent Elastic Strain is shown in Figure. 32.
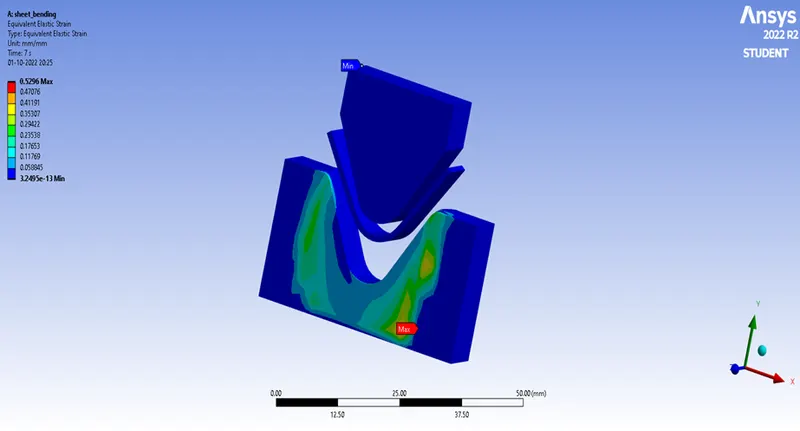
Figure. 31 Equivalent Elastic Strain of Aluminium Alloy 1199 (FC=0.19) with all bodies
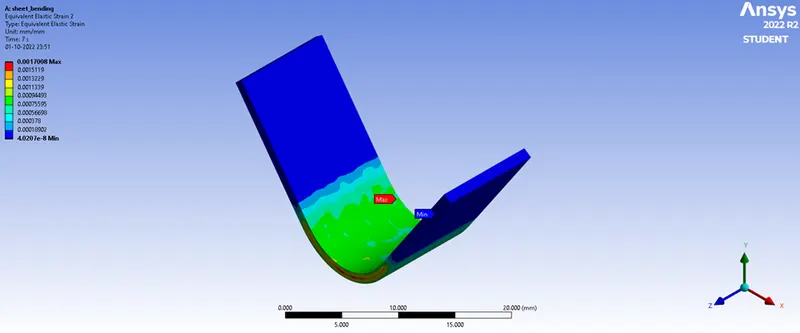
Figure. 32 Equivalent Elastic Strain of Aluminium Alloy 1199 (FC=0.19)
Equivalent Stress
Figure. 33 illustrates the Equivalent Stress of Aluminium Alloy 1199 (FC=0.19) with the whole model. Since the maximum and minimum Equivalent Stress was not in the sheet, the individual maximum and minimum Equivalent Stress is shown in Figure. 31.
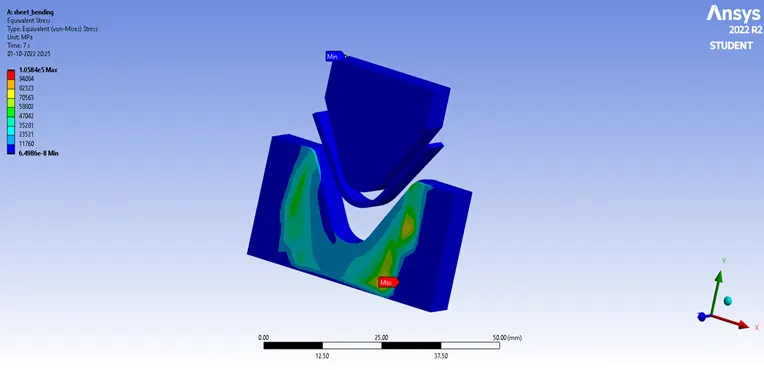
Figure. 33 Equivalent Stress of Aluminium Alloy 1199 (FC=0.19) with all bodies
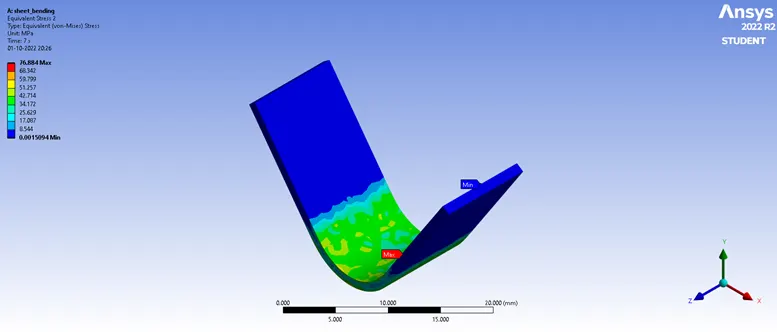
Figure. 34 Equivalent Stress of Aluminium Alloy 1199 (FC=0.19)
Deformation in Y direction
Figure. 35 illustrates the Deformation in Y direction of Aluminium Alloy 1199 (FC=0.19) with the whole model.
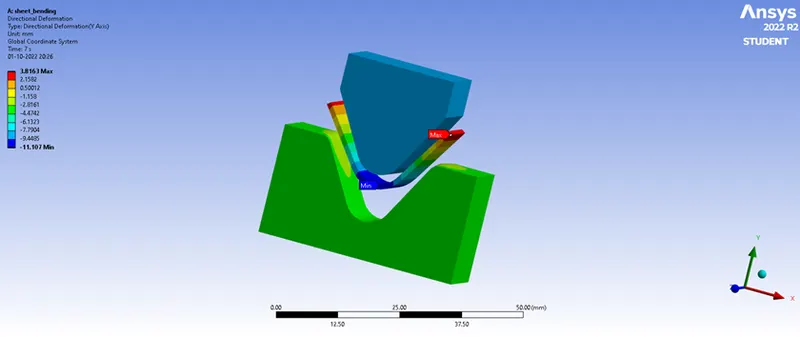
Figure. 35 Deformation in Y direction of Aluminium Alloy 1199 (FC=0.19) with all bodies
Comparison of Case 1& Case 4
|
Materials |
Parameters |
Maximum |
Minimum |
|
Aluminium Alloy 1199 |
Deformation in Y direction |
2.3454 mm |
-12.425 mm |
|
Equivalent Stress |
76.472 MPa |
0.00033 MPa |
|
|
Equivalent Elastic Strain |
0.0017 mm |
1.55e-8 mm |
|
|
Aluminium Alloy 1199 (FC=0.19) |
Deformation in Y direction |
3.8163 mm |
-11.107 mm |
|
Equivalent Stress |
76.884 MPa |
0.0015 MPa |
|
|
Equivalent Elastic Strain |
0.0017 mm |
4.0207e-8 mm |
Case 5
The friction coefficient was taken as 0.05 and The mesh elements sizing was taken as 0.4mm in this simulation
Equivalent Elastic Strain
Figure. 36 illustrates the Equivalent Elastic Strain of Aluminium Alloy 1199 (0.4mm Meshed) with the whole model. Since the maximum and minimum Equivalent Elastic Strain was not in the sheet, the individual maximum and minimum Equivalent Elastic Strain is shown in Figure. 37.
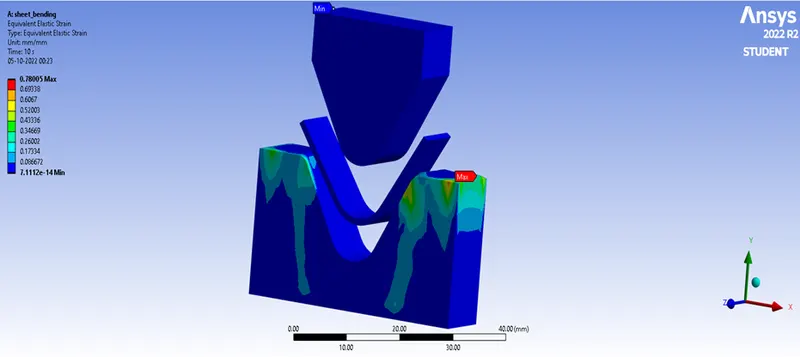
Figure. 36 Equivalent Elastic Strain of Aluminium Alloy 1199 (0.4mm Meshed) with all bodies
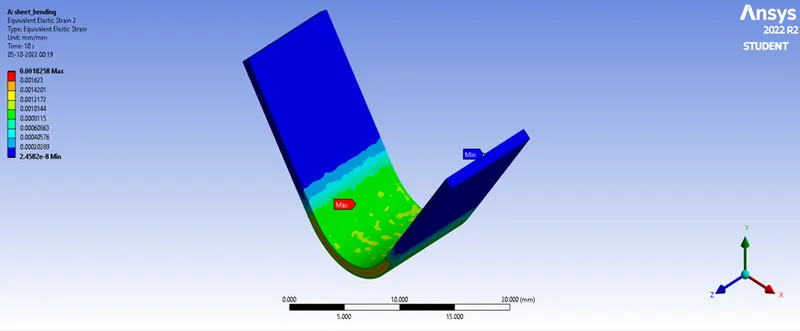
Figure. 37 Equivalent Elastic Strain of Aluminium Alloy 1199 (0.4mm Meshed)
Equivalent Stress
Figure. 38 illustrates the Equivalent Stress of Aluminium Alloy 1199 (0.4mm Meshed) with the whole model. Since the maximum and minimum Equivalent Stress was not in the sheet, the individual maximum and minimum Equivalent Stress is shown in Figure. 39.
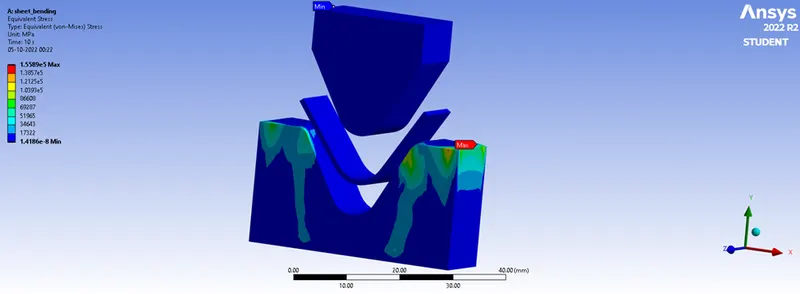
Figure. 38 Equivalent Stress of Aluminium Alloy 1199 (0.4mm Meshed) with all bodies
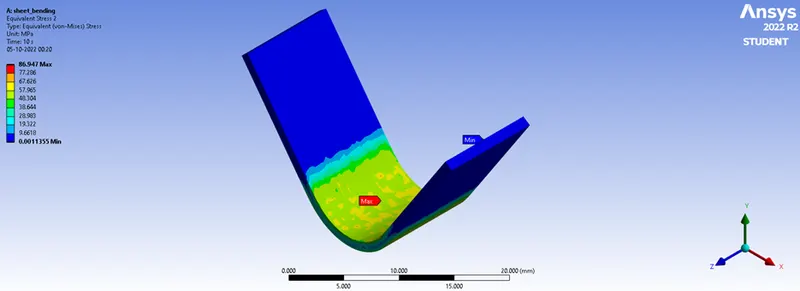
Figure. 39 Equivalent Stress of Aluminium Alloy 1199 (0.4mm Meshed)
Deformation in Y direction
Figure. 40 illustrates the Deformation in Y direction of Aluminium Alloy 1199 (0.4mm Meshed) with the whole model. Since the maximum and minimum Deformation was not in the sheet, the individual maximum and minimum Deformation is shown in Figure. 41.
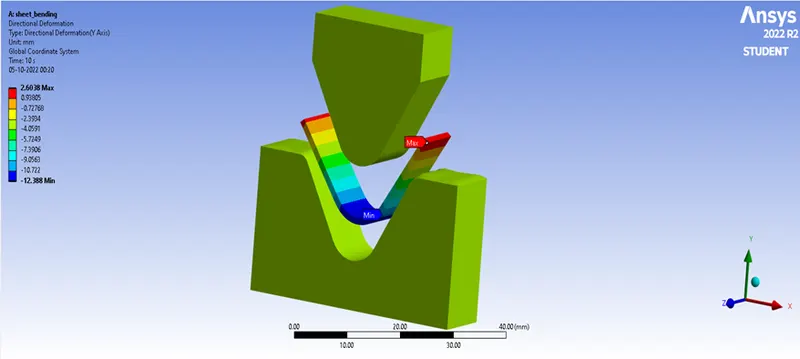
Figure. 40 Deformation in Y direction of Aluminium Alloy 1199 (0.4mm Meshed) with all bodies
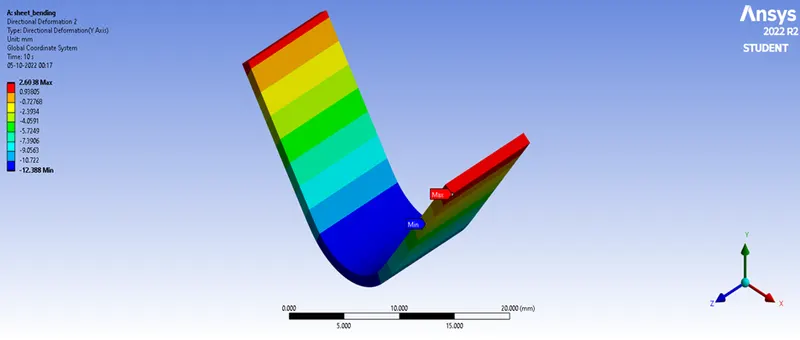
Figure. 41Deformation in Y direction of Aluminium Alloy 1199 (0.4mm Meshed)
Comparison of Case 1& Case 5
|
Materials |
Parameters |
Maximum |
Minimum |
|
Aluminium Alloy 1199 |
Deformation in Y direction |
2.3454 mm |
-12.425 mm |
|
Equivalent Stress |
76.472 MPa |
0.00033 MPa |
|
|
Equivalent Elastic Strain |
0.0017 mm |
1.55e-8 mm |
|
|
Aluminium Alloy 1199 (0.4mm Meshed) |
Deformation in Y direction |
2.6038 mm |
-12.388 mm |
|
Equivalent Stress |
86.947 MPa |
0.0011 MPa |
|
|
Equivalent Elastic Strain |
0.0018 mm |
2.4582e-8 mm |
Conclusion
- From the observation on CASE 1, CASE 2 and CASE 3 the maximum deformation is lesser in Aluminium Alloy 1199 than in Copper Alloy NL & Magnesium Alloy NL . Same condition is reflected in the Equivalent Stress and Equivalent Elastic Strain. Therefore Aluminium Alloy 1199 is best suited than the other two for this kind of metal bending process.
- According to the comparison of CASE 1 and CASE 4, aluminium alloy with a coefficient of friction of 0.19 performs better than aluminium alloy 1199. due to the fact that it has a greater Young's Modulus and ductile in nature.
- It observed that the optimal stress distribution and good bending behaviour from the comparison of CASE 1 and CASE 5 due to the refined mesh.