Week 3 - Pitot tube
Aim
To simulate the working of the given pitot static tube geometry with the given boundary conditions and estimate the percentage of error between the given conditions and the estimated results from the pitot tube.
Introduction
The pitot static tube is a device used to measure the velocity of a flow. It comprises two concentric channels where the fluid's total pressure and static pressure are estimated. The hole in front of the pitot static tube lets the flow pass through the pitot tube and measures the total pressure of the flow. The hole placed on the side of the pitot tube is used to measure the static pressure of the flow.
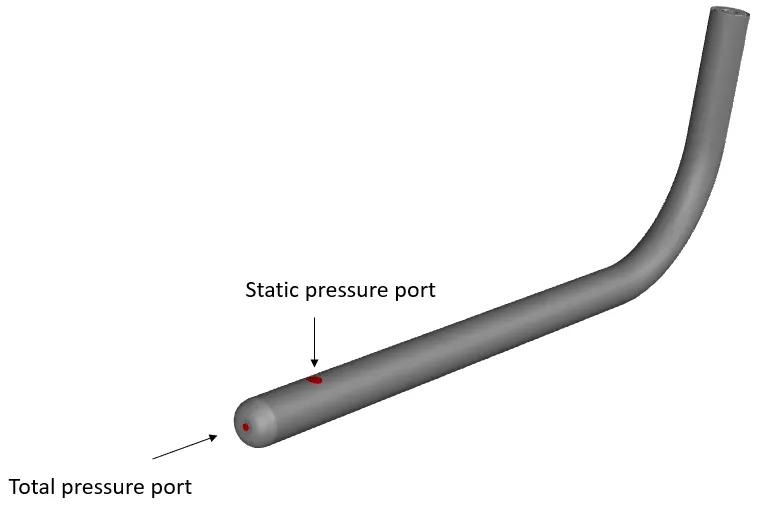
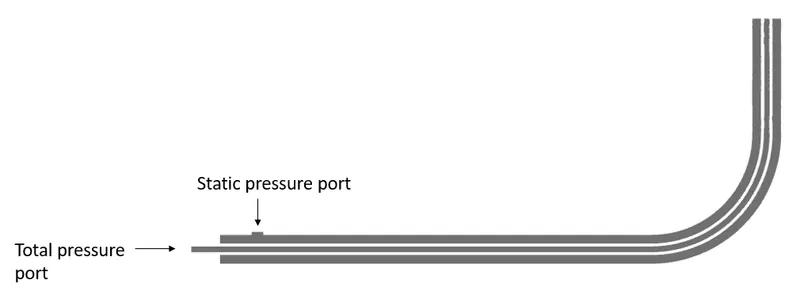
The total pressure of a flow is given as:
`P_{Total} = P_{Static} + P_{Dynamic}`
Estimation of the dynamic pressure using pitot tube measurements is done by:
` P_{Dynamic} = P_{Total} - P_{Static}`
`P_{Dynamic} = 0.5* rho* V^2`
where,
`rho ` - Density of the fluid
`V ` - Free stream velocity
Hence the relation for velocity determination using the pitot static tube is given as:
`V = sqrt(2*(P_{Total} - P_{Static})/rho)`
Method
Domain and Mesh
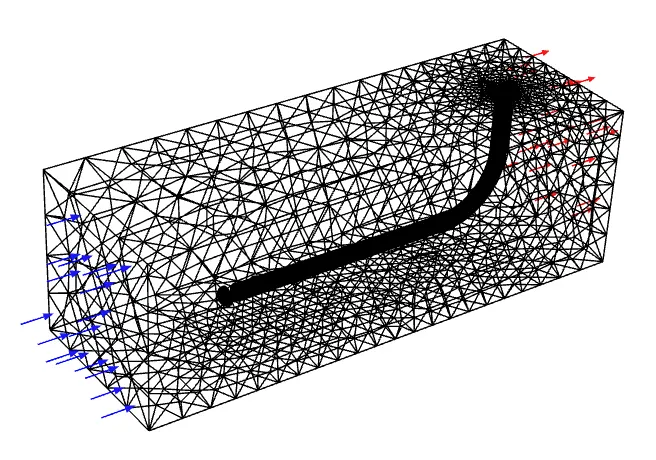
The meshed geometry of the pitot static tube with the domain was given and can be seen below. The domain consists of an inlet upstream of the pitot static tube and an outlet downstream. All other domain surfaces were provided with the symmetry boundary.
CFD Setup
All simulations were conducted on ANSYS Fluent 2022R2. Air was used as the fluid for all simulations. The velocity inlet boundary condition was applied at the inlet with the following properties for the three cases. Operating conditions were set to 1atm.
| Velocity [m/s] | Gauge Pressure [Pa] |
| 240 | -2817 |
| 100 | 33287 |
| 62 | 65780 |
The steady-state pressure-based PV coupled solver was used to discretize the flow parameters. Turbulence in the flow was assumed negligible and hence the laminar model was used. The second-order scheme was used to estimate the pressure and the second-order upwind scheme was used to estimate the momentum. The solution was initialized by a standard initialization from the inlet. The simulation was run with pseudo transient time stepping with an automatic global conservative length scale. Convergence was checked by scaled residuals achieving 1e-2 units and velocity estimataion not changing 1e-3 units across iterations. The simulations typically converged within 150 iterations.
Results
Case 1:
V= 240 m/s P = - 2817 Pa
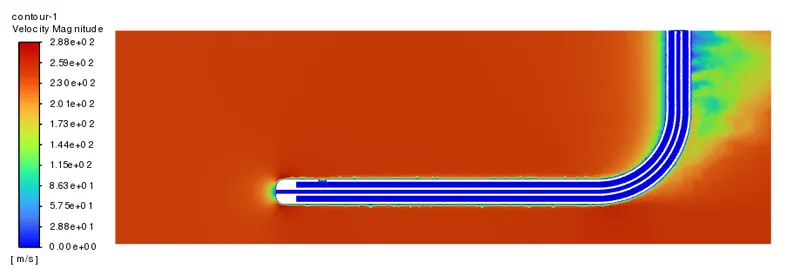
The images below show the contours of static pressure and velocity inside the pitot static tube.
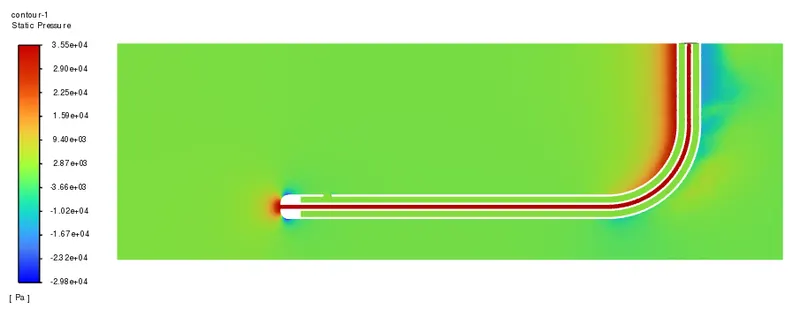
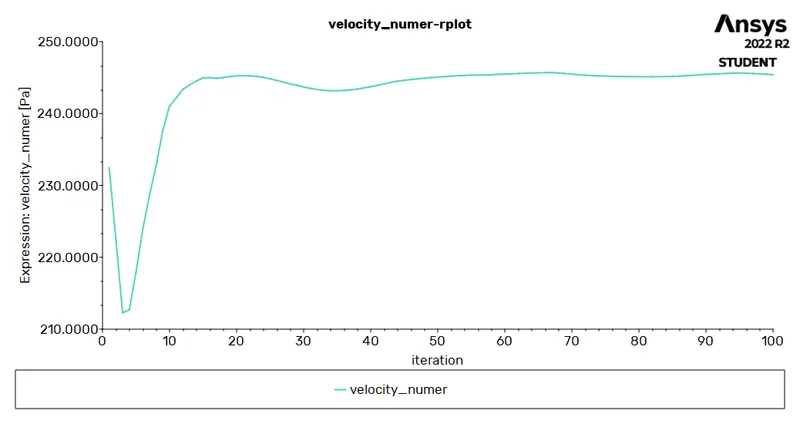
The image below shows the estimation of Velocity using the measurements from the total pressure and static pressure of the pitot tube.
Case 2:
V= 100 m/s P = 33287 Pa
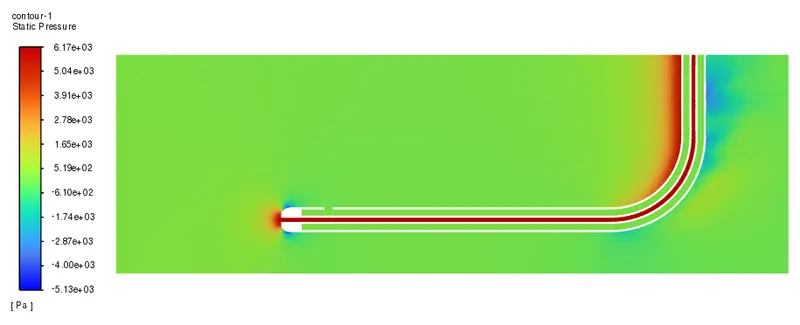
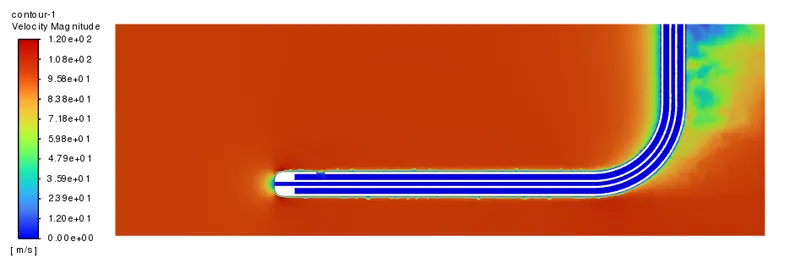
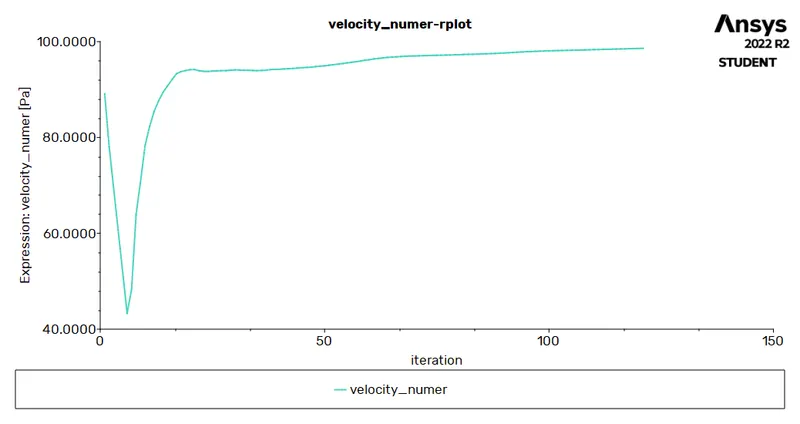
The images below show the contours of static pressure and velocity inside the pitot static tube.
The image below shows the estimation of Velocity using the measurements from the total pressure and static pressure of the pitot tube.
Case 3:
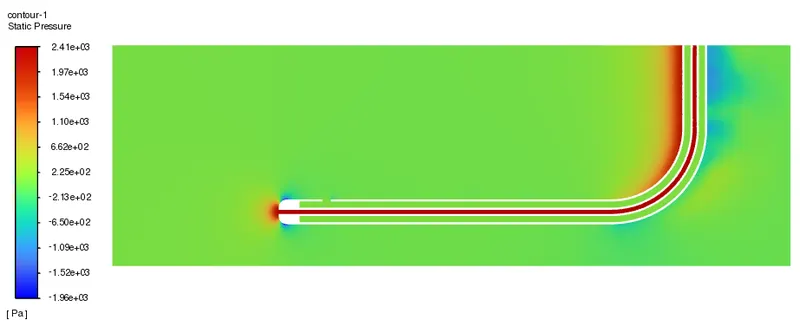
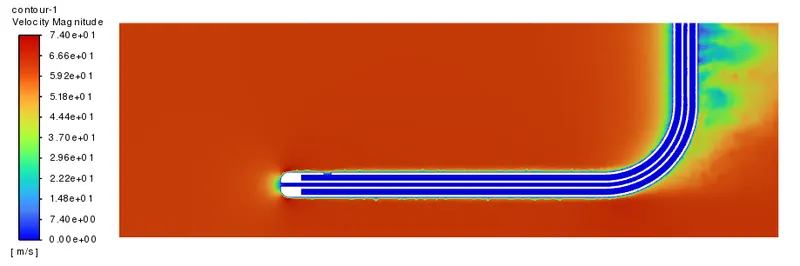
V= 62 m/s P = 65780 Pa
The images below show the contours of static pressure and velocity inside the pitot static tube.
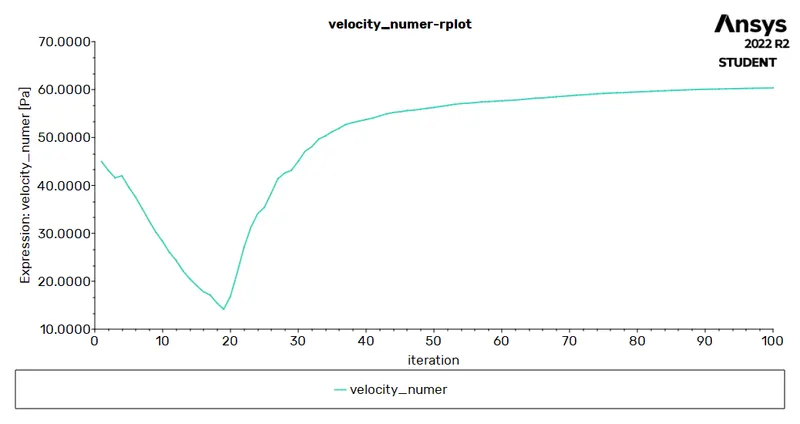
The image below shows the estimation of Velocity using the measurements from the total pressure and static pressure of the pitot tube.
The error percentage between the estimated velocities from the pitot tube and actual flow velocities are tabulated below.
| Case | Velocity [m/s] | Total Pressure (Gauge) [Pa] | Static Pressure (Gauge) [Pa] | Velocity Estimated [m/s] | Error Percentage |
| 1 | 240 | 35301.27 | -1584.95 | 245.4 | 2.25 % |
| 2 | 100 | 6164.52 | 209.04 | 98.6 | -1.40 % |
| 3 | 62 |
2411.24 |
181.75 |
60.33 |
-2.78 % |
All cases are seen to be within an error margin of 3% hence the readings and velocity measurements from the given pitot tube are validated.
Conclusion
Flow simulations were conducted on the given pitot static tube model using the prescribed boundary conditions. Total pressure and static pressure were measured from the corresponding channels on the pitot static tube and later used to estimate the flow velocity. The error between the estimated velocity and the given velocity for the various cases was then estimated and seen to be below 3%.