Week 3 - External flow simulation over an Ahmed body.
Aim- To simulate the flow of air over an Ahmed body and perform a grid independency test.
Introduction- Ahmed body is a standard model of a generic car used to test simulations. Instead of bringing in the proper model of the actual car to be simulated, the Ahmed body serves best. Ahmed body represent a simplified geometry of a hatchback car. The rear slant angle of the Ahmed body is tweaked according to conditions for desired results. With this model, engineers can achieve similar results to that of the actual car, which makes the job easier and less time consuming.
Theory- The Ahmed body was originally developed by S. R. Ahmed in 1984. This body has since then be used in several simulation solving to study more about the near wake region and how it depends on the rear slant angle of the Ahmed body. There are number of vortices that form behind the rear end of the Ahmed body which are categorized alphabetically such as Vortice-A formed at the rear end in the region away from the ground caused due to the seperation of the flow from the roof because of the slant edge, Vortice-B formed under Vortice-A close to the ground due to the seperation of flow from the base of the model and the C-pillar vortices which orginates from the C-pillar of the model or the side surfaces of the Ahmed body. This model has been studied in great depth in context of the aforementioned phenomena.
In this report the simulation is just used to represent the velocity vectors from the side view and track the negative pressure produced at the rear end of the Ahmed body. This negative pressure is caused due to vorticity which is nothing but the back flow of air particles to fill a vacuum or void at the back side of an object moving at a considerable velocity. The front side of the body moving has a higher pressure compared to the rear side with just not a low pressure but opposite in magnitude. This negative pressure naturally sucks in air which causes the back flow of the air particle moving in the opposite direction in the form of whirls called as vortices.
The Separation of flow or Boundary layer separation is the phenomenon where the viscous boundary layer in a fluid flowing over a solid body detaches and gives rise to a wake. Separation of flow occurs when the flow is slowing down and the pressure is increasing, for example, a flow of fluid through a gradually increasing cross-sectional area.
Solving and modelling approach-
The Ahmed body is symmetric in geometry thus we can use half of the body and simulate with larger element count below the license threshold and a refined set up. Initially a base line set up is put in use to understand the nature of the wake region so that the area of its occurence can be refined with smaller element size to capture the intricate velocity vectors.
After the initial base line set up, another enclosure is defined around the car body (Ahmed body) and the element size in the same is refined using Body sizing in Ansys Mesh.
In the Solver setting it is required to produce a lift and drag plot. Addtionally, a contour for velocity is also generated to have visuals of its behaviour.
Pre-processing and solver setting-
The geometry of the Ahmed body is loaded in Spaceclaim, the units are set according to preferences, an enclosure is generated around the car body where in the mesh will be generated. Since this is just a base line set up only one enclosure is used. To use half of the entire set up the split body function is used. The car body is suppressed for physics so that the meshing does not generates in it.
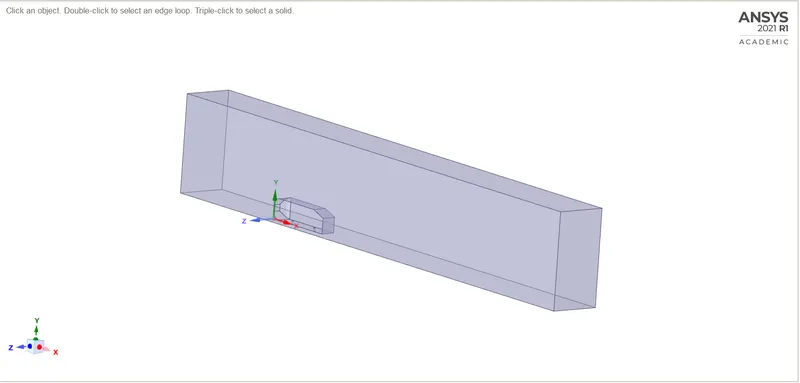
This geometry is then updated and loaded in Ansys Mesh.
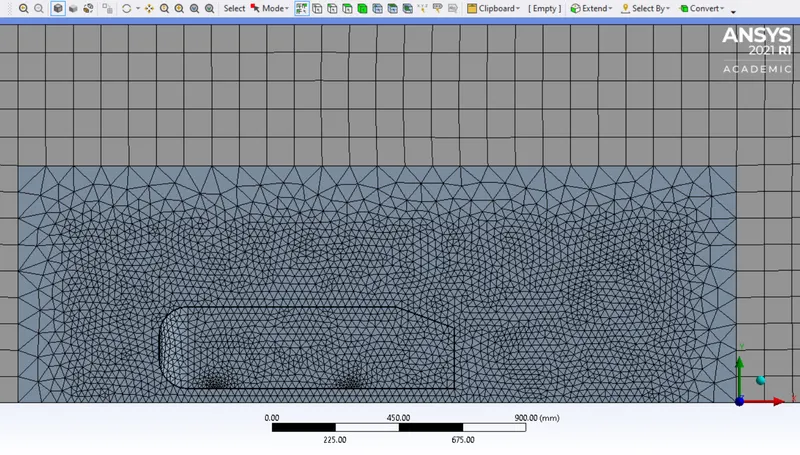
Named selections are given to the geometry such as the wall, symmetry, inlet, outlet and car wall as the boundary conditions. The mesh is generated with the default element size.
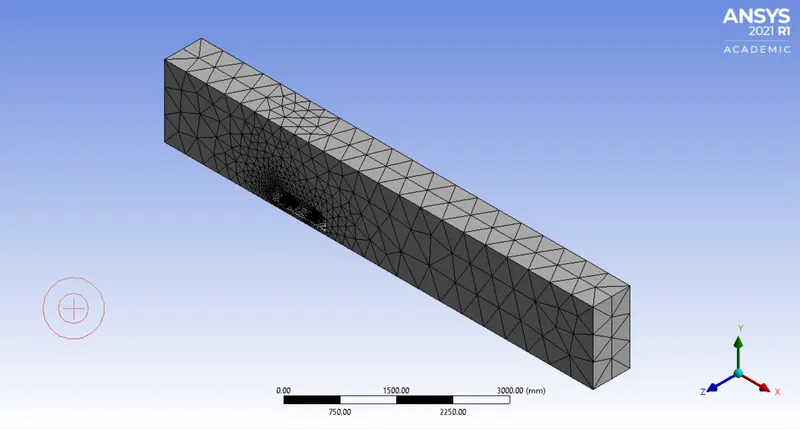
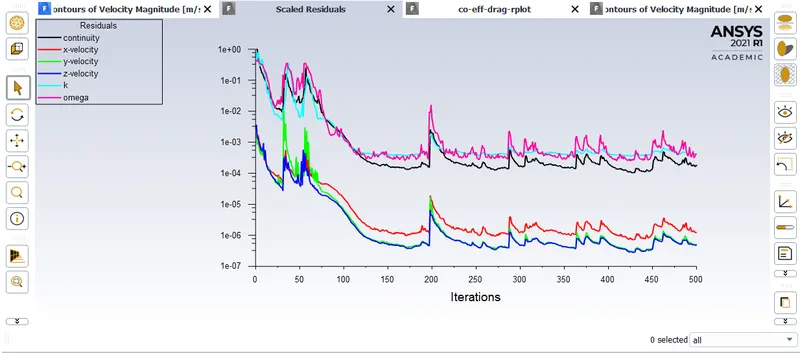
The Mesh is updated in Fluent for solving with 25m/s using k-ω SST model.
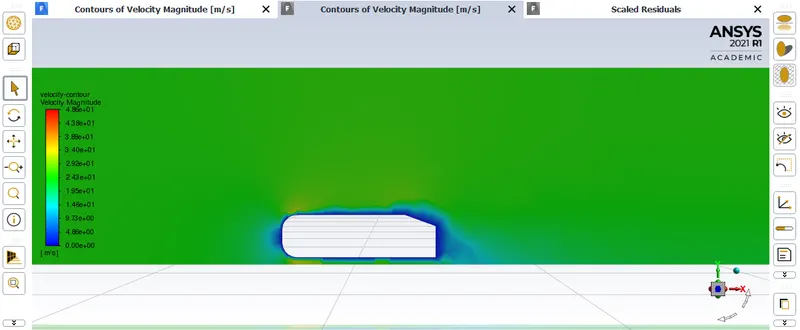
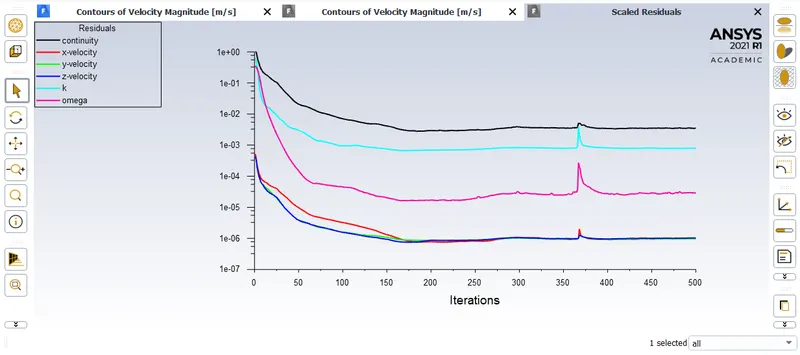
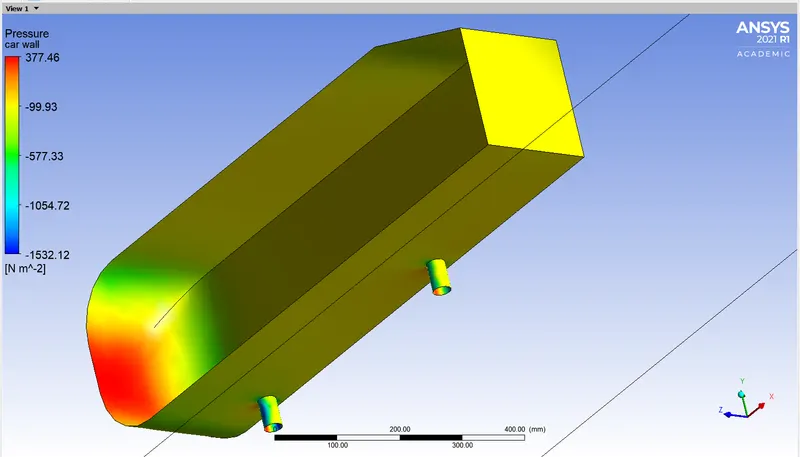
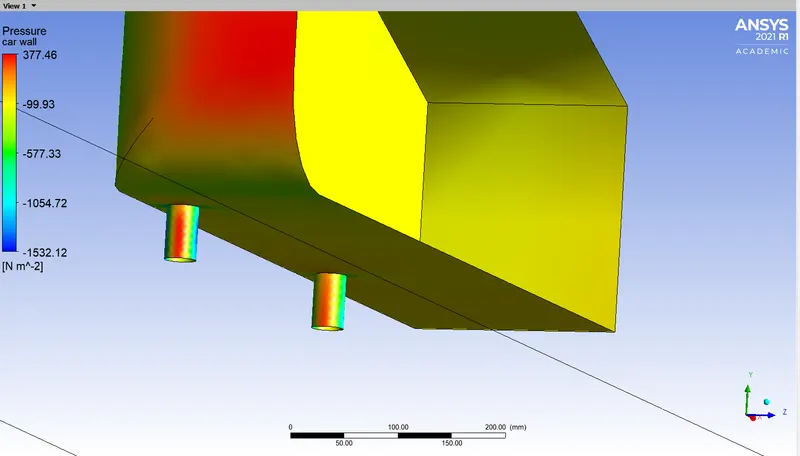
In post-processing the scale shows negative values for pressure and it can be found evident in the rear side of the car body, contrary to the higher pressure at the front side. This negative pressure is a proof of the occurence of the wake region, i.e. the formation of vortices.
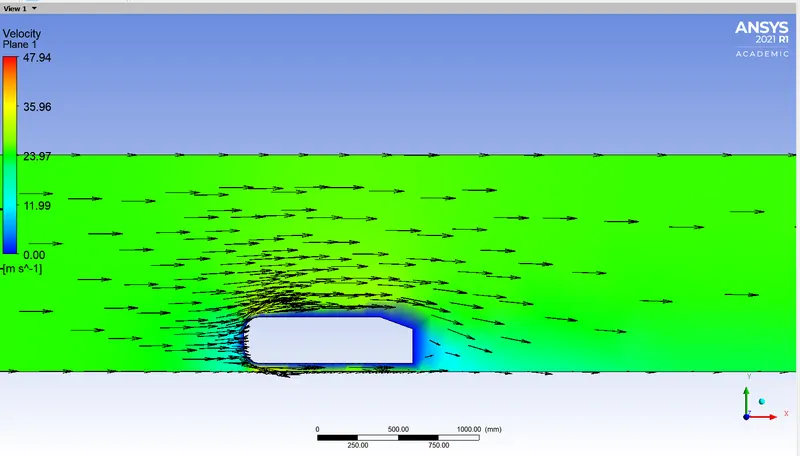
After visualizing the area of the wake region an approximate distance is measured with the help of the scale in the bottom part of the window which helps us to make the smaller enclosure with refined element size to capture more details of the velocity vectors near the car body in the refined set up.
The smaller enclosure is created in Spaceclaim with respect to the distances measured in Fluent from the base line setup.
This is a cut section of the geometry with an interference between the two enclosures.
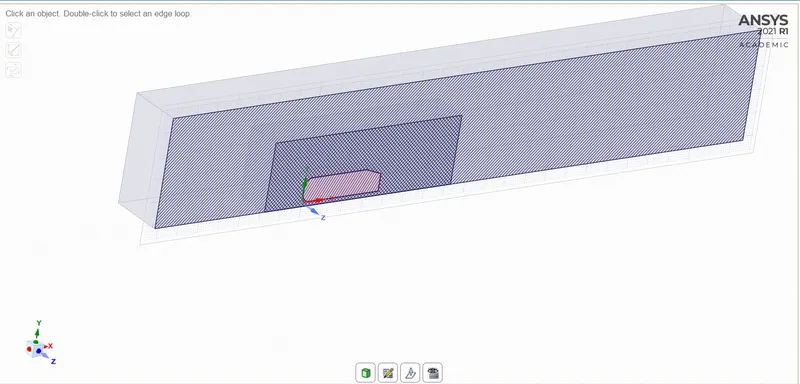
The interference function is used to get rid of this flaw.
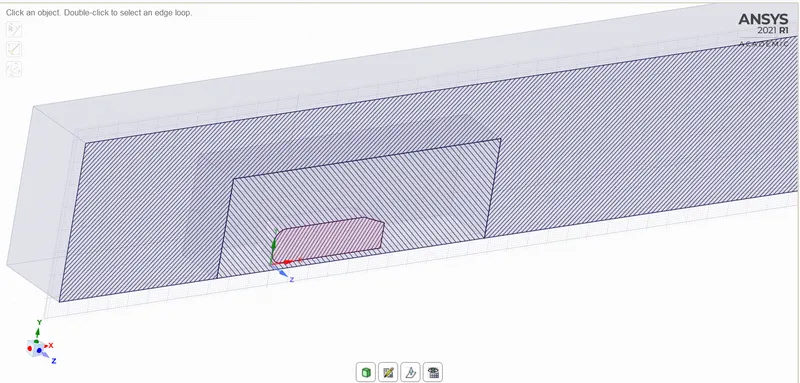
The Ahmed body is suppressed for physics and the final geomtery is updated and loaded in Fluent
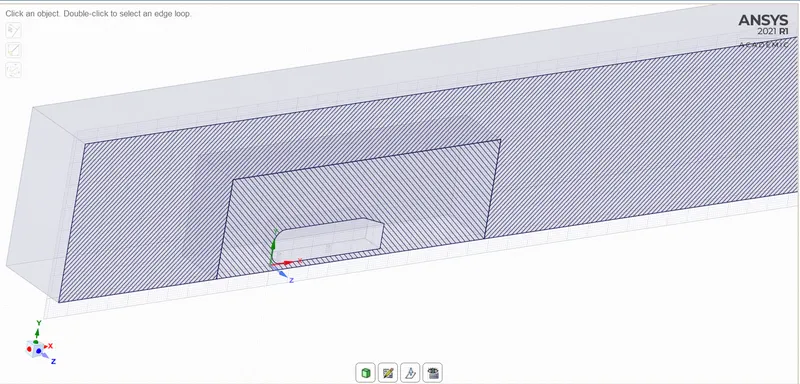
Similar to the base line set up half of the body is used for simuation using the split body function.
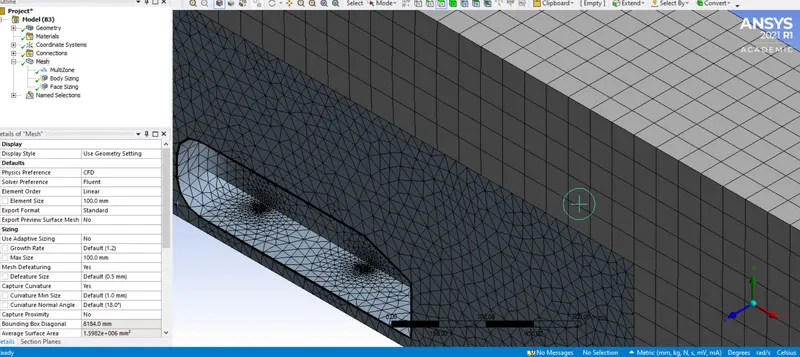
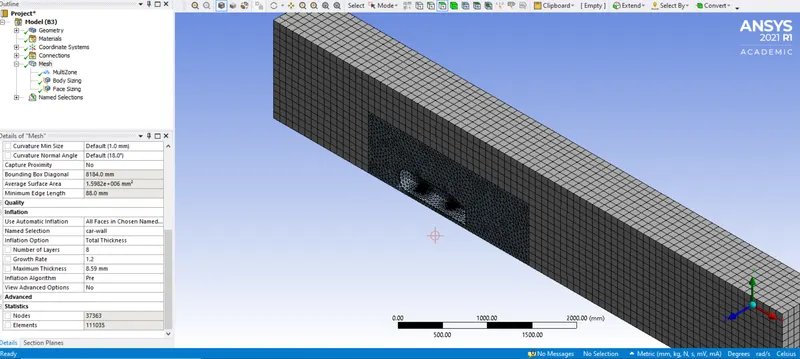
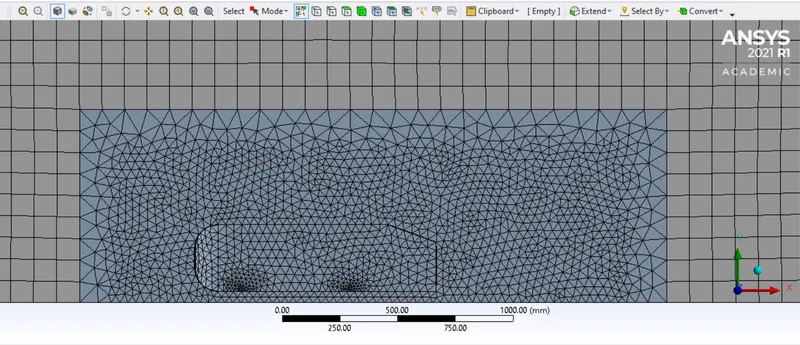
Ansys Mesh is booted with the geometry and the meshing is performed keeping the following points in mind-
1. A Hex dominant mesh in the outer enclosure.
2. A refined mesh in the inner enclosure
3. A refined mesh around the holes that represent the wheels of the car body.
4. Inflation layers around the Ahmed body with an appropriate y+ value in consideration.
And the result is-
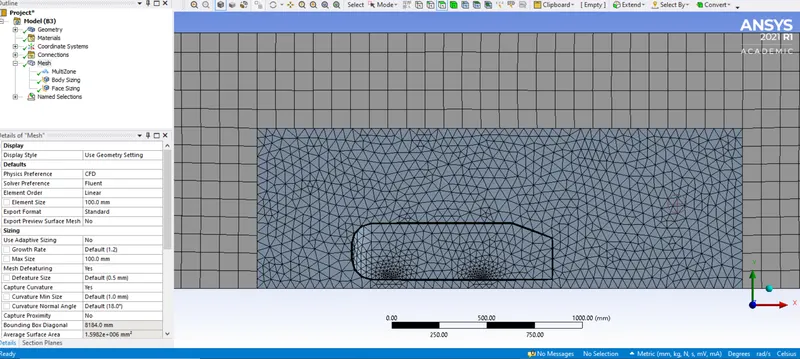
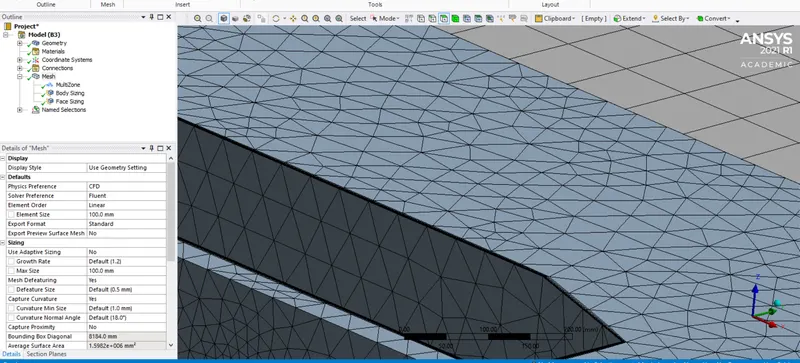
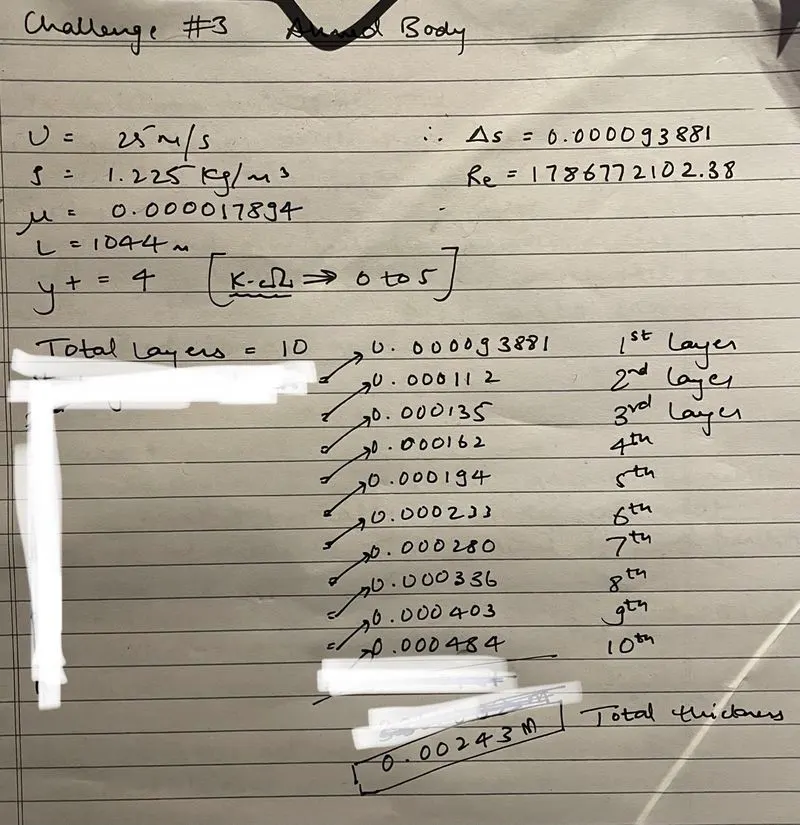
The inflation layer calculations include-
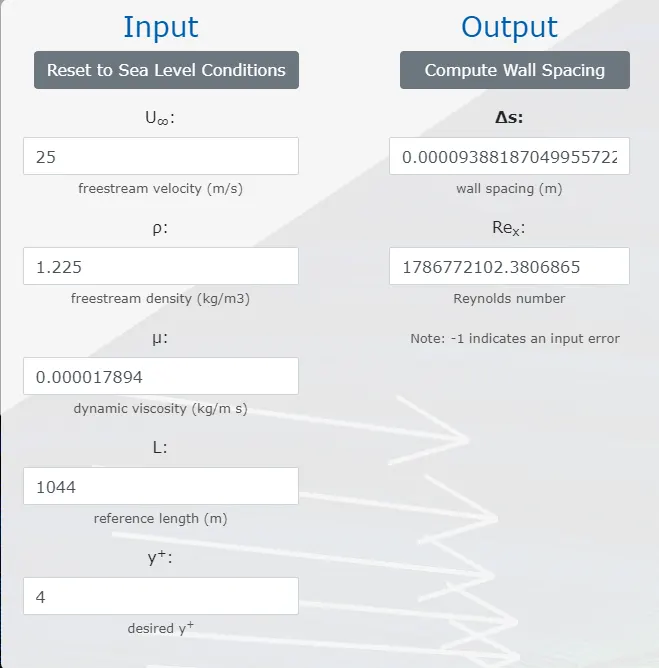
Since we have the constant values of velocity, density, viscosity and the characteristic length of the car body along with the y+ value in the range of 0.1 to 5 for a k-ω SST model i.e. 4, we can obtain the value for the thickness of the first layer of inflation from the boundary of the car body.
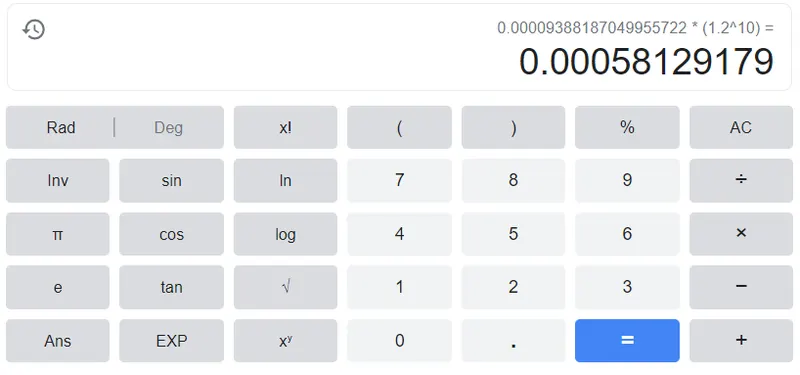
This thickness value is then used to calculate the total thicknesss of the inflation layer with 10 layers and 1.2 growth factor.
Ansys Fluent is used to solve for the simulation.
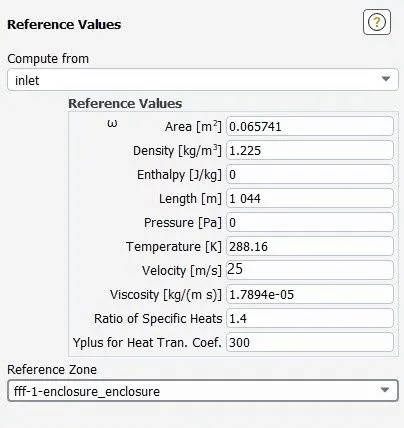
The reference values are set to the required conditions.
Results-
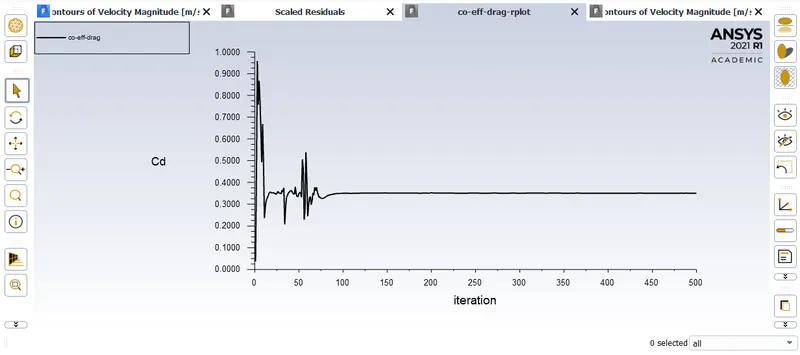
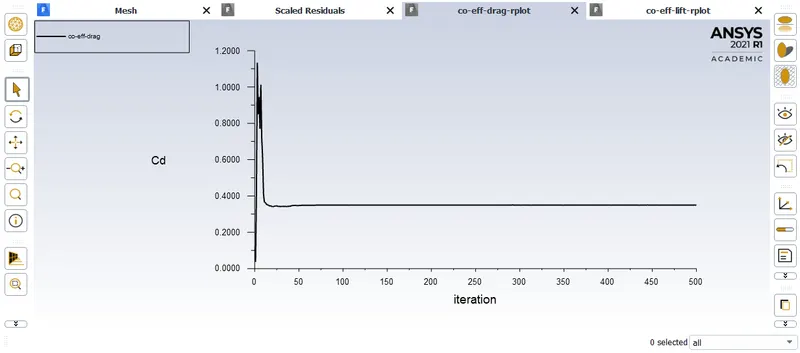
The co-efficient of drag is 0.33 as required.
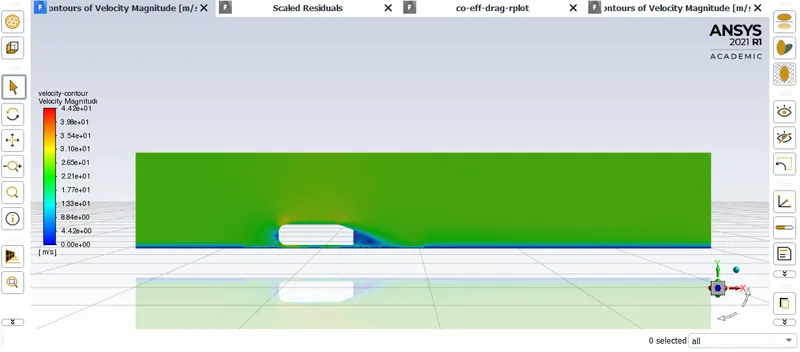
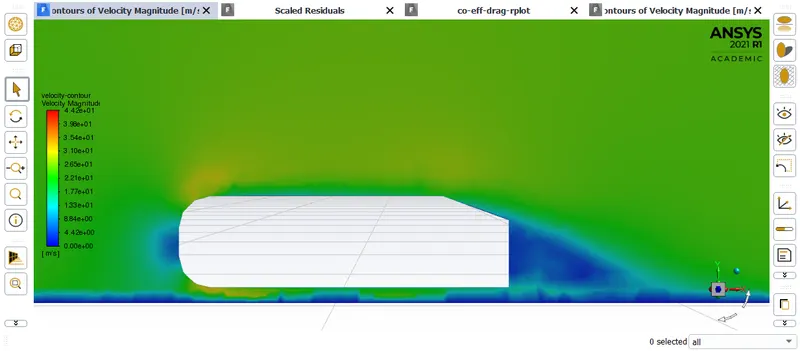
Post-processing helps to give the required contours with vector plots as well.
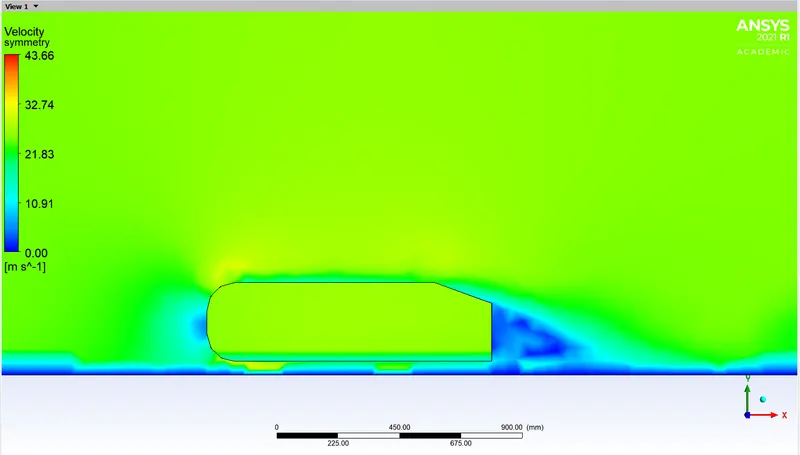
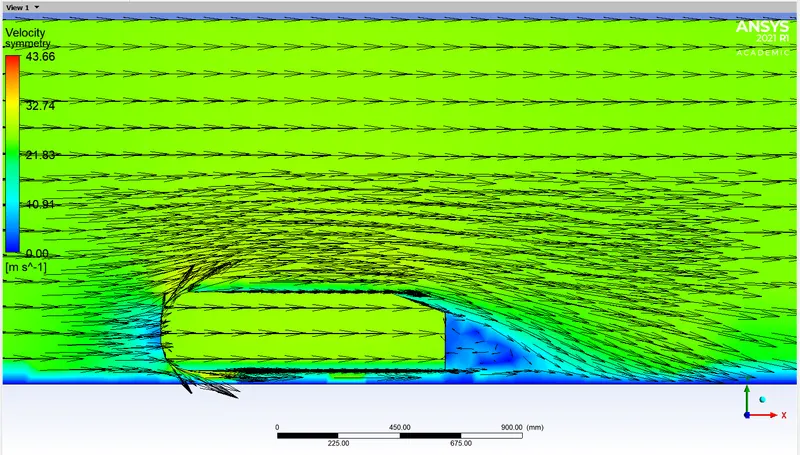
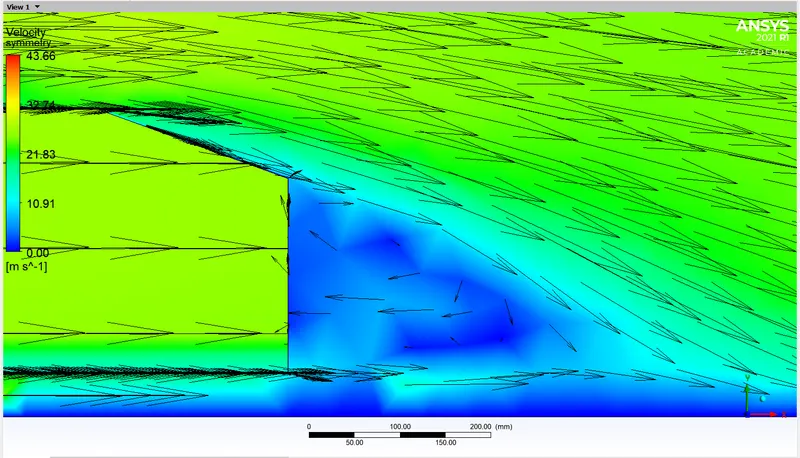
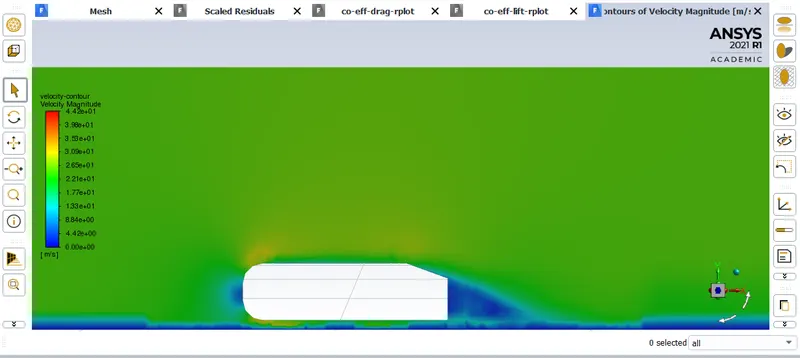
The back flow of the velocity vectors proves the rise of wake region.
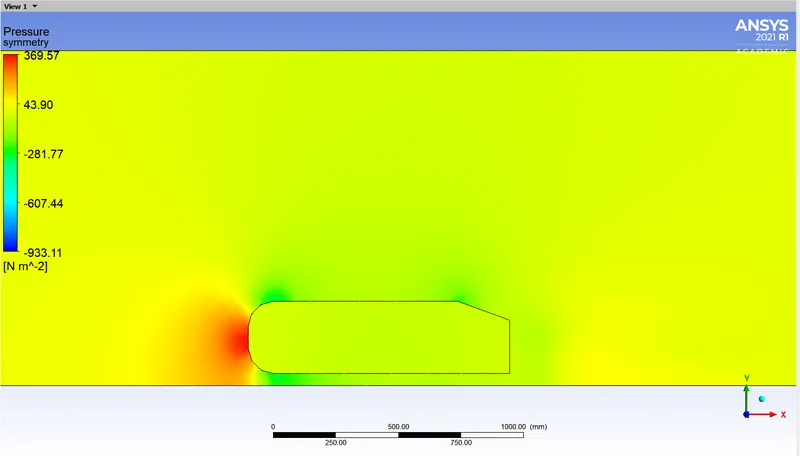
The wake region can also be proved with help of a pressure contour, since it shows a negative pressure at the rear side of the car body with the green shade.
Conclusion-
With the aid of the velocity and pressure contours the phenomenon of wake can be represented clearly. These contours best help to tweak our boundary conditions and regulate the vortices formed at the rear end to minimise its effects on the aerodynamics of the car body. Wake is a very critical region in a car's performance since it entails drag and lift.
Grid independency test-
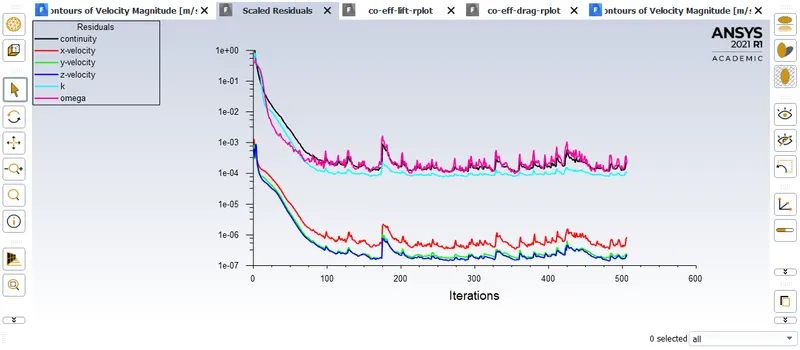
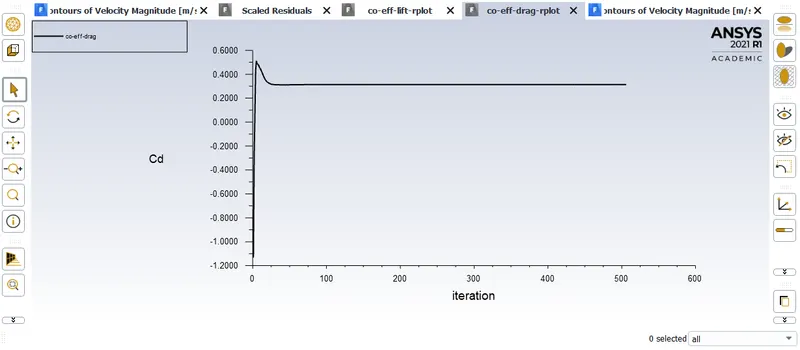
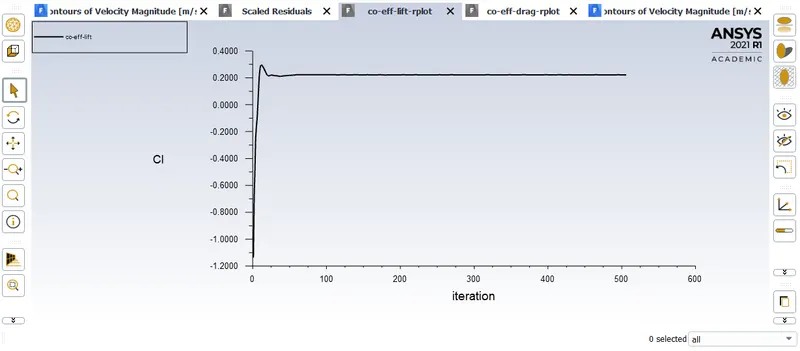
This test is performed by gradually increasing the number of elements in the inner enclosure to prove that the model is independent of the mesh size. The required plots and contours is examined to ensure the values remains unchanged despite of the change in mesh.
Element size = 50mm
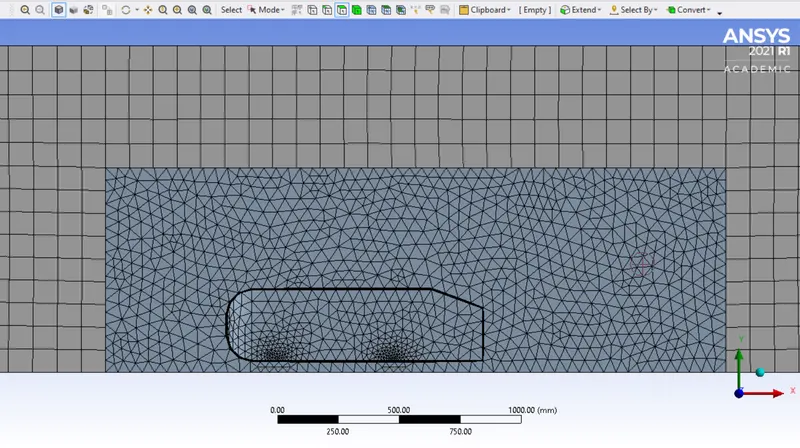
Element size = 35mm
Element size = 25mm
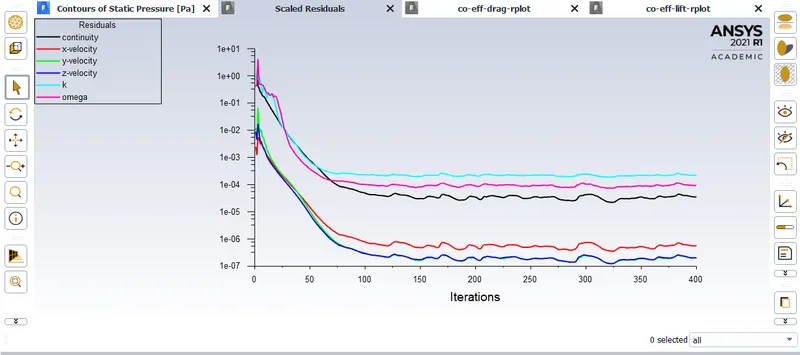
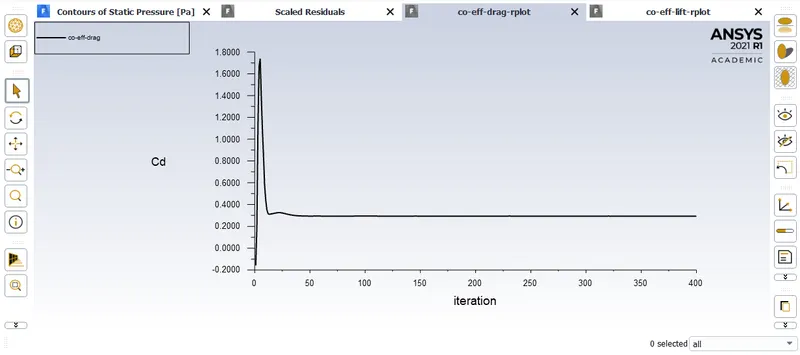
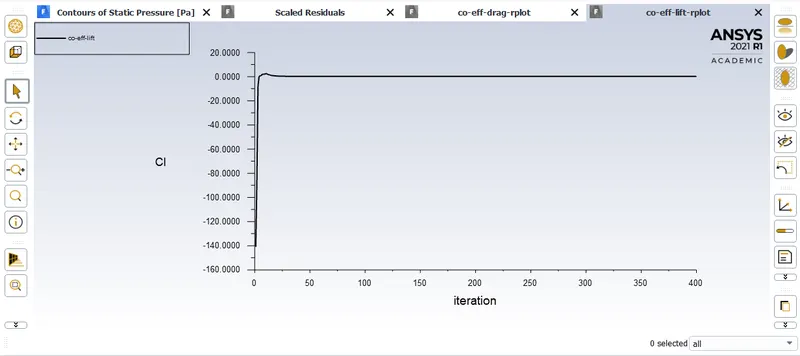
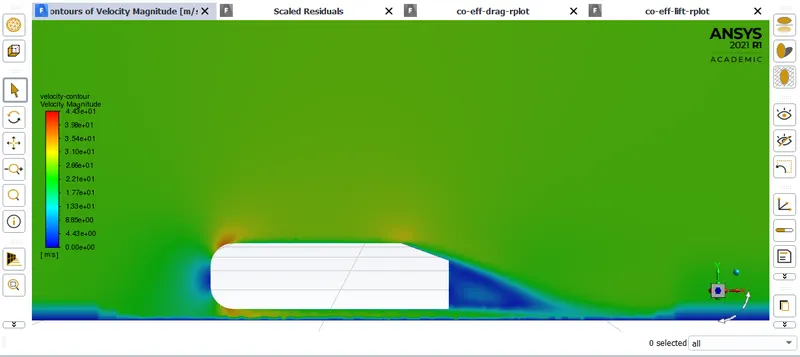
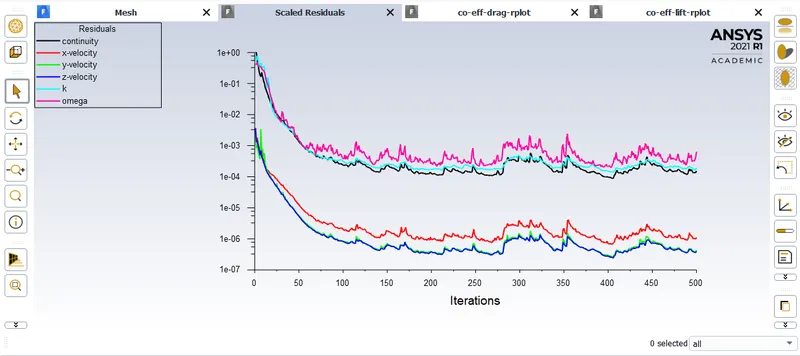
The co-efficient of drag for all the three cases is nearly equal to 0.33.
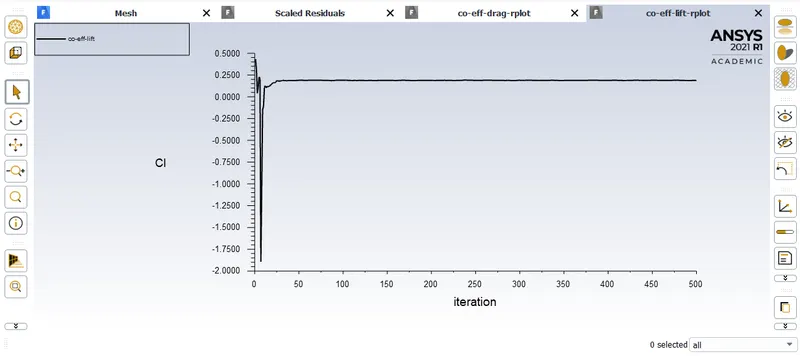
The solutions seems to have converged in every case.
The co-efficient of lift in the three cases is 0.17, 0.20 and 0 respectively(0 being for the case with the most refined mesh).
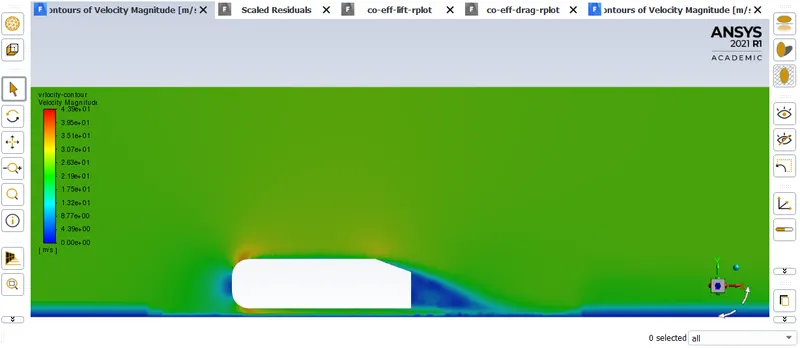
The velocity contour gets refined from being spready.
The solution is
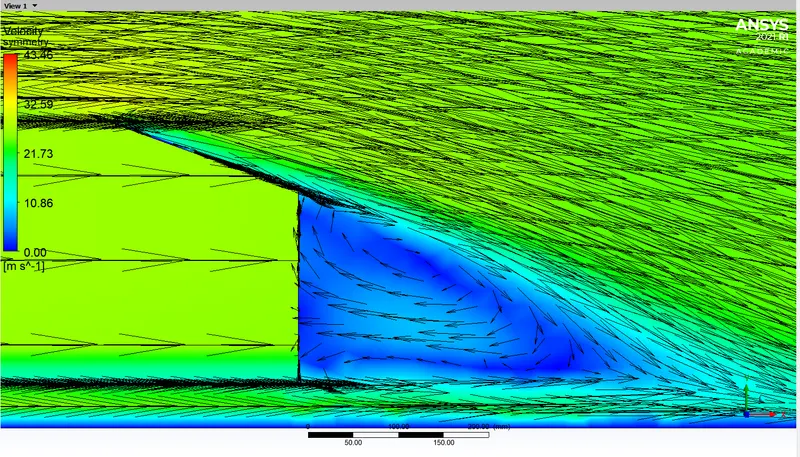
A very detailed velocity vector plot is captured using the element size of 25mm. Here we can see two vortices originating at the rear side of the car body. One because of the flow separation at the rear slant angle and the other because of the flow separation at the rear end of base of the car body.