Week 3 - External flow simulation over an Ahmed body.
Q1. Describe Ahmed's body and its importance.
The Ahmed body is a simplified, ground vehicle geometry of a bluff body type. It allows accurate flow simulation but retains some important practical features relevant to automobile bodies. Ahmed body gives direction about how to calculate the turbulent flow field around a car-like geometry using the Turbulent Flow, k-epsilon model interfaces.
The Ahmed Body was first developed by S.R. Ahmed in his research “Some Salient Features of the Time-Averaged Ground Vehicle Wake” in 1984. Ahmed body is the benchmark model for aerodynamics simulation tools.
Some of the key characteristics which can be obtained from simulating Ahmed's Body are Velocity Magnitude, Pressure Magnitude, Wake region, Drag Force, Lift Force.
Q2. Explain the reason for the negative pressure in the wake region.
In fluid dynamics, the wake region is the area behind an object that is moving through a fluid, such as air or water. When an object moves through a fluid, it disturbs the fluid flow, creating a region of lower pressure immediately behind it. This phenomenon is known as the "wake" or "wake turbulence."
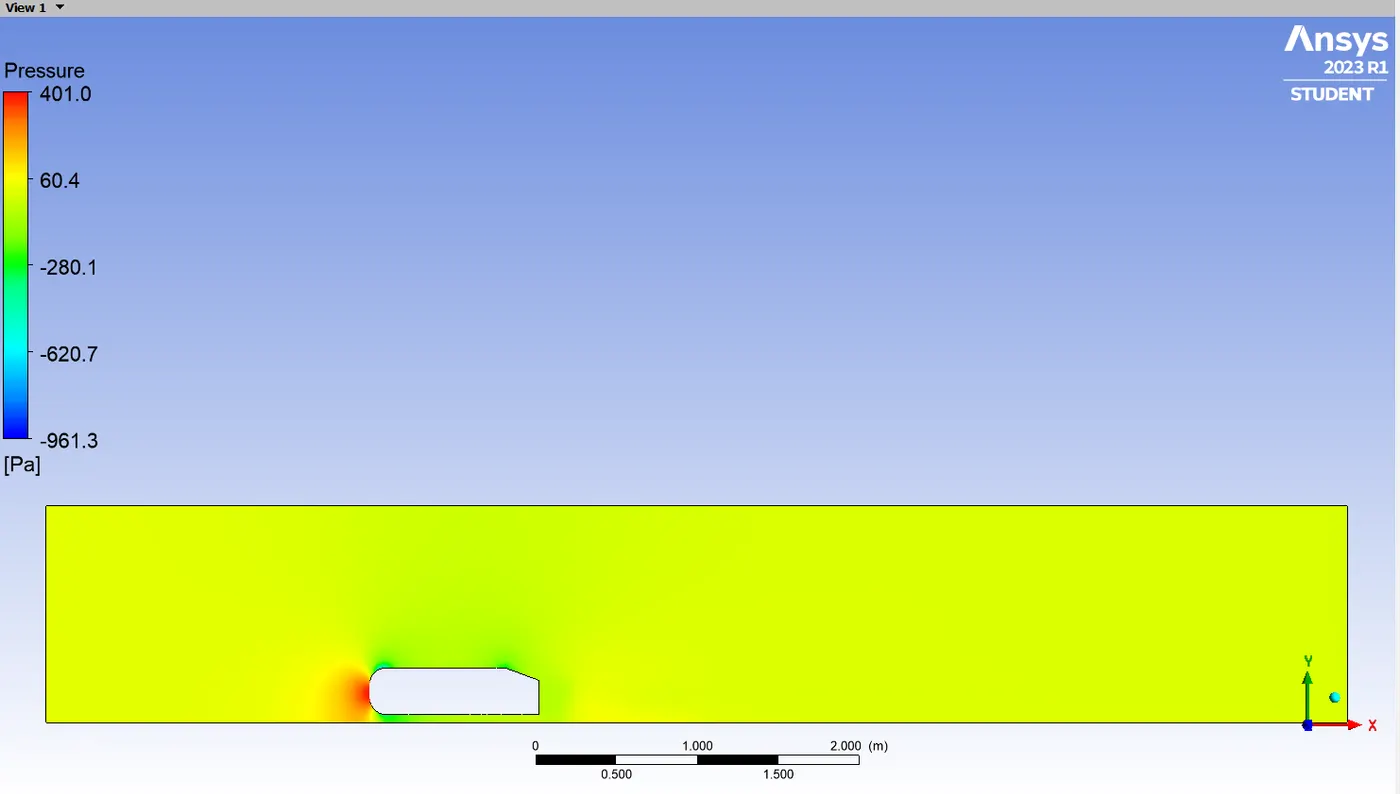
The reason for the negative pressure in the wake region can be understood through Bernoulli's principle, which states that in a fluid flow, an increase in the fluid's speed (velocity) corresponds to a decrease in its pressure. As the fluid flows around an object, it accelerates to fill the void left by the object's motion, and this increased velocity in the wake region results in lower pressure compared to the surrounding fluid.
To illustrate this, consider the flow of air around a moving object, such as an aircraft or a vehicle. As the object moves forward, the air in front of it is pushed aside and forced to flow around the object's shape. As the air moves around the object, its speed increases due to the need to fill the space left behind by the object. According to Bernoulli's principle, this increase in velocity leads to a decrease in pressure in the wake region.
The negative pressure in the wake region can have various effects depending on the context:
-
Aerodynamics: In the field of aerodynamics, understanding the wake region and its negative pressure is crucial for designing efficient and stable aircraft and other vehicles. The presence of low pressure in the wake can lead to drag, which opposes the motion of the object and affects fuel consumption and performance.
-
Vortex Shedding: In certain situations, the wake region may also be associated with the shedding of vortices. These vortices can create additional forces on the object, leading to unsteady behavior and potential vibration-related issues.
-
Water Flow: In hydrodynamics, similar phenomena occur in water flow around submerged objects, such as ships or underwater structures. Understanding the wake region's behavior is important for optimizing designs and preventing unwanted effects like turbulence and wake interference.
Overall, the negative pressure in the wake region is a natural consequence of fluid dynamics and is an essential consideration in various engineering applications to ensure efficiency, stability, and safety.
Q3. Explain the significance of the point of separation.
The point of separation refers to the location where the fluid flow detaches or separates from the surface of an object moving through the fluid. This phenomenon occurs when the fluid's velocity decreases to the point where it can no longer overcome the pressure gradient, leading to the fluid detaching from the surface and forming a separated flow region.
The significance of the point of separation lies in its influence on various fluid flow phenomena and engineering applications. Some key aspects of its significance are as follows:
-
Aerodynamics: In aerodynamics, the point of separation plays a crucial role in determining the lift and drag forces experienced by an aircraft or any other object moving through a fluid. When the fluid separates from the surface, it creates regions of low pressure (in the wake) and high pressure (on the object's surface). This pressure distribution affects the lift and drag characteristics of the object, which are essential in determining the object's stability, control, and overall aerodynamic performance.
-
Drag Reduction: Understanding and controlling the point of separation is vital for reducing drag in various engineering applications, such as in vehicles, aircraft, and ships. By optimizing the flow pattern and delaying separation, engineers can reduce the drag forces acting on the object, leading to improved fuel efficiency and performance.
-
Lift Enhancement: In some cases, the point of separation can be strategically controlled to enhance lift generation, such as in the design of airfoils used in aircraft wings. By manipulating the flow separation, engineers can enhance lift without sacrificing stability, leading to more efficient and maneuverable aircraft
Simulation Steps
1. Baseline Simulation
Ahmed Body Model is loaded in Ansys Fluent - Spaceclaim
Unit set to Meters
Using Enclosure Tool to create a wind tunnel
Unchecking Symmetric Dimensions
For a Wind Tunnel ,
Standard Dimesnions are taken.
Distance from Front Face - 2m
Distance from Back Face - 5m
Distance from Bottom Face - 0m
Distance from Top Fcae - 1m
Distance from Side Faces - 0.5 m each
Wind Tunnel is created
We do not want mesh inside the Ahmed body, hence we are using Supress for physics on Ahmed Body
Selecting Plane at Origin , Cross Section View
2. Meshing
Click on Generate Mesh , make sure whether everything is captured correctly using
Creating Named Selection
3. Setup Physics
Pressure Based Solver is selected, as the inlet velocity here is 25 m/sec , the mach no becomes 0.07, which is very less than o.3.
Boundry Condition - Inlet Velocity - 25 m/sec
Turbulence Model k-epsilon , Energy Equation - on
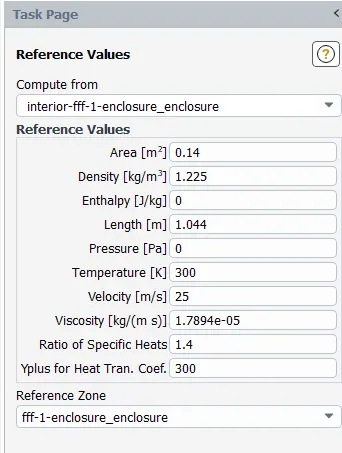
Changing reference values as per geometry of Ahmed Body
Area and Length are calculated.
Hybrid Initialization is done.
Post Processing
Creating a Cut Section , Plane Normal to z-axis
Create-Plane- Point and Normal
Creating Velocity Contours at cut-plane-z
Solution Animaition Velocity Animation
Running simulation for 500 Iterations
Residuals
Coefficient of Drag
Computed Value of Cd - 0.37010368
Coefficient of Lift
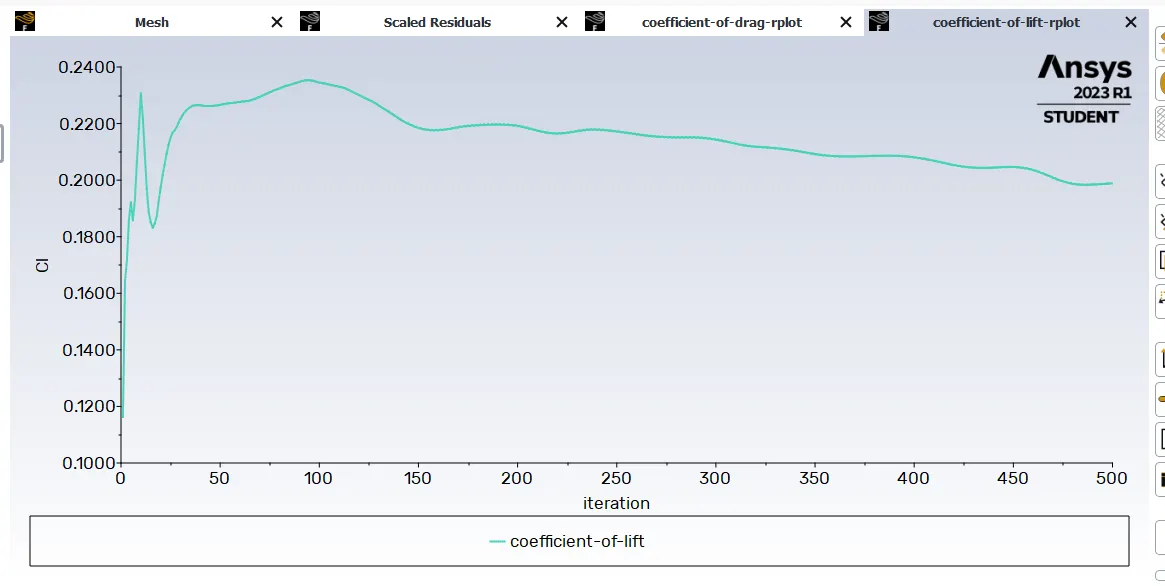
coefficient-of-lift = 0.19881537
Velocity Contour
Post Processing
Car Wall - Variable - Pressure
Pressure is shown with the help of various colours on the car wall
Inserting a cut-plane, Colour variable velocity
Pressure Countor
Inserting Vectors using black constant colour, Variable - Velocity
we must create lines after, before and above of ahmed body to measure the velocities.
Creating two lines
Insert - Chart - Series - Location- Line1&2
Extracting Data
Improving Mesh Quality
Case -2 Refined Mesh
Baselined Setup is duplicated and renamed.
We need to add a region of refinement in wake region, which is called as local refinement.
Another enclosure is created
Looking at the cross section view
If we look the cross section, from the pattern of hatches we can identify that there is an overlapping element present.
Tool - Interference
Share Topology - Share
Mesh - Clear Generated Data - Reset
Generate Mesh
Insert Method - Multi Zone - Outer Side
Mesh Element and Max. Size = 100 mm
Sizing for Inner enclosure - 50mm
Insering Sizing for Ahmed Body
Further Mesh element Size is reduced to 5mm for smaller bodies
Named Selection
Adding a boundry layer mesh
Creating Inflation Layer
To calculate Total Thickness ,
a1 = 5 , r = 0.2 , n = 6
Corrected Formula
( Here r is greater than 1 hence another formula for sum of GP is used)
\frac{5\cdot\left(1.2^{6}-1\right)}{1.2-1}
Correction
Sn = 49.64 mm = Total Thickness
Boundry Layers are created
Creating Named Selction
Fluent
Result
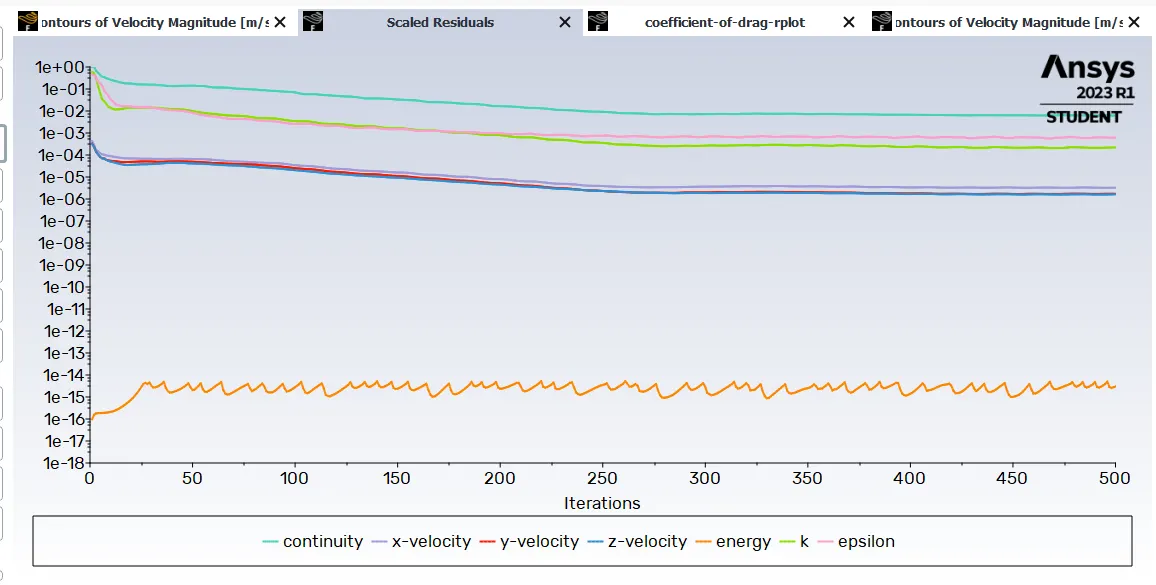
Scaled Residuals
Coefficient of Drag
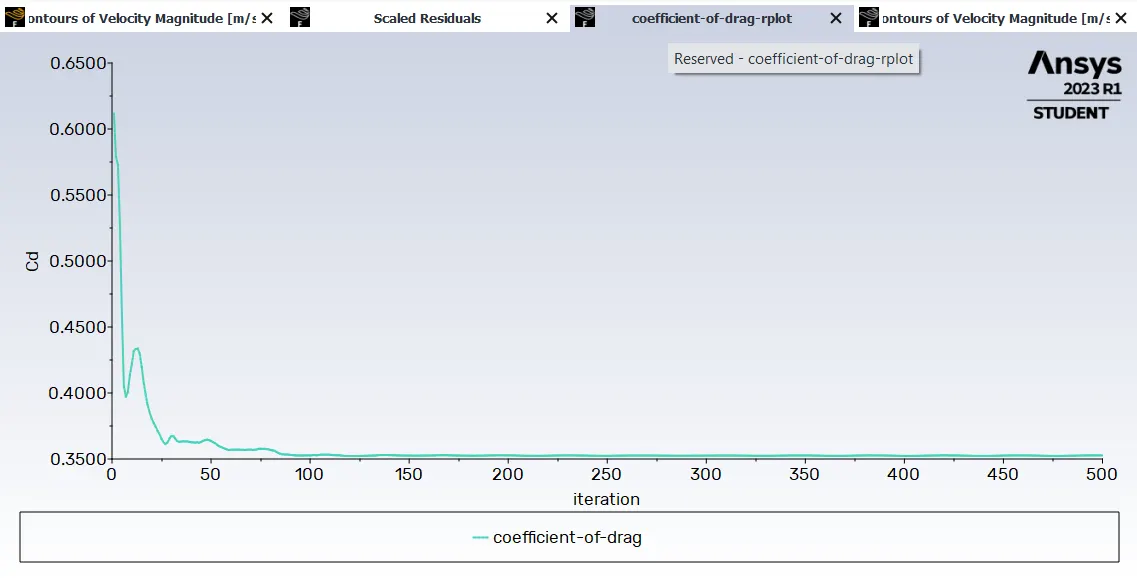
coefficient-of-drag = 0.35267681
Coefficient of Lift
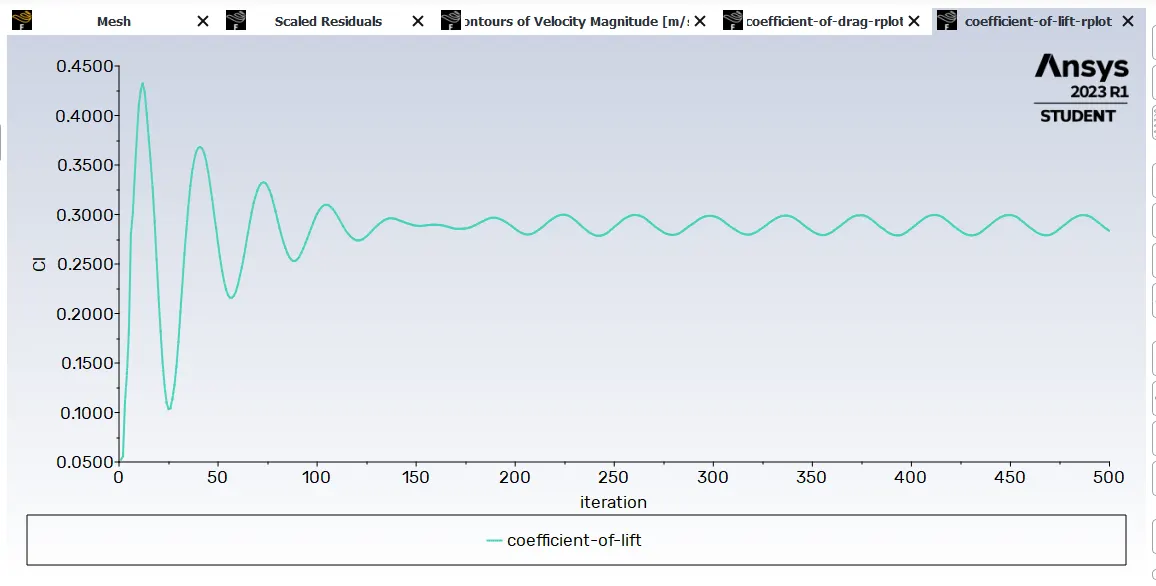
coefficient-of-lift = 0.28333815
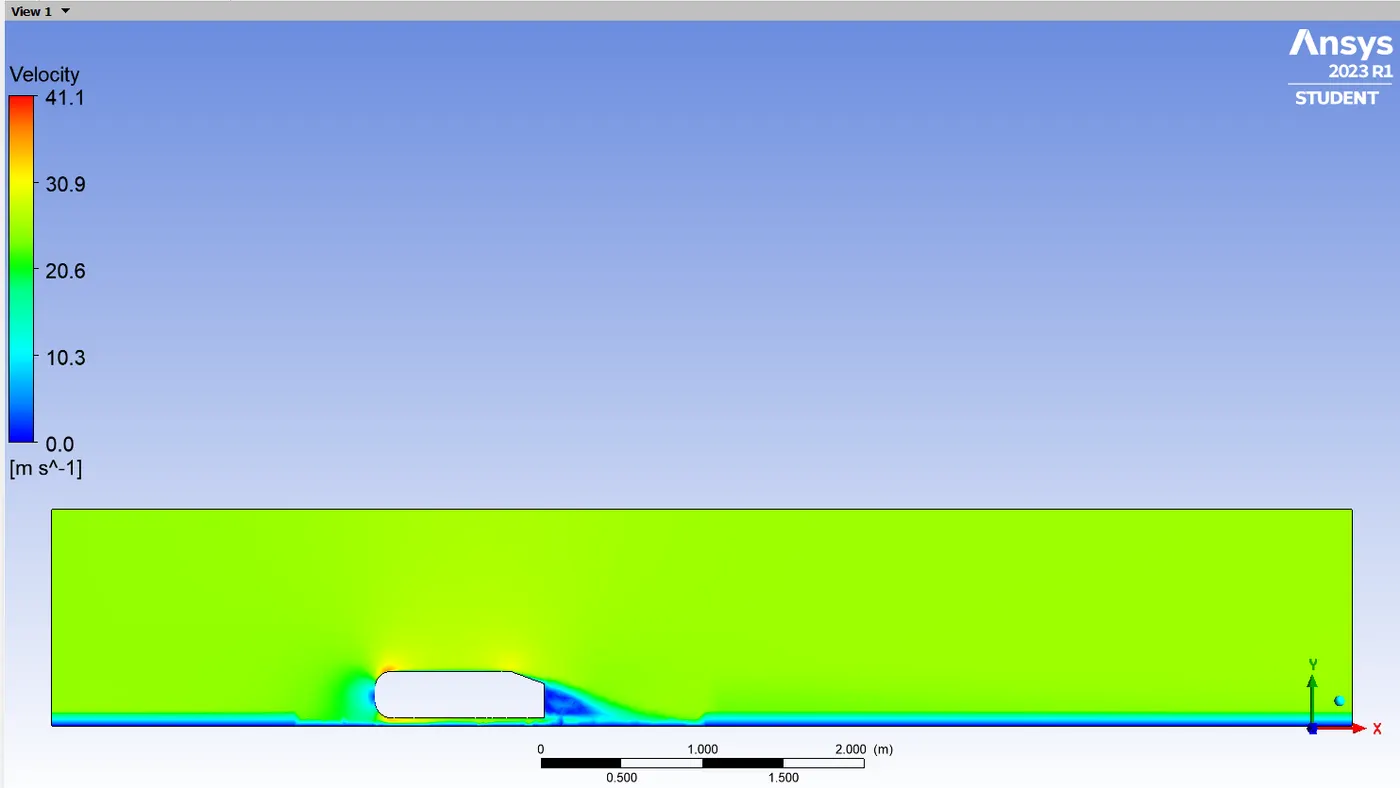
Velocity Contour
Pressure Contour
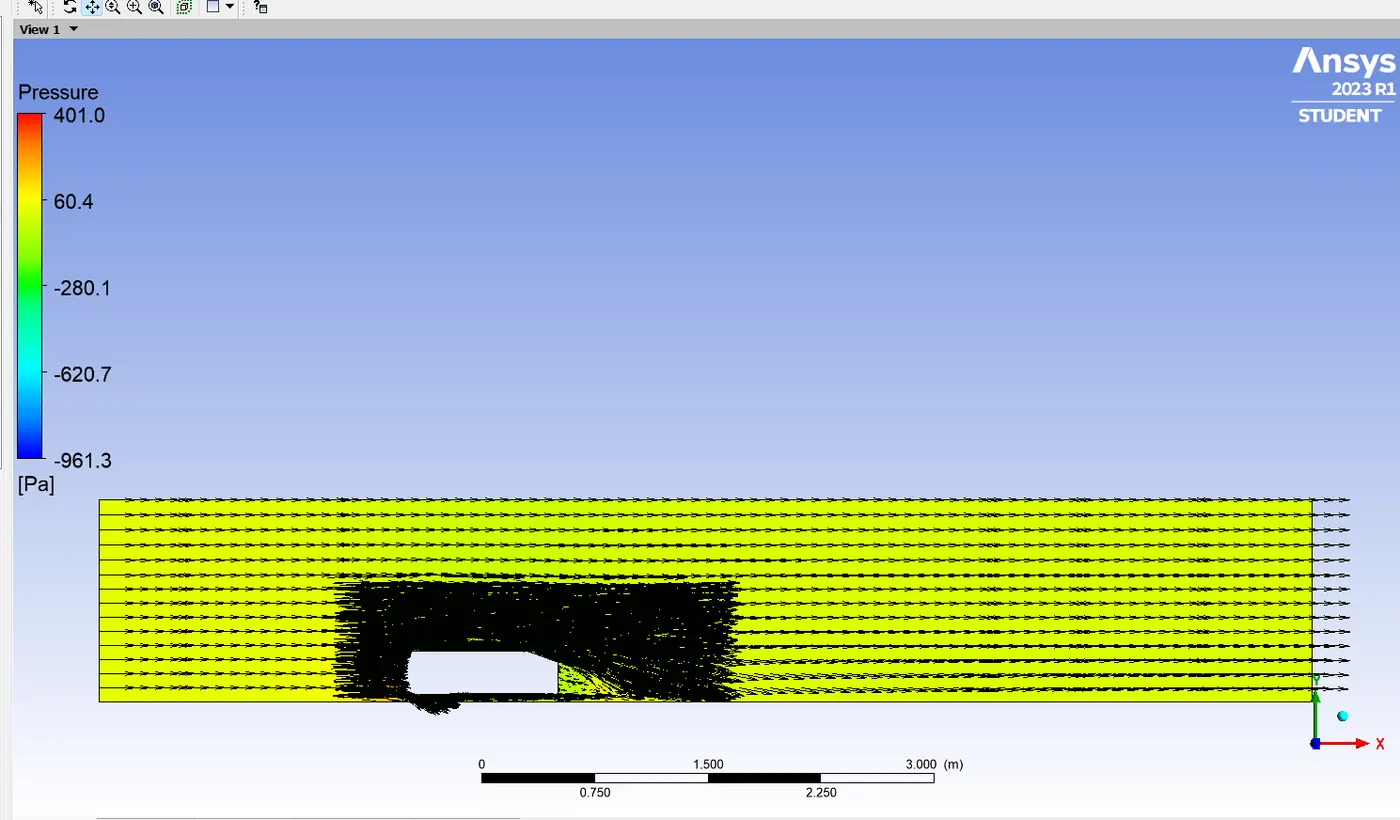
Vector Plot
Refined Case -2
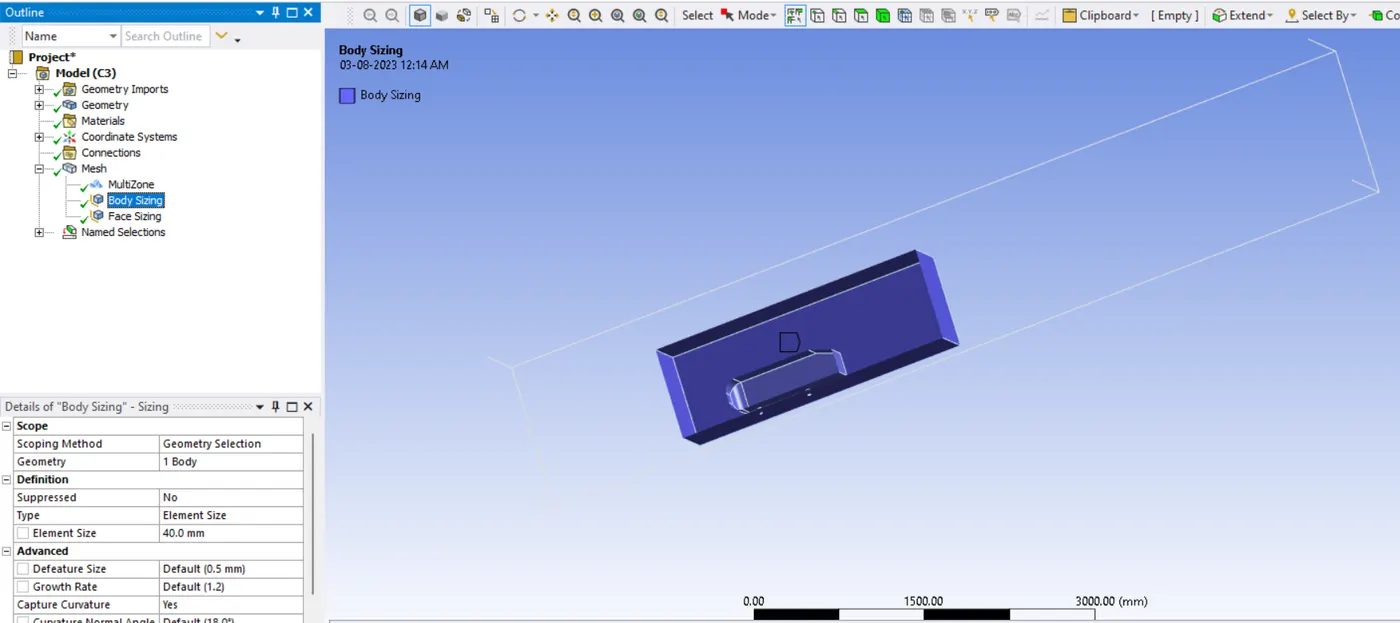
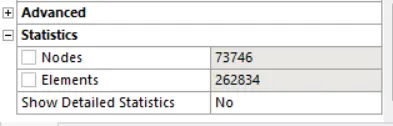
Body Sizing - 40 mm
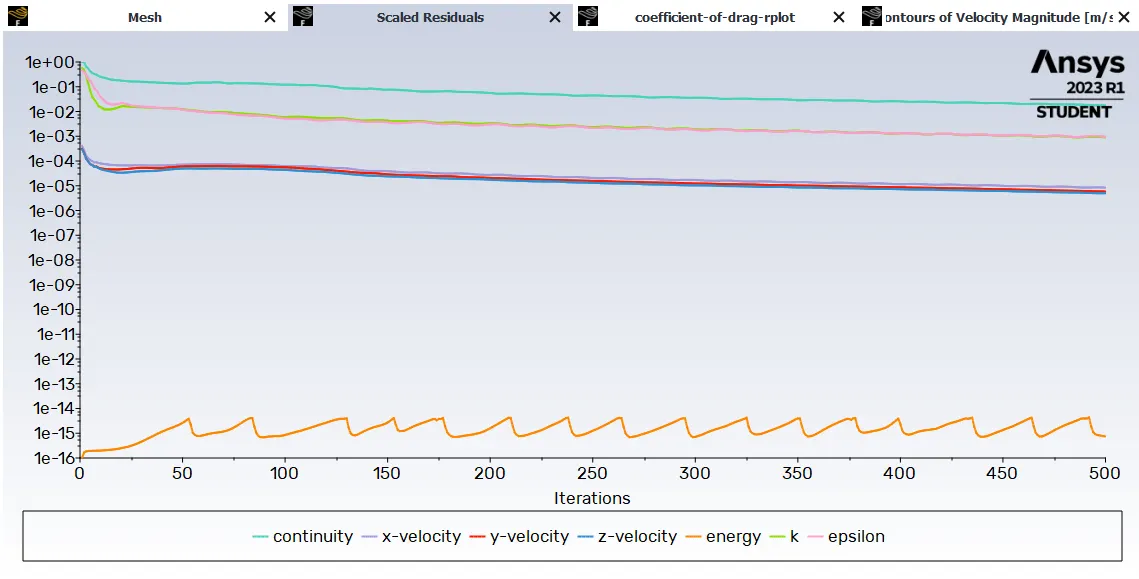
Scaled Residuals
Coefficient of Drag
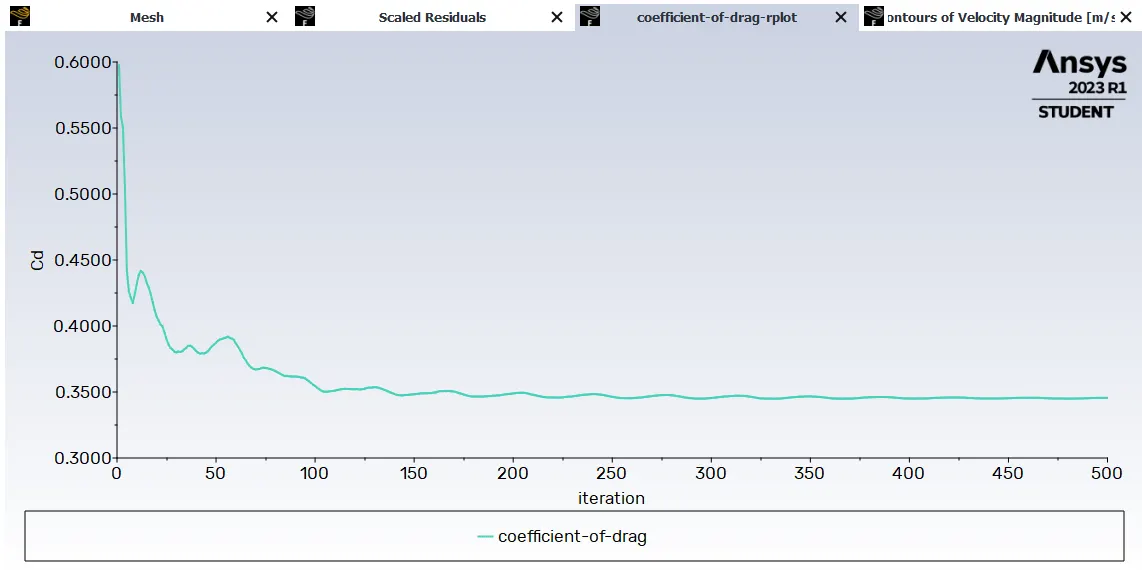
coefficient-of-drag = 0.34555084
Coefficient of Lift
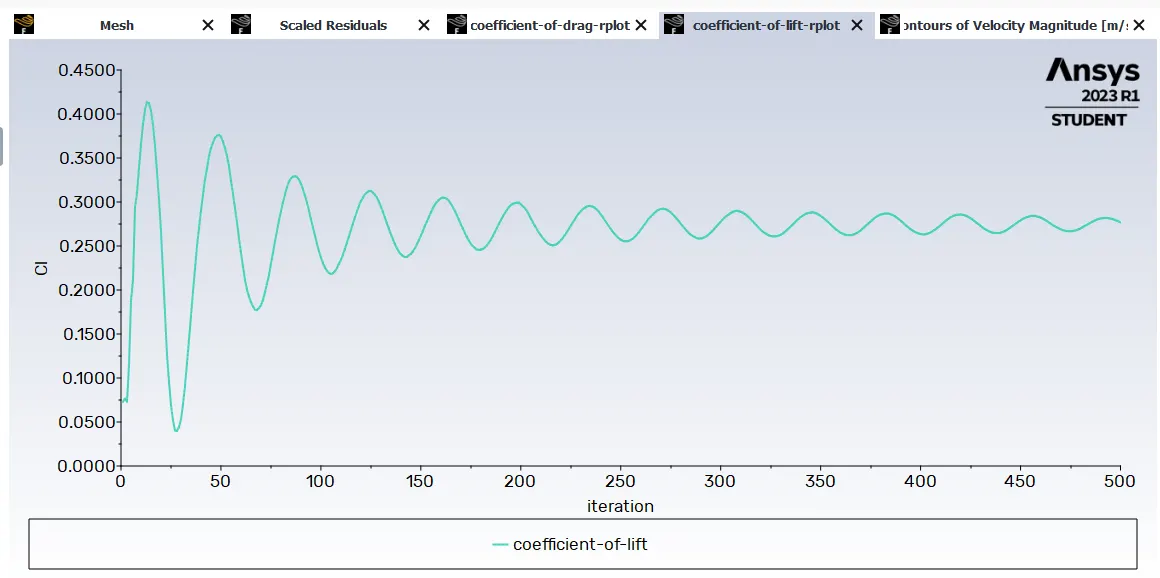
coefficient-of-lift 0.27684529
Velocity Contour
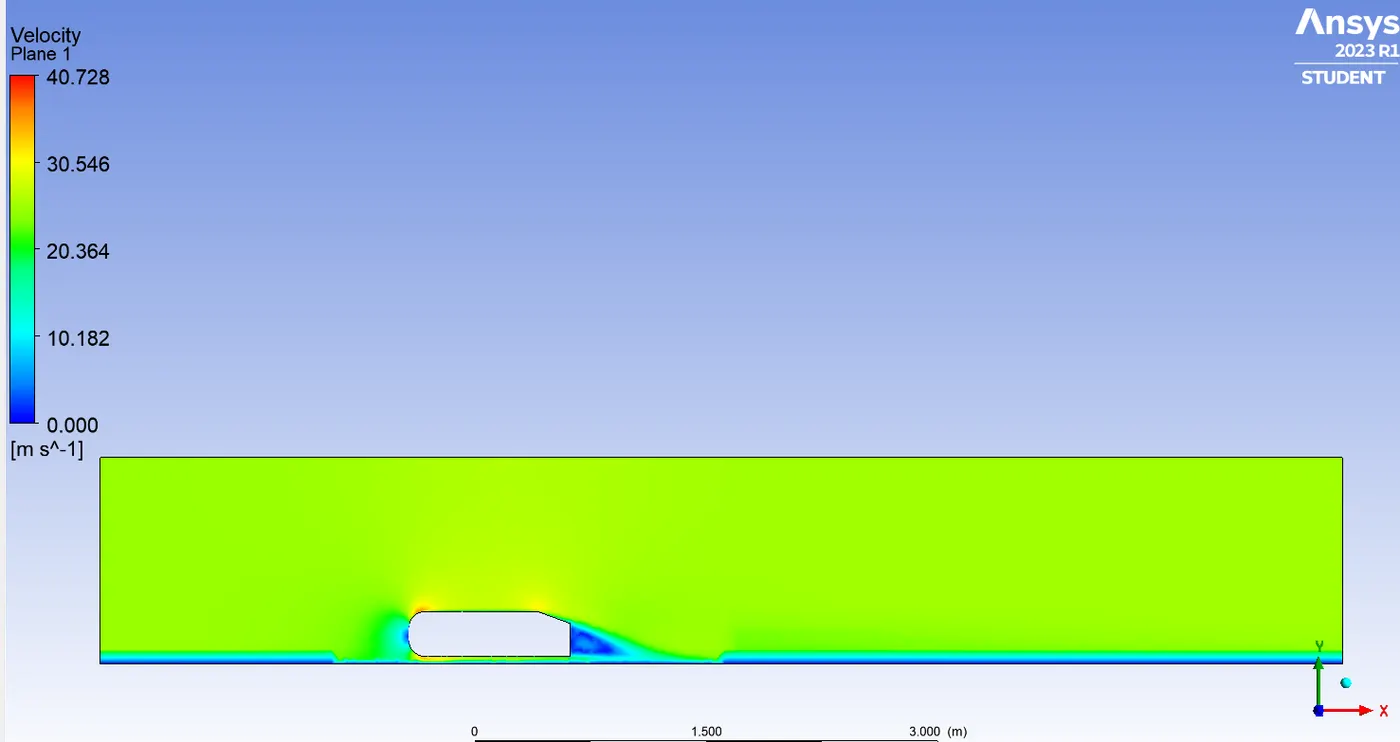
Pressure Contour
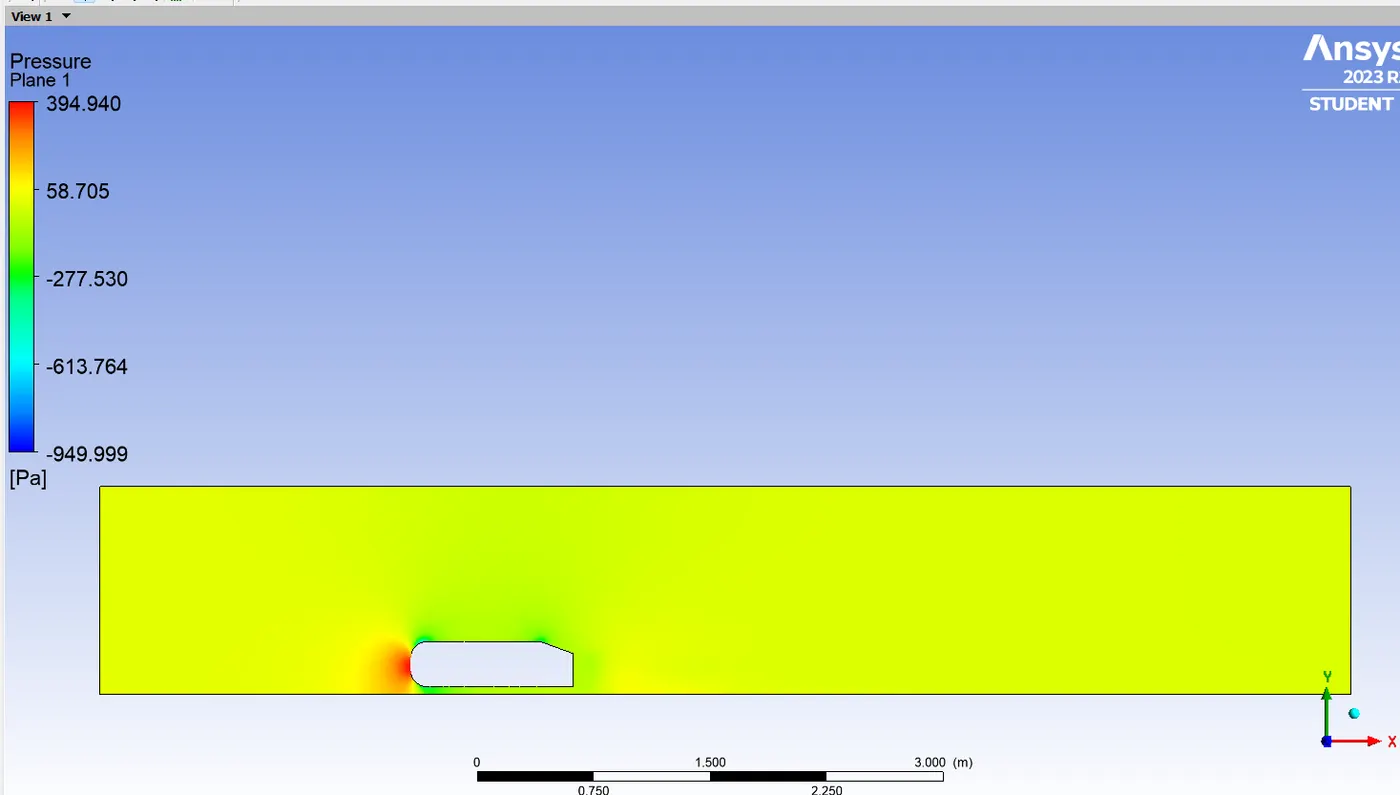
Vector Plot
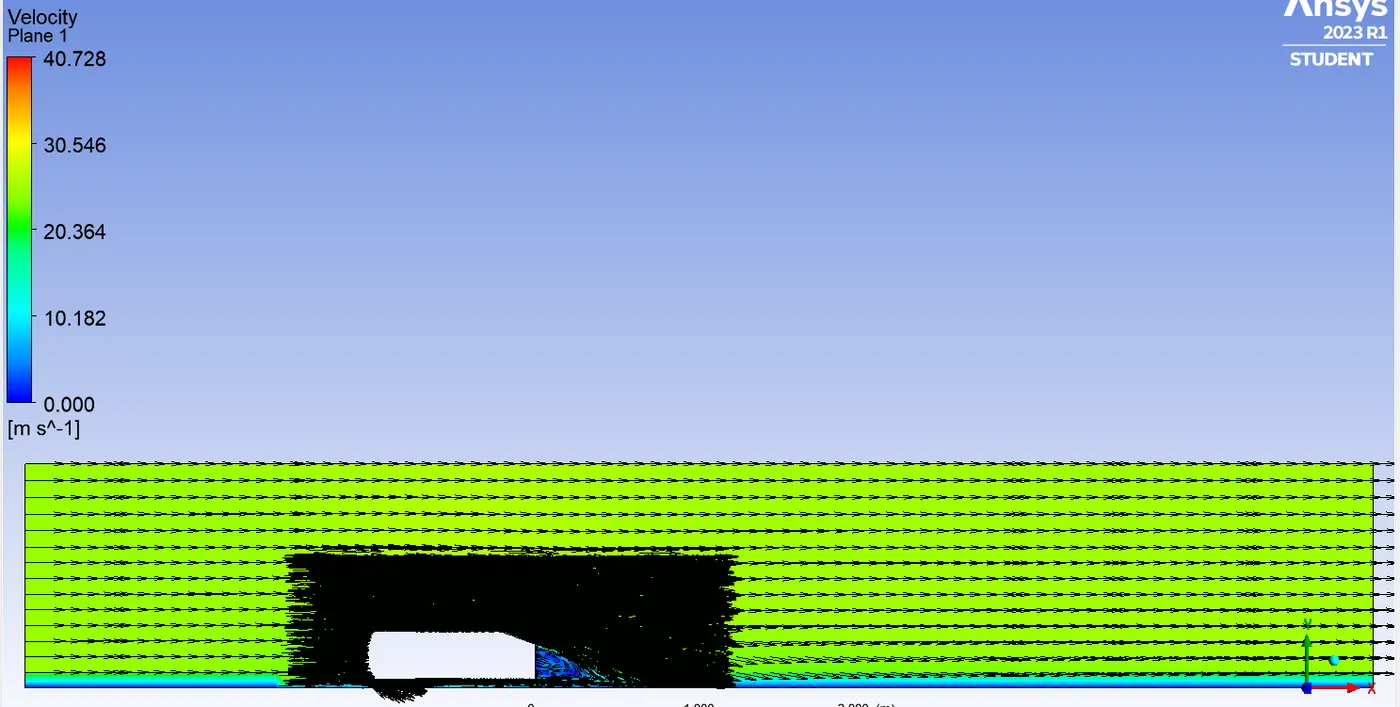
Refined Case -3
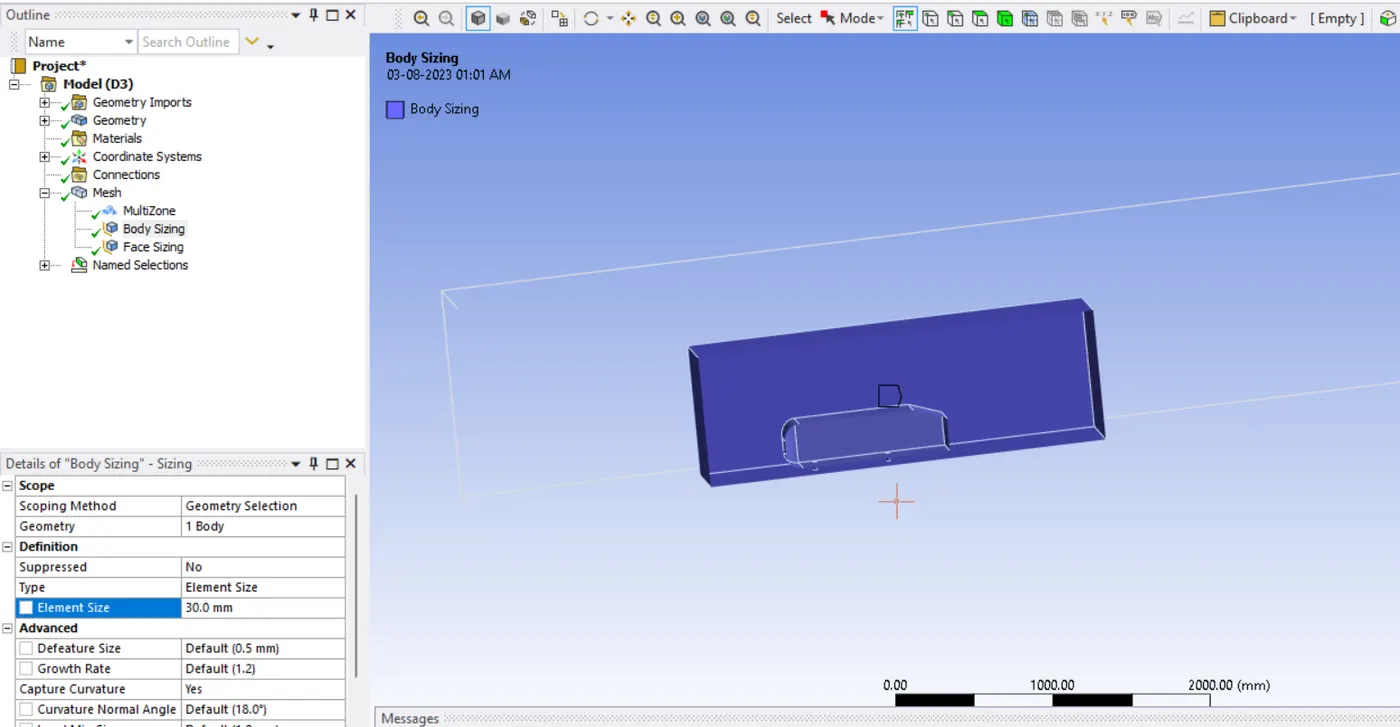
Body Sizing - 30 mm
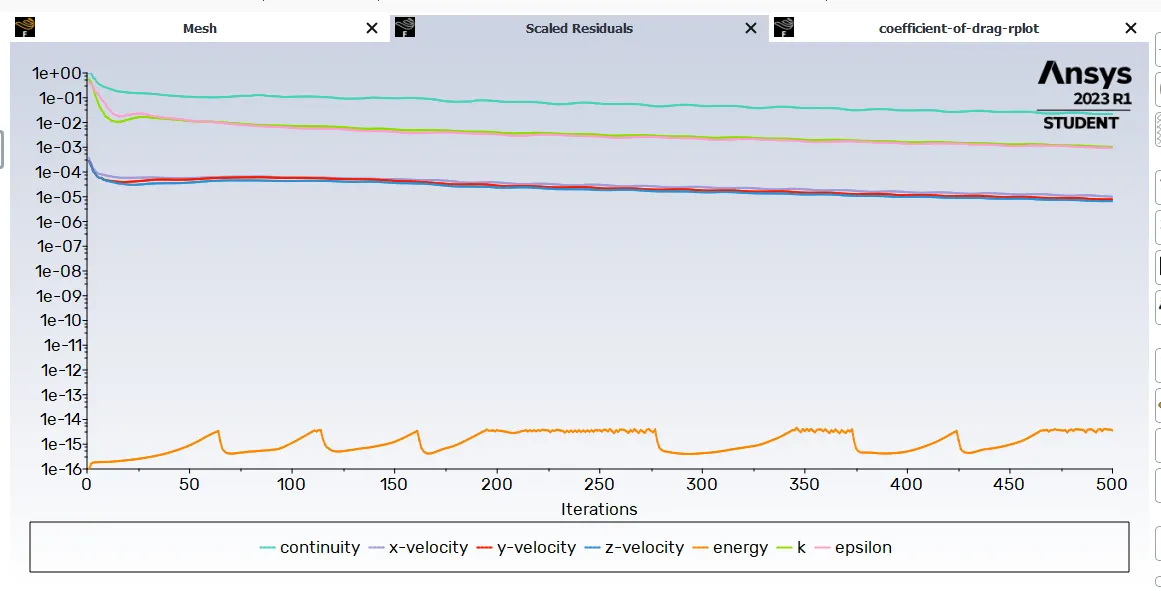
Scaled Residuals
Coefficient of Drag
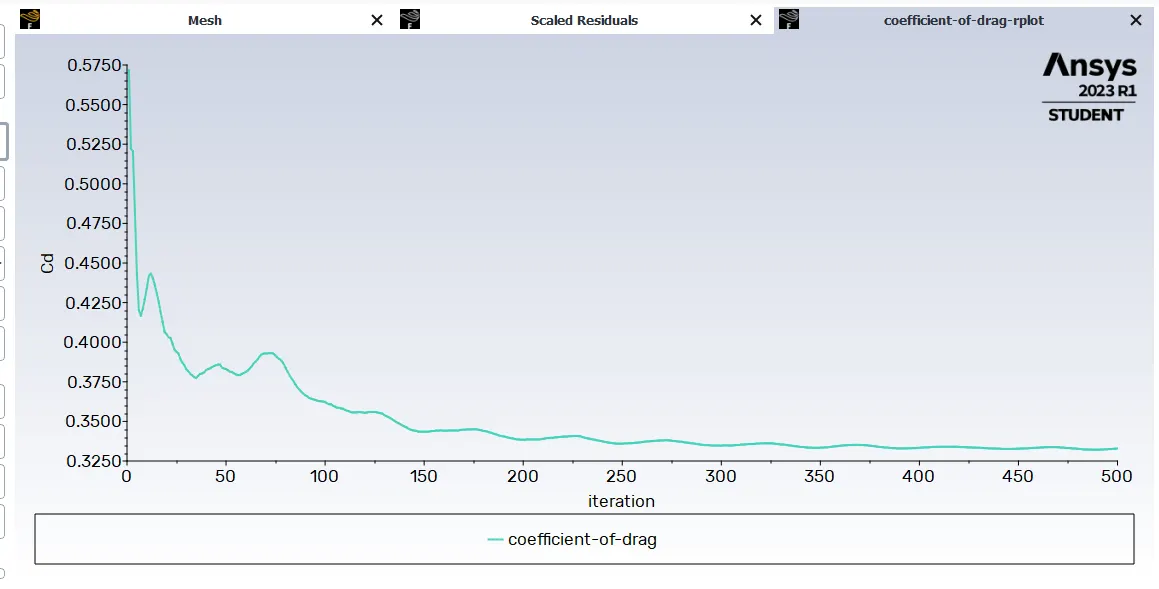
coefficient-of-drag = 0.33292887
Coefficient of Lift
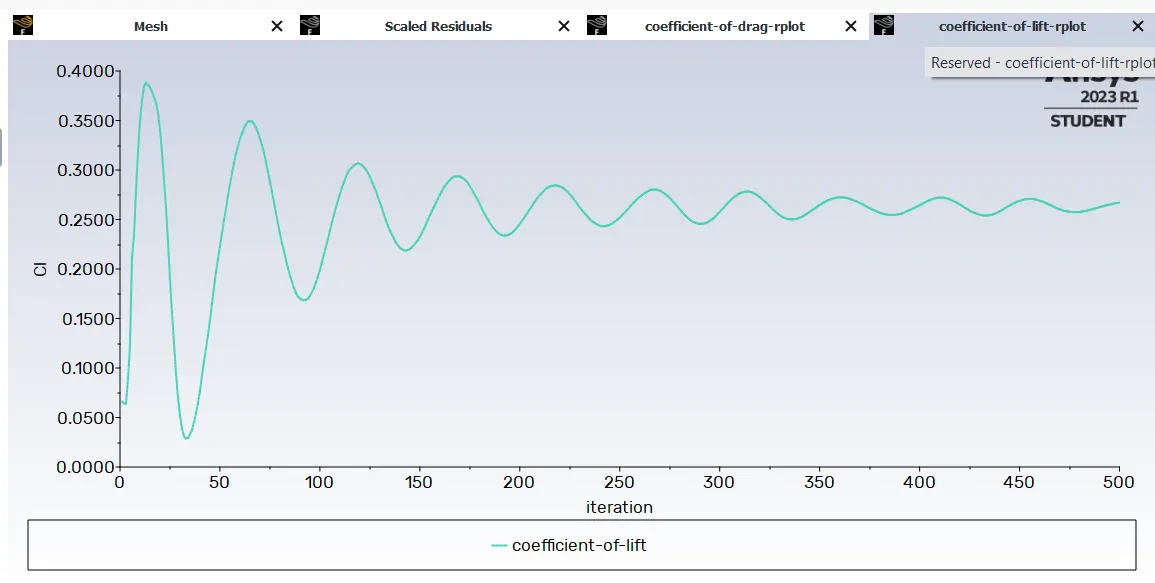
coefficient-of-lift = 0.2669546
Velocity Contour
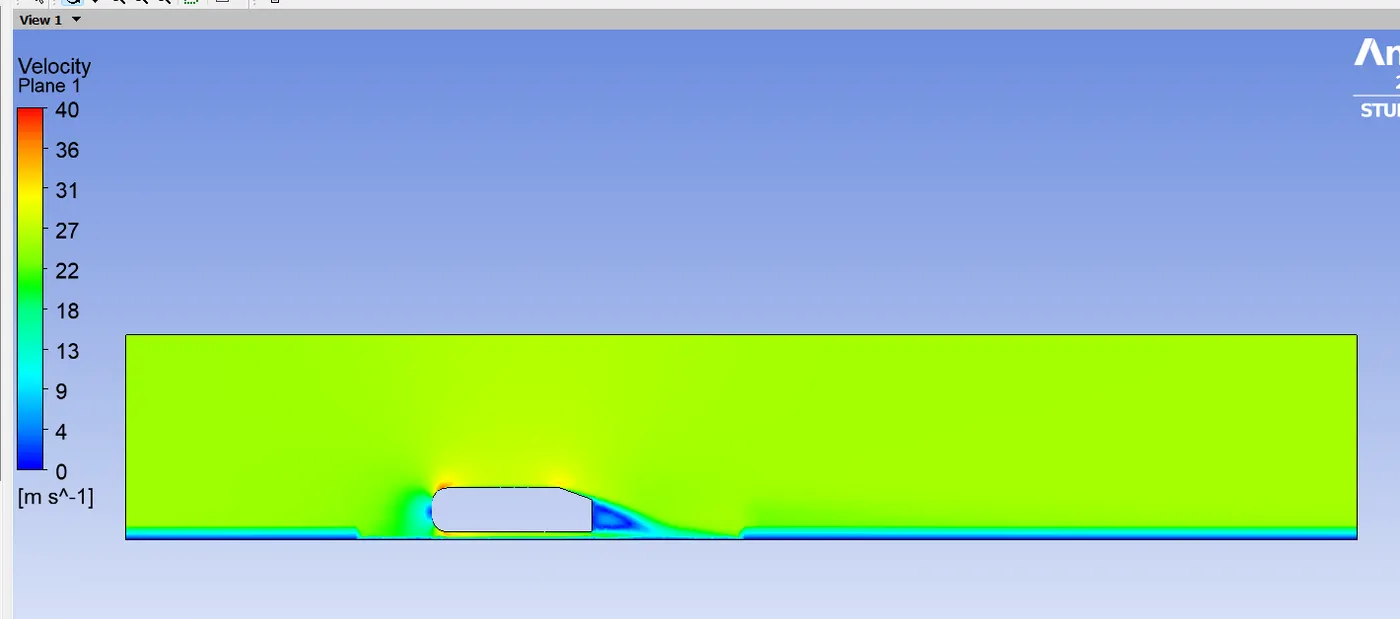
Pressure Contour
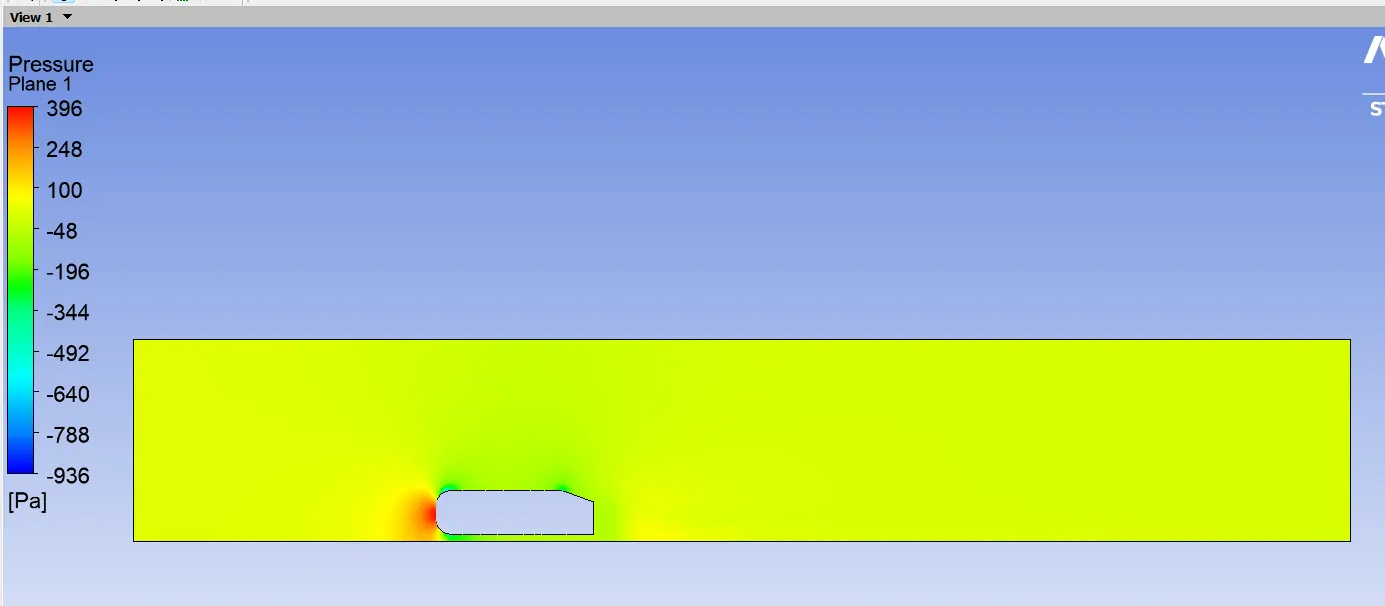
Vector Plot
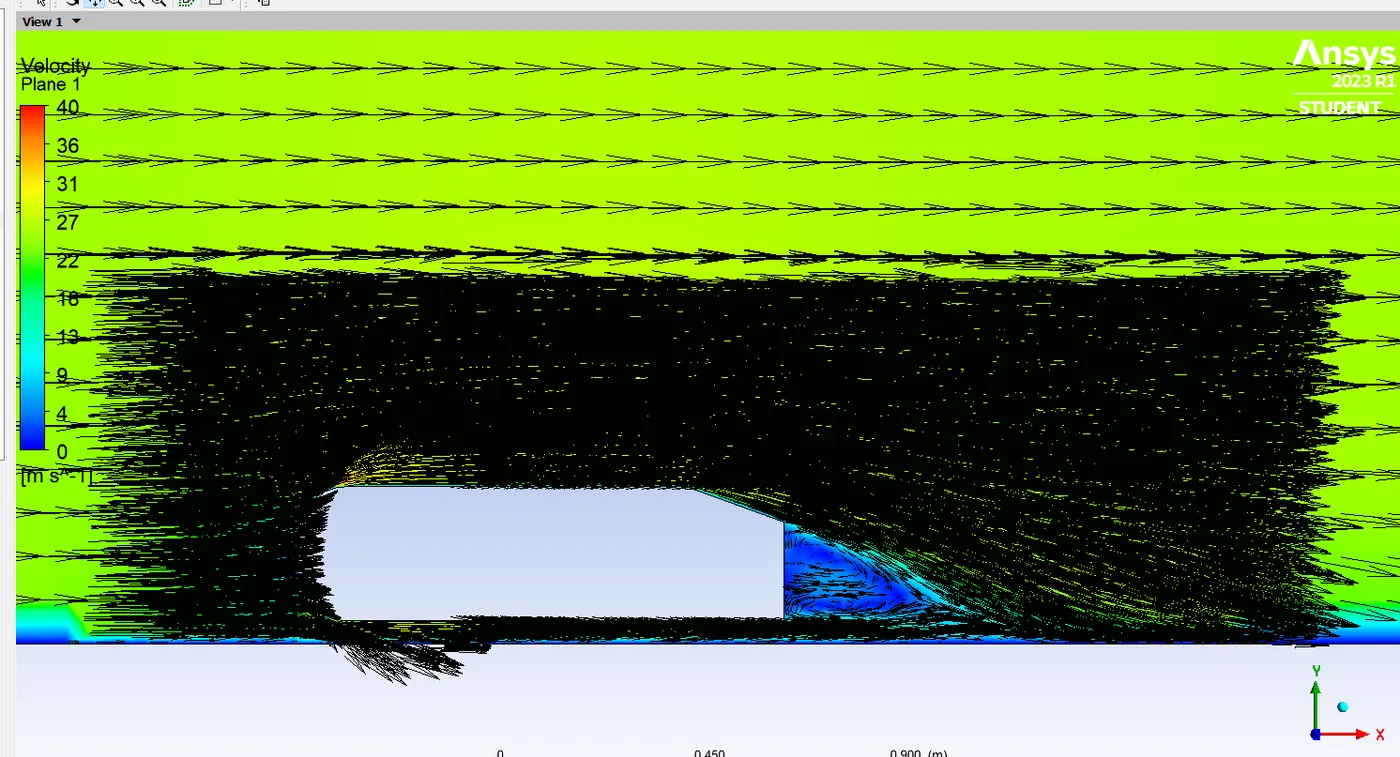
Refined Case - 4
Half Geometry
Mesh Size
Body Sizing - 33 mm
Face Sizing - 7 mm
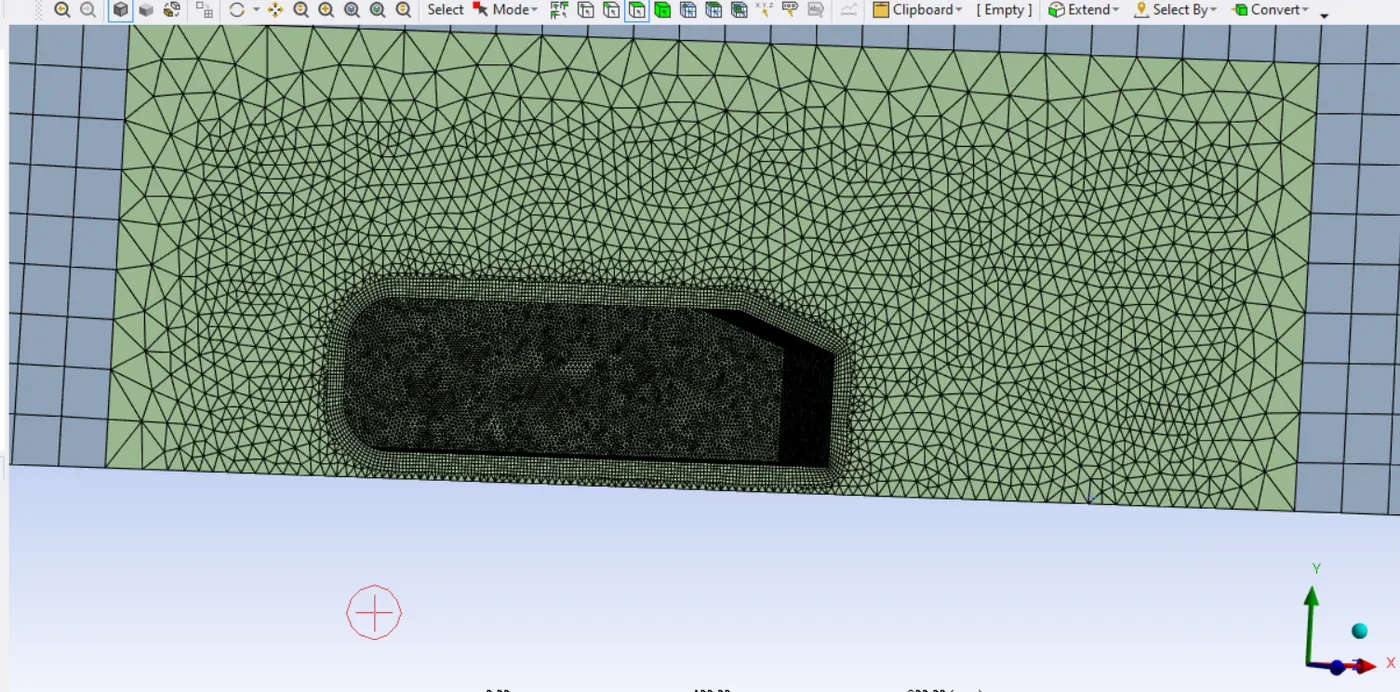
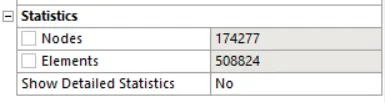
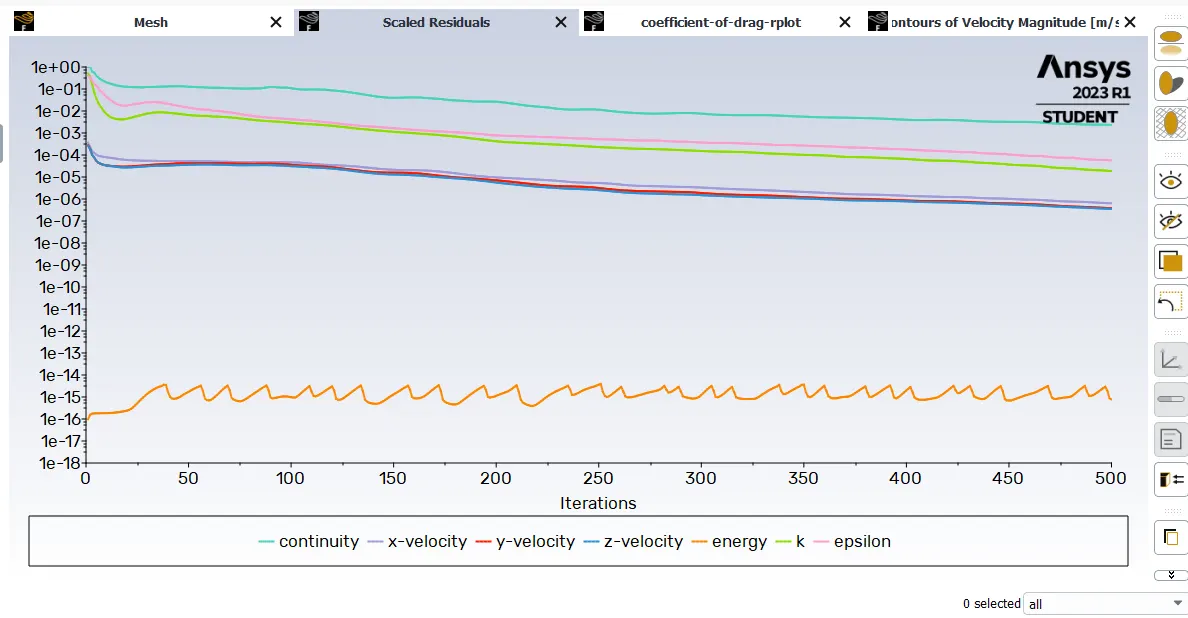
Scaled Residuals
Coefficient of Drag
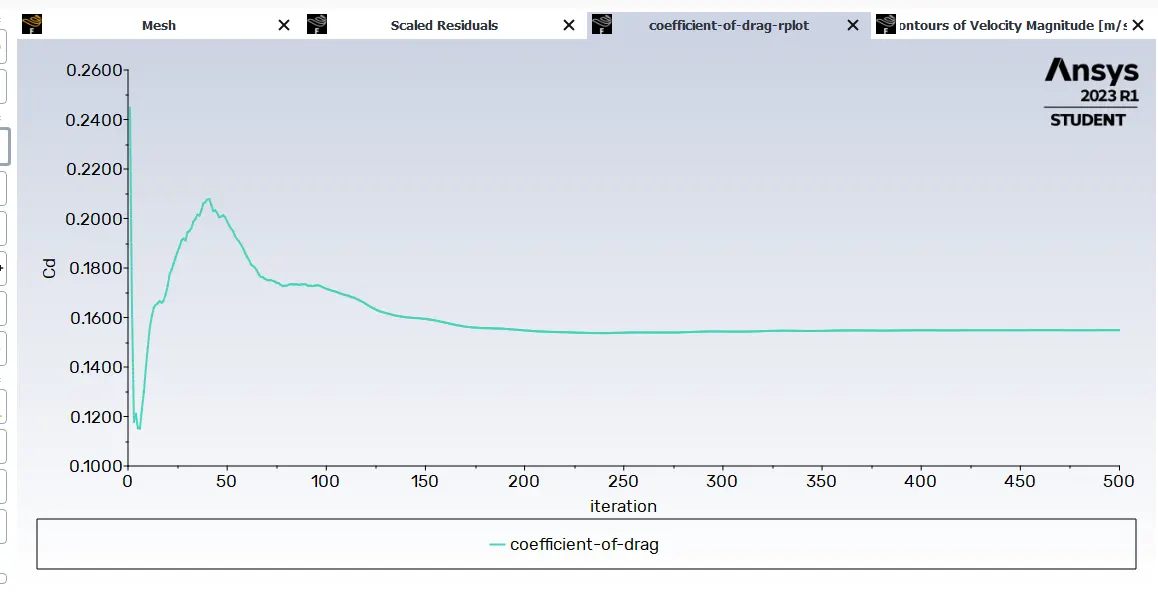
coefficient-of-drag = 0.15489402
Coefficient of Lift
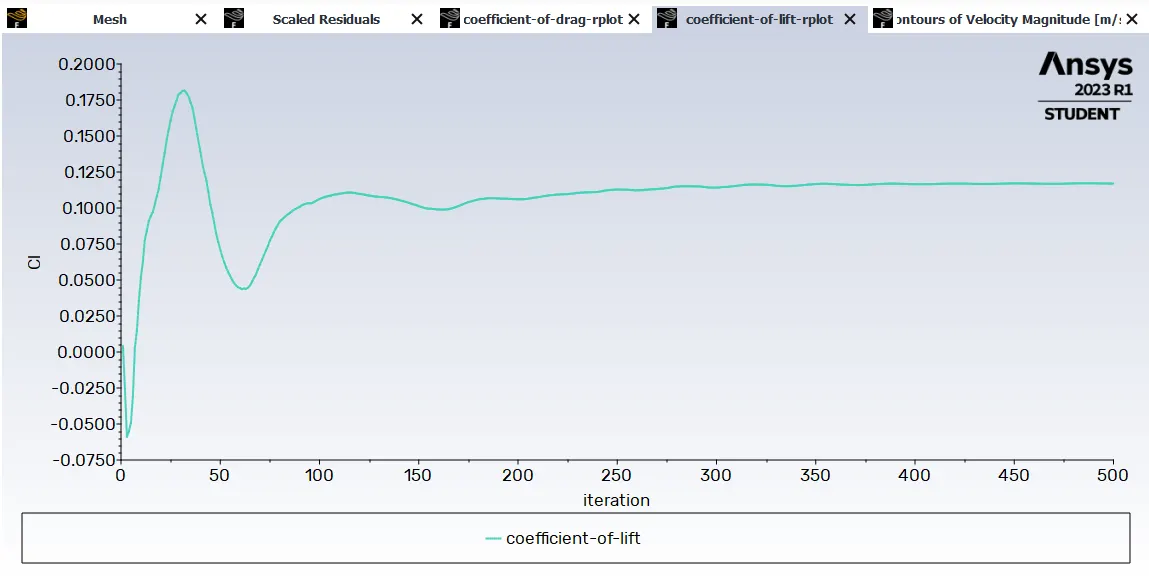
coefficient-of-lift = 0.11692308
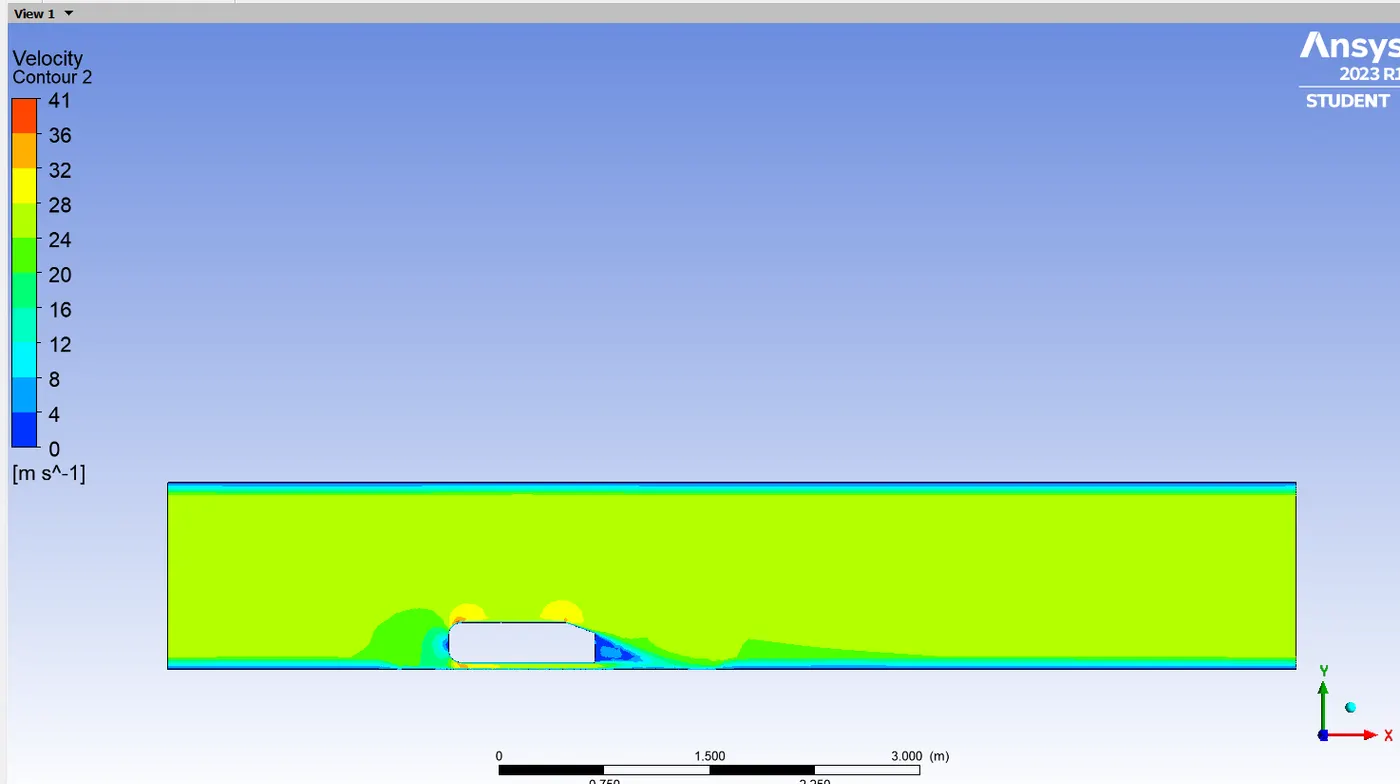
Velocity Contour
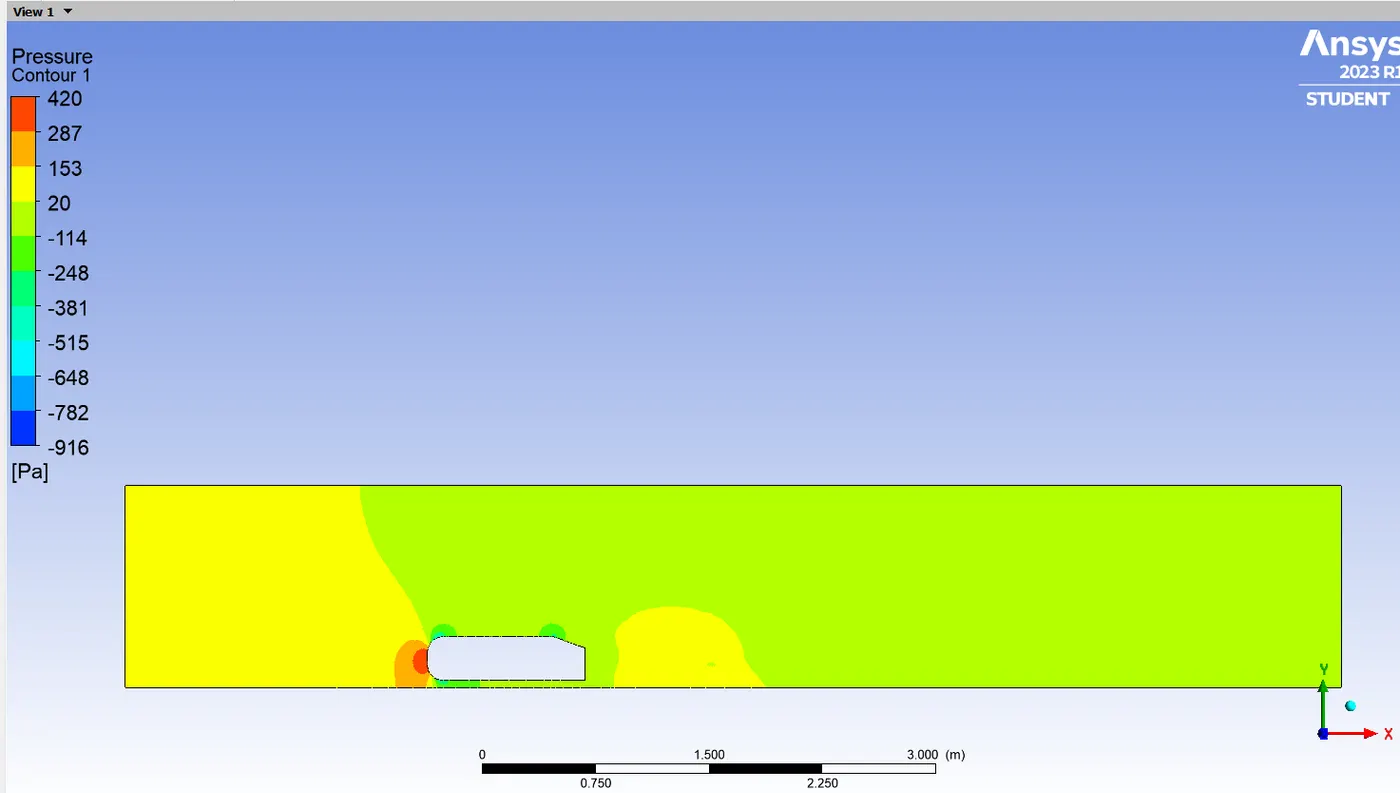
Pressure Contour
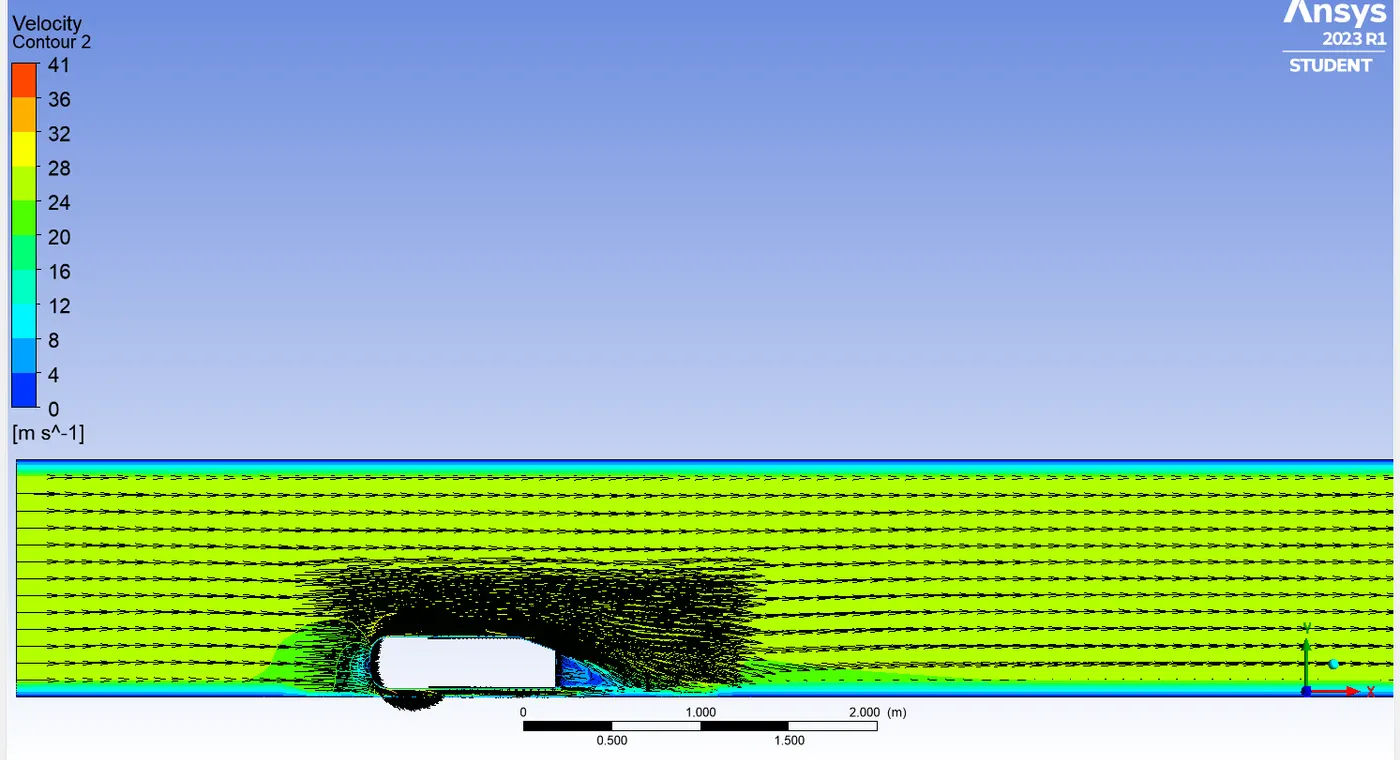
Vector Plot
The Grid Independency Test
| Case No | Mesh Details | No. of Elements | Coefficient of Drag | Coefficient of Lift |
| 1 | Baseline Setup | 0.37010368 | 0.19881537 | |
| 2 | Refined Mesh - 50 mm | 177,007 | 0.35267681 | 0.28333815 |
| 3 | Refined Mesh - 40 mm | 262834 | 0.34555084 | 0.27684529 |
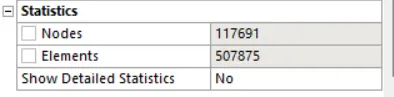
| 4 | Refined Mesh - 30 mm | 507875 | 0.33292887 | 0.2669546 |
| 5 | Half Geometry | 508824 | 0.15489402 | 0.11692308 |
Conclusion
- Coefficient of Drag tends to decrease as the mesh size of the elements is lowered. Higher the number of elements in the body,lesser will be the value of Coefficient of Drag.
- As we increase the no.of elements in the body, more prominent wake region can be seen.
- Coefficient of Lift behaves as same manner as Cd.