Week 3 - External flow simulation over an Ahmed body.
AIM: To run asimulation on the ahmed body by considering the half body by using the split body option with the velocity of the 25m/s.
OBJECTIVES:
1. Velocity and pressure contours.
2. The drag coefficient plot for a refined case. ( For velocity of 25m/sec, the drag coefficient should be around 0.33).
3. The vector plot clearly showing the wake region.
4. Perform the grid independency test and provide the values of drag and lift with each case.
INTRODUCTION:
The ahmed body is a generic car body (a simplified vehicle model). The around the ahmed body captures the essential flow features around an automobile and was first defined and characterized in the experimental work of ahmed.It is has become a benchmark for the aerodynamic simulation tools .the simple geometrical shape has a length of 1.044m , heigth of 0.288m,width of 0.389m and cylindrical legs has 0.5m.
THEORY:
The ahmed body is easy to model, it can be effortless utilized for researching various properties like turbulence, drag coefficient, wake region, lift forces, velocity magnitude at various regions of the car, magnitude of pressure around the car which helps in determining what will be resistance, fuel consumption.
IMPORTANCE:
The three dimensional flow around a vehicle has become a subject for the cfd simulation of the automotive industry. this analsys is used to technique to improving the fuel efficiency of the of a vehicles to reduce the aerodynamic drag force by optimizing the body shape.
Q2. Explain the reason for the negative pressure in the wake region?
when the air is flowing with the high velocity the viscosity of the fluid will cause the flow separation at the rear end of the vehicle it is called the wake. this will cause the negative pressure at the end and the negative perrsure will cause the pressure drag at the end. this will reduce the vehicle efficincy.
Q3. Explain the significance of the point of separation?
the flow separation cause around the vehicle body due to the viscosity of the fluid flow around the vehicle.if the high viscosity fiuld will cause the free stream velocity layer height is more from the layer of the vehicle surface. in the direction of flow the pressure increases which causes decreases in the velocity and creates condition for flow separation to occur. it is important that the skin friction coefficient reaches the value zero. that is point the wall shear stress vanishes is called the separation point. there is also formation of eddies at the wake region and lot of energy dissipated.
SLOVING AND MODELLING APPROACH:
1.First i open the workbench and then i drag the anasys fluent into the work space. then i open then geometry on the popup and i open the spaceclaim and import the geometry into the spaceclaim.
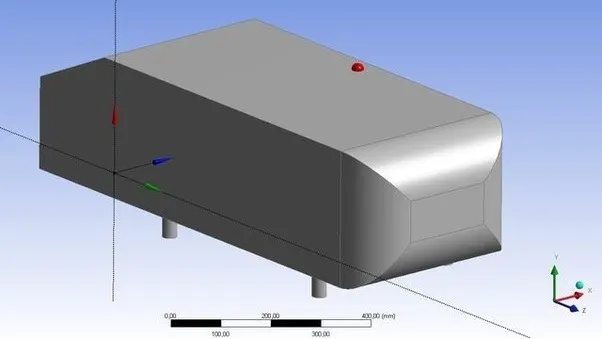
fig: raw model.
2. then i have created the two Enclosure to reduce the element count number for i used the tool of Enclosure option under the prepear option on the main bar.
3. then i went to the plane option to see the inside body of the ahmed body then i used the option split body option on the main bar to make the geometry into the half for the simulation to reduce the element count.
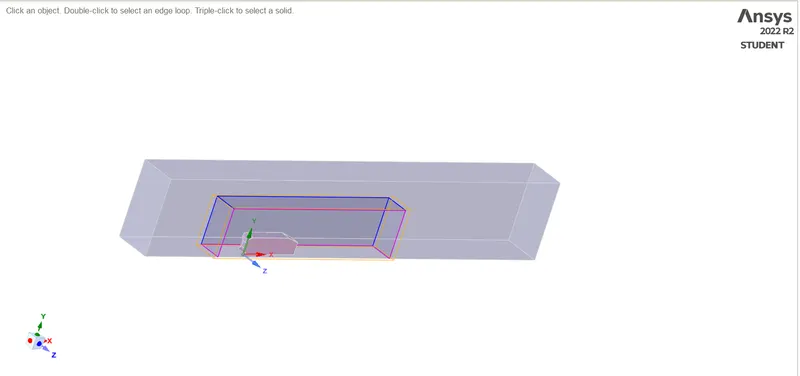
fig: ahmed body with the Enclosure.
4. then i used the share tropology option in the main bar to share the information between the elements of the two Enclosure and the body. then i used the inside solid part of the ahmed body is supress for physic not to used in the simulation part.
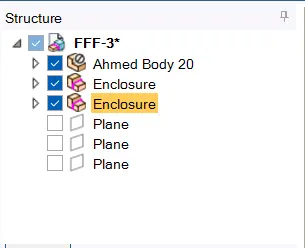
fig: geometry setup
5. then i went to the meshing part of the geometry. here i used the option called body sizing meshing the insider Enclosure, multzone for different sizing option of sizing body and facesizing for the for the cylinderical legs.
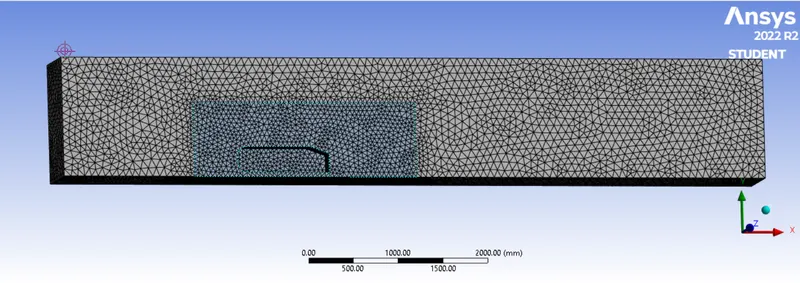
fig: geometry with meshing.
6.here i have given the mesh sizing larger enclosure with 100mm and small one with 50mm and the leg of the geometry is 5mm.
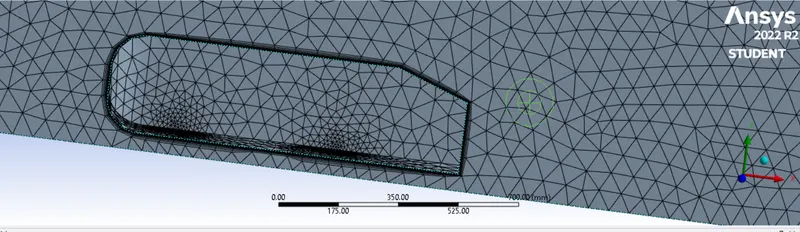
fig: inflation layers on car wall.
7. here i have given the three diferent mesh sizing on the geometry
case 1 mesh size with 100mm ,50mm and legs 5mm
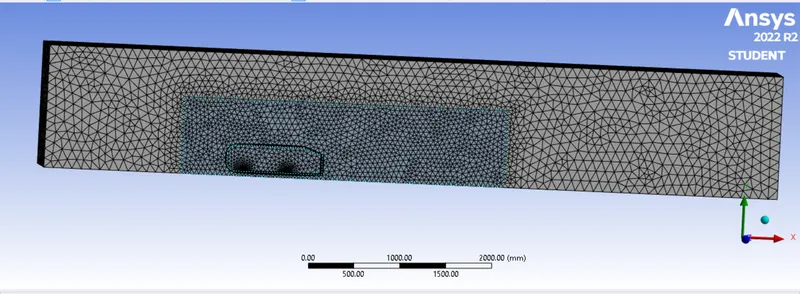
fig; mesh size 100mm
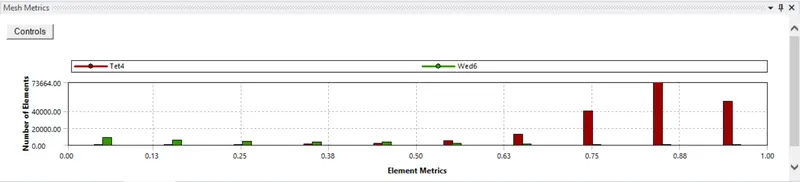
fig: mesh quality.
case 2 mesh size with 80mm ,40mm and legs 5mm
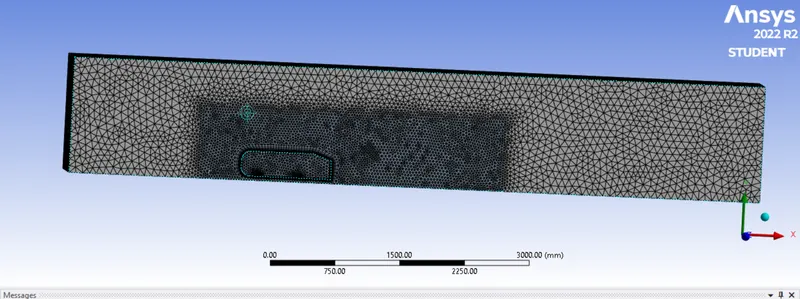
fig: mesh size 80mm
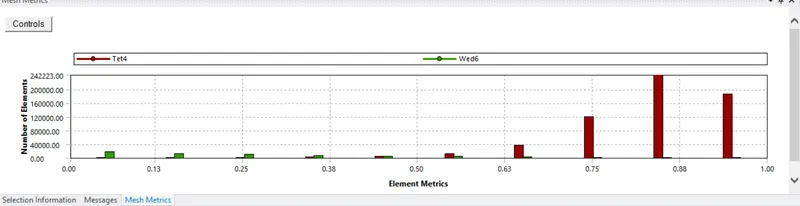
fig: mesh quality.
case 3 mesh size with 70mm ,60mm and legs 5mm
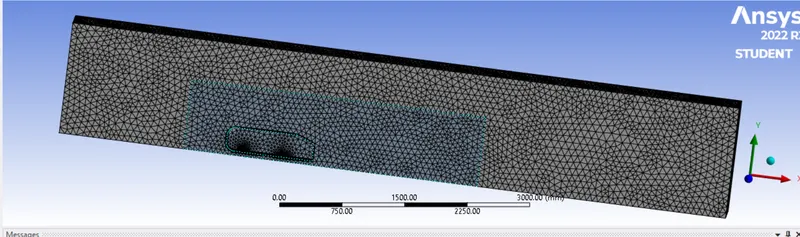
fig: mesh size 70mm
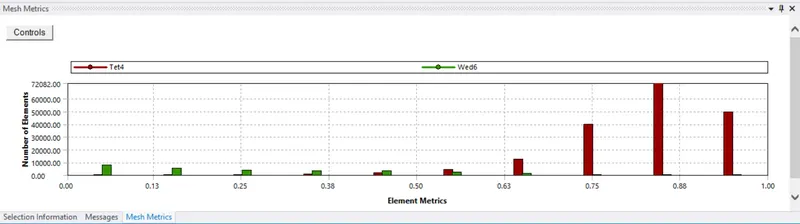
fig: mesh quality.
remain all the mesh setup is same for all the casess and then i went to the name selection of the each part has car wall,symmetry, inlet and outlet.
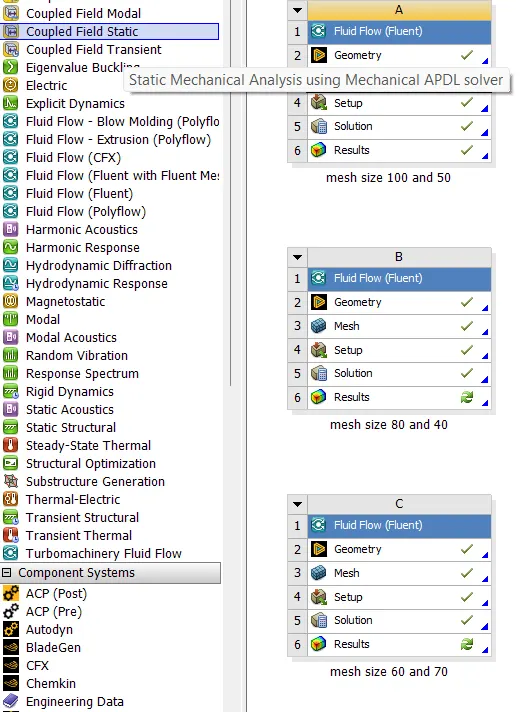
fig: simulation setup of three casess.
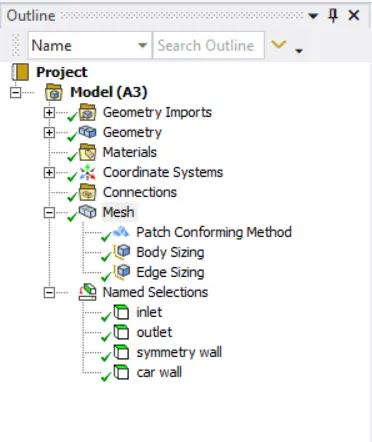
fig: mesh setup.
8. then i went to the simulation set for the input condition to run the simualtion. here i have given the inlet velocity of 25m/sec. then i have OFF energy equations, k-epsilon with standed and with enhanced wall treament.
9. then i have referance value to simulation for the geometry area,length and density ect.
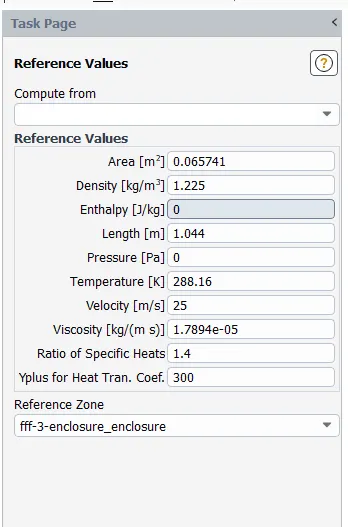
fig: referance values.
10. then i have initialized the solution and then i went to the report making on drag and lift coefficient and i have made the contour plots that are velocity and pressure contour.
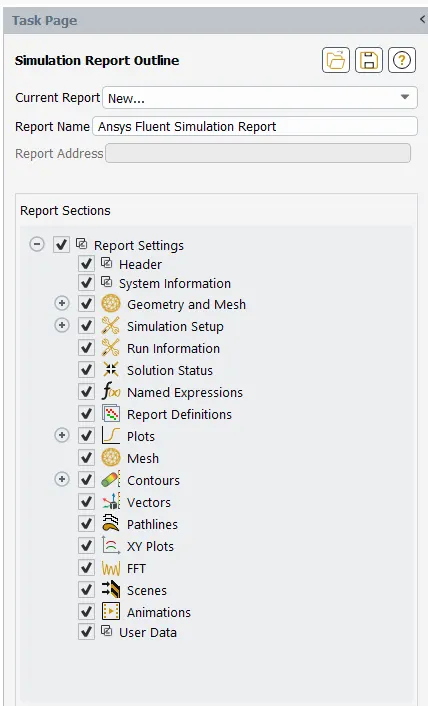
fig: simulation setup
simulation setup is same for all the casess.
CASE 1
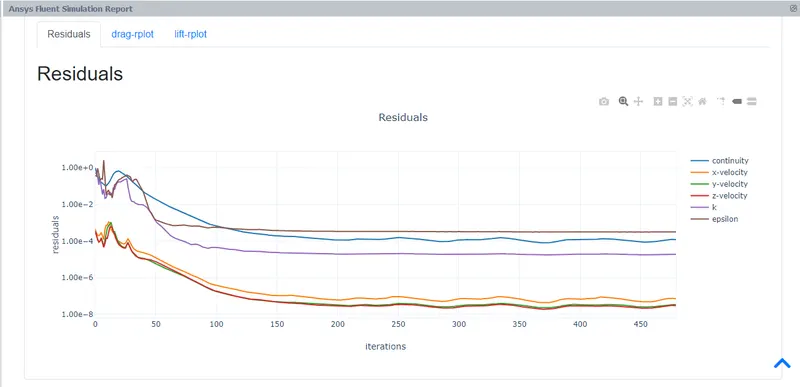
fig: residual plot
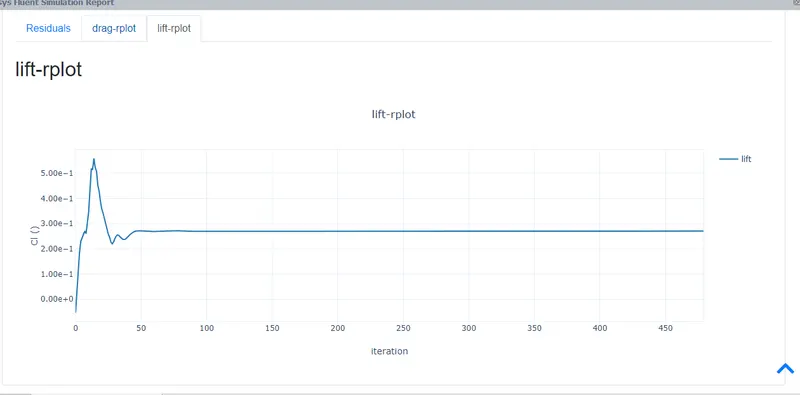
fig: lift plot.
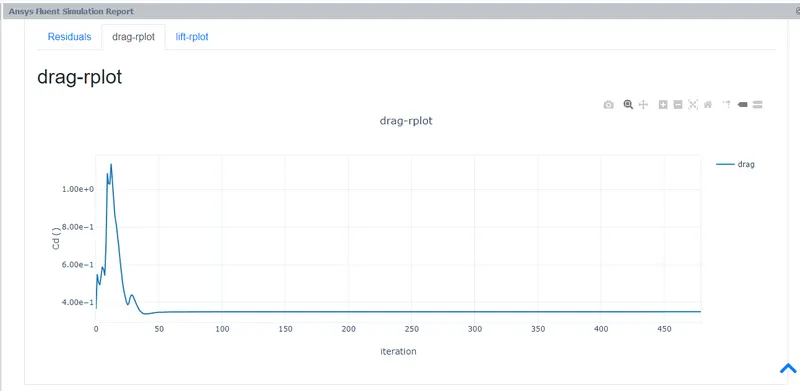
fig: drag plot
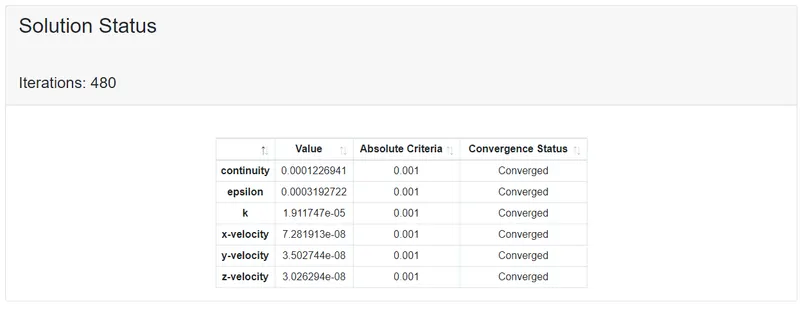
fig: converged values.
CASE 2
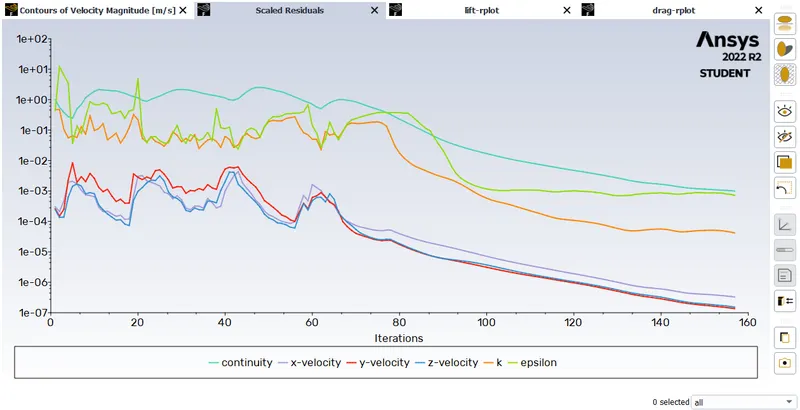
fig: Residual plot
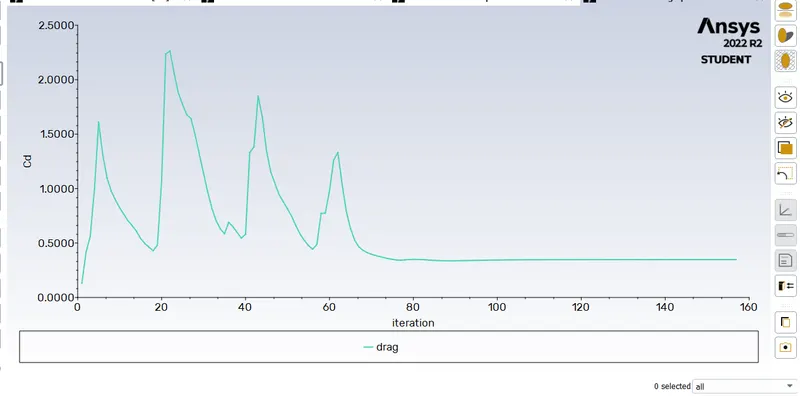
fig: drag plot
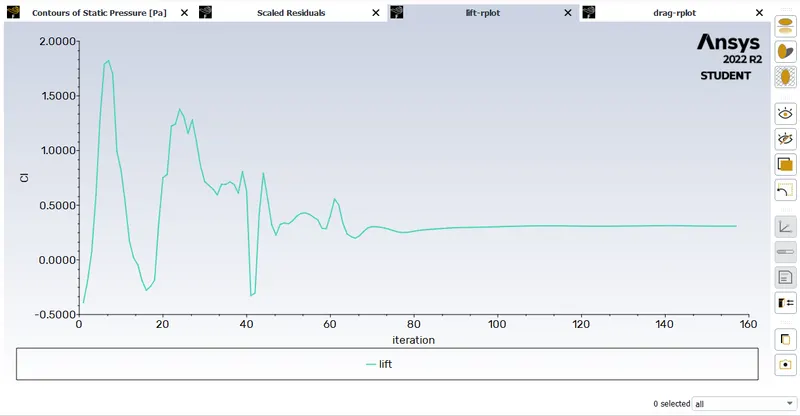
fig: lift plot
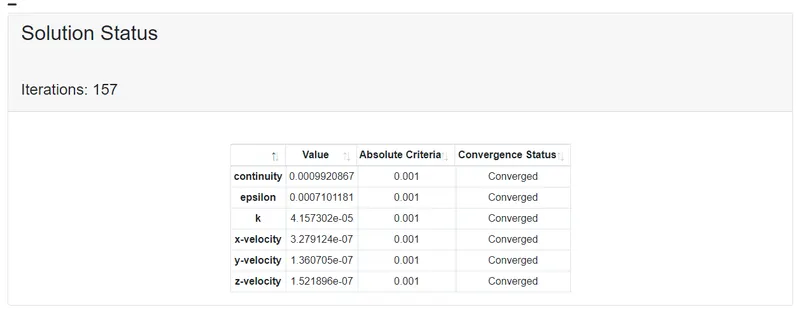
fig: converged values
CASE 3
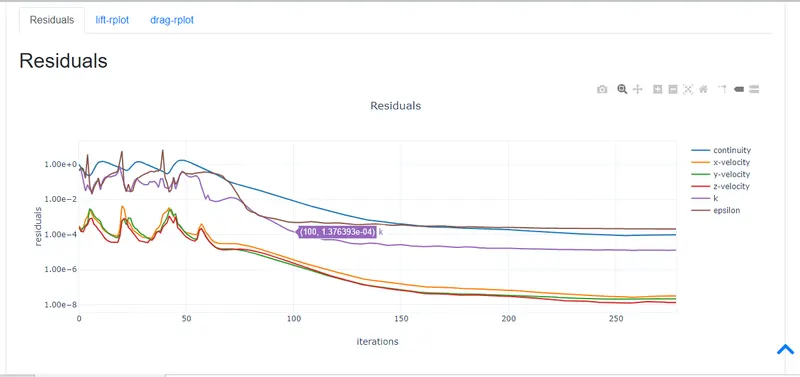
fig: residual plot
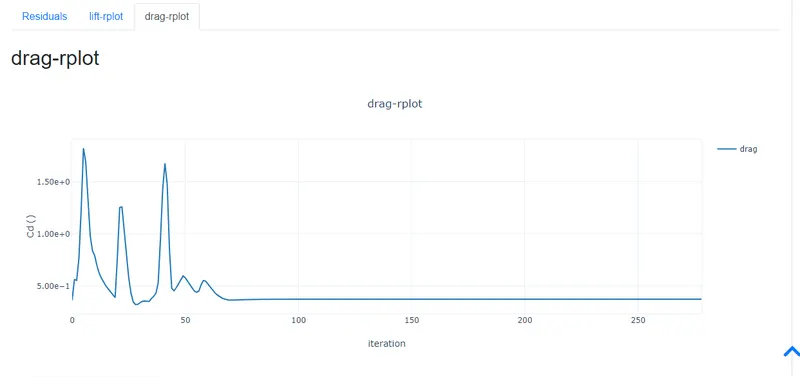
fig: drag plot
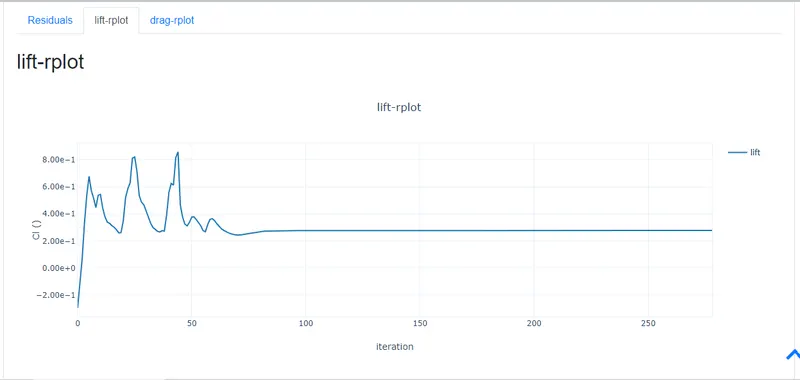
fig: lift plot
OUTPUT:
CASE 1
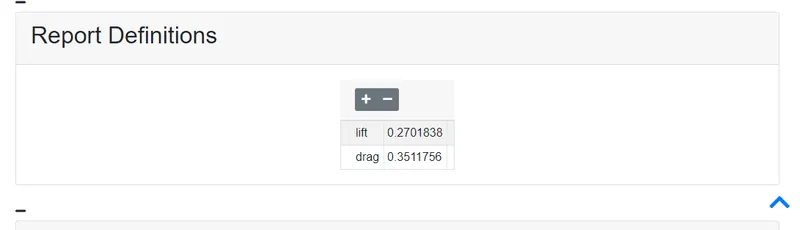
fig: outup values of drag and lift
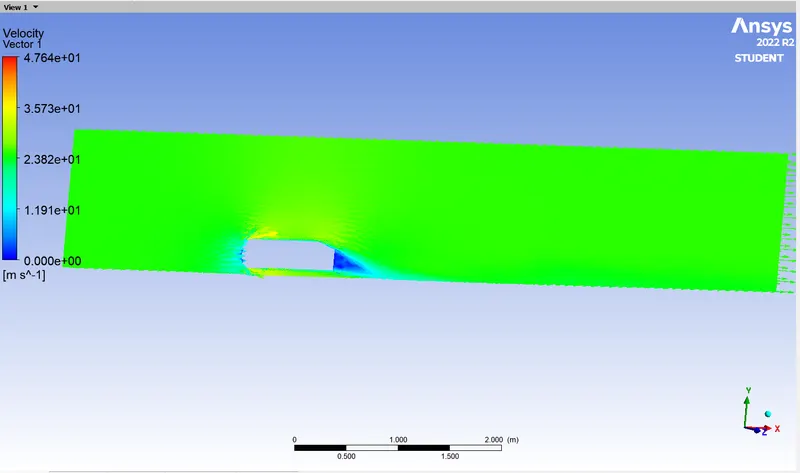
fig: velocity contour with vectour
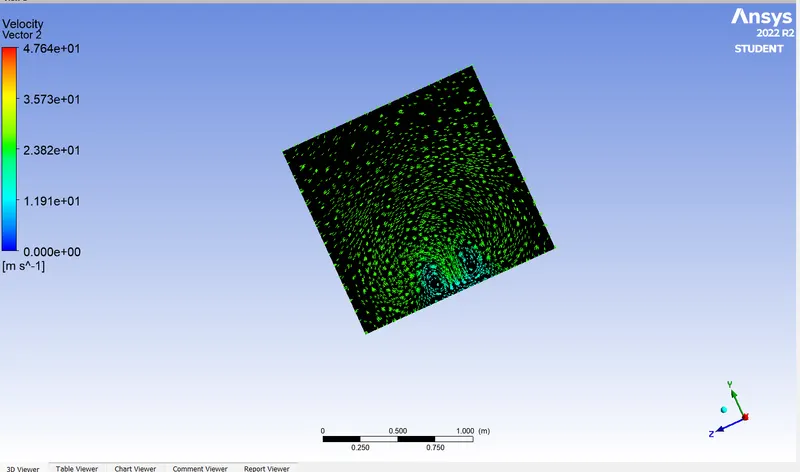
fig: velocity contour at flow separation
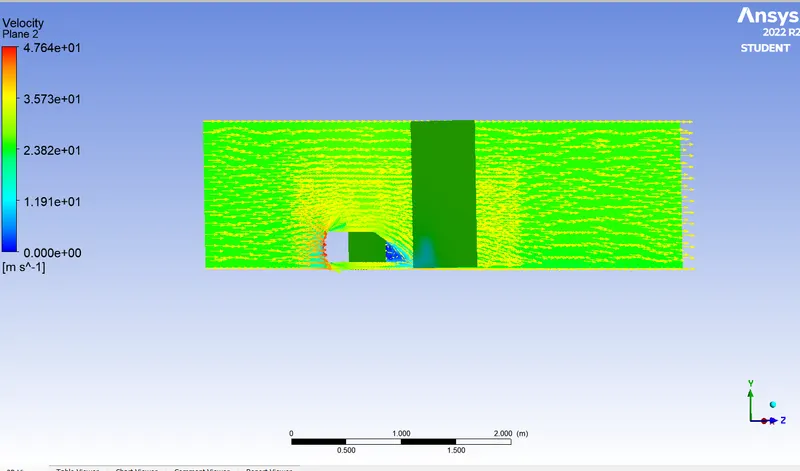
fig: velocity contour with vector
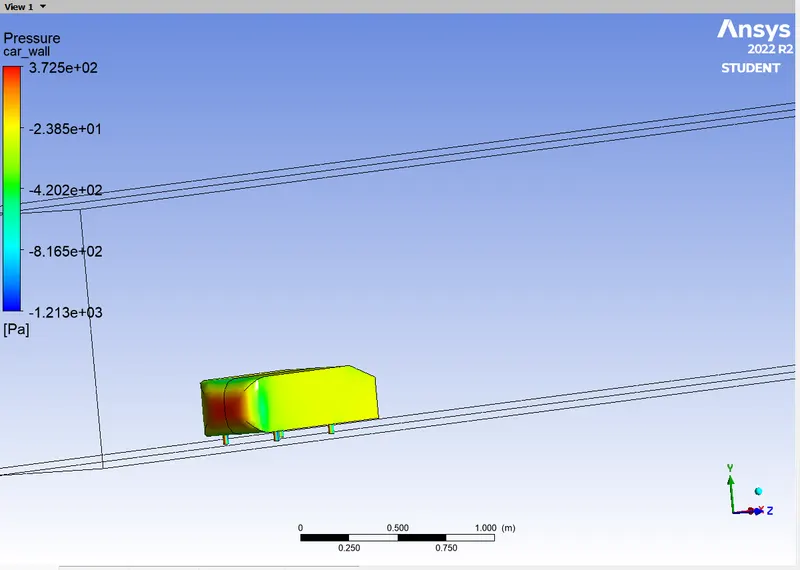
fig: pressure contour
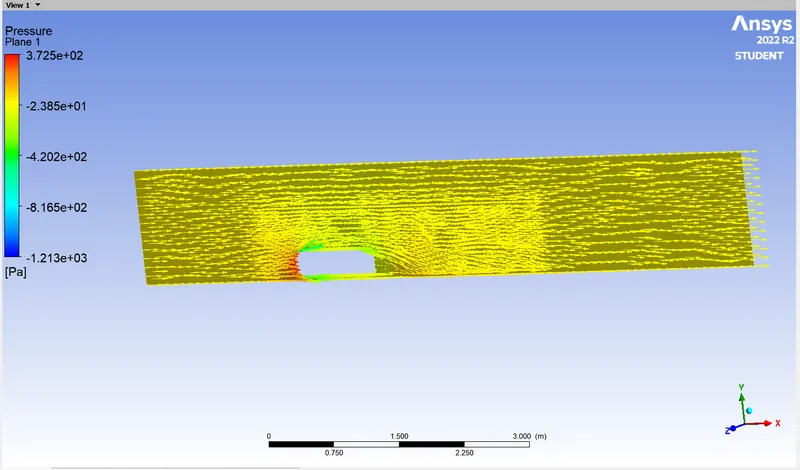
fig: pressure contour vector.
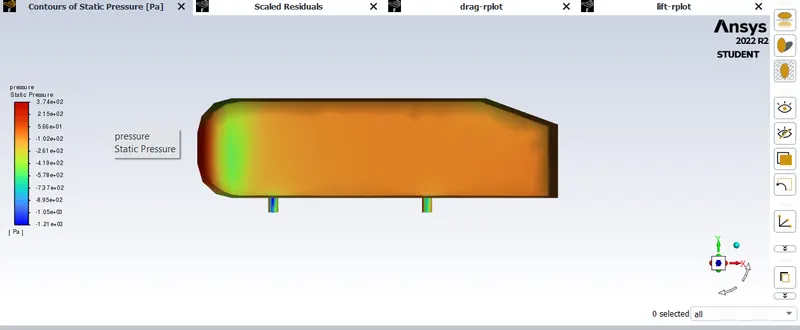
fig: pressure contour on car wall
CASE 2
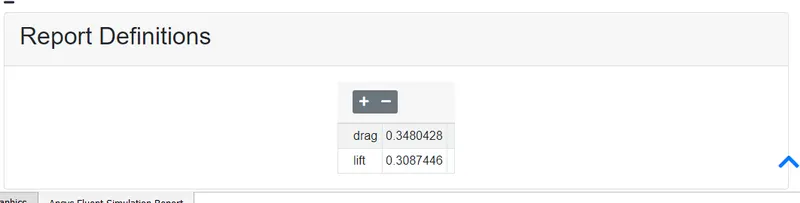
fig: output values of drag and lift.
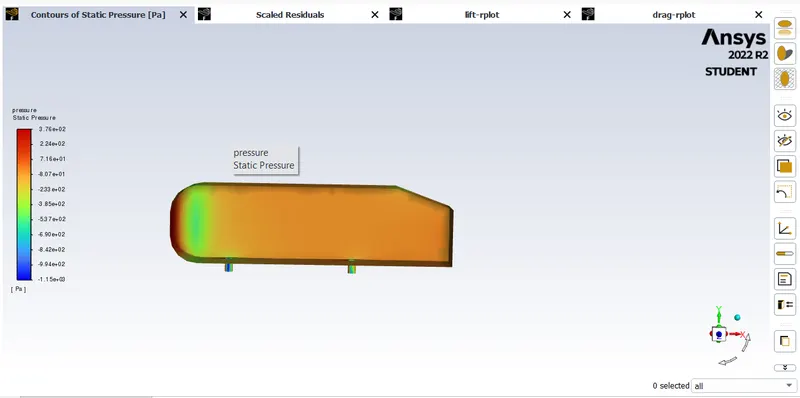
fig: pressure contour of car wall
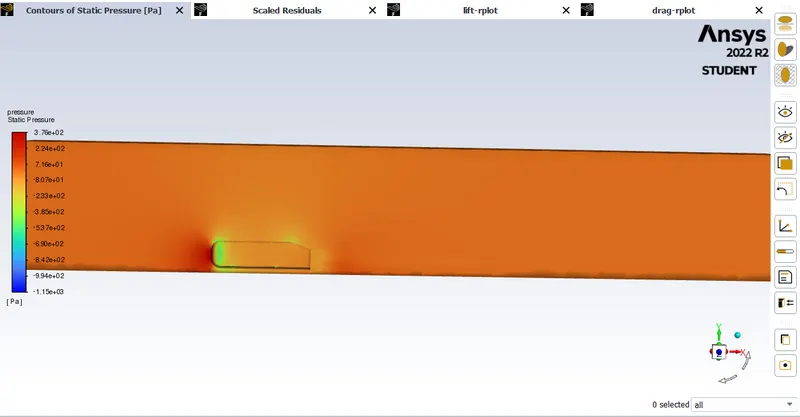
fig: pressure contour
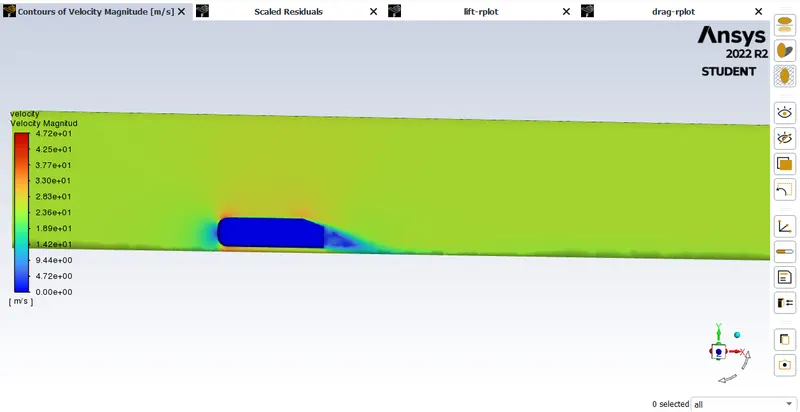
fig: velocity contour
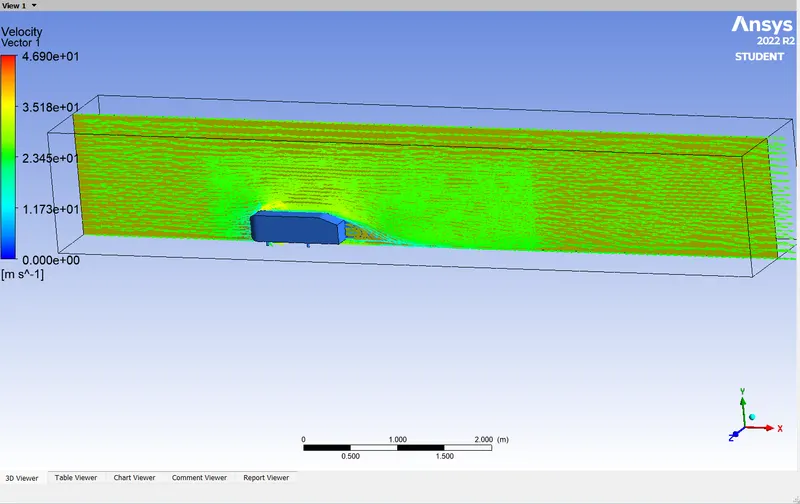
fig: pressure contour of vector.
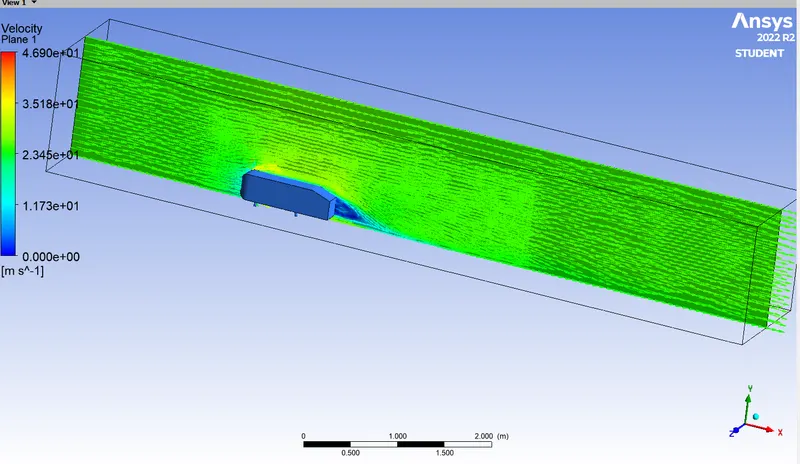
fig: velocity contour vector
CASE 3
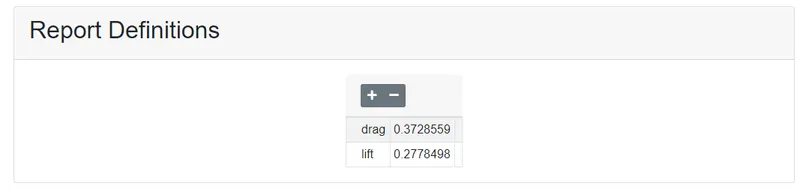
fig: output values of drag and lift.
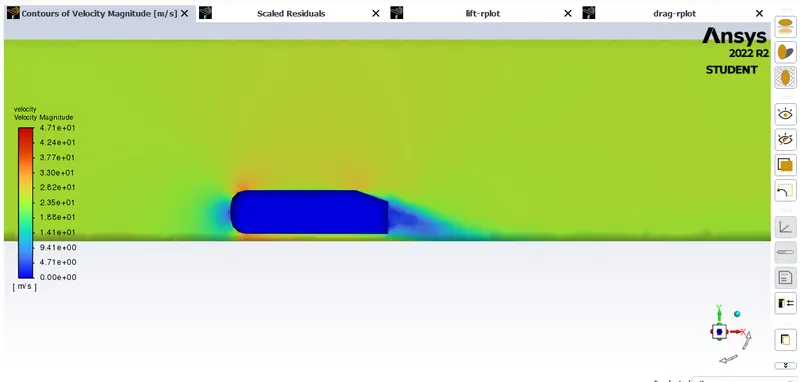
fig: velocvity contour
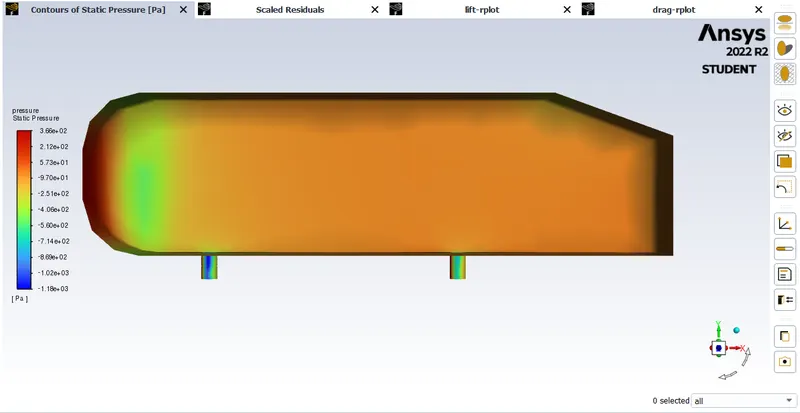
fig: pressure contour on cae wall
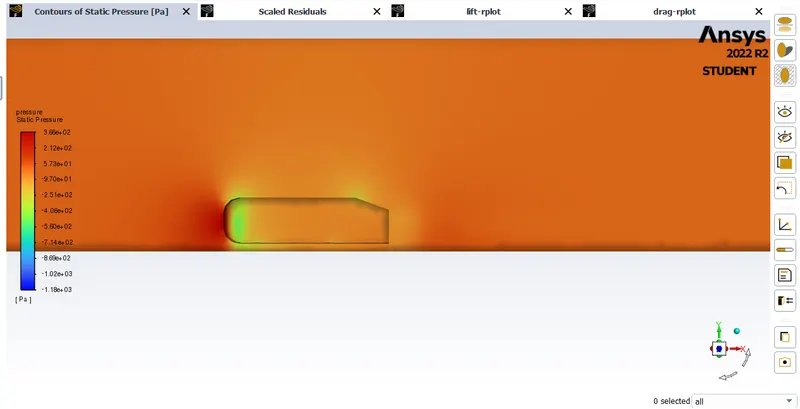
fig: pressure contour
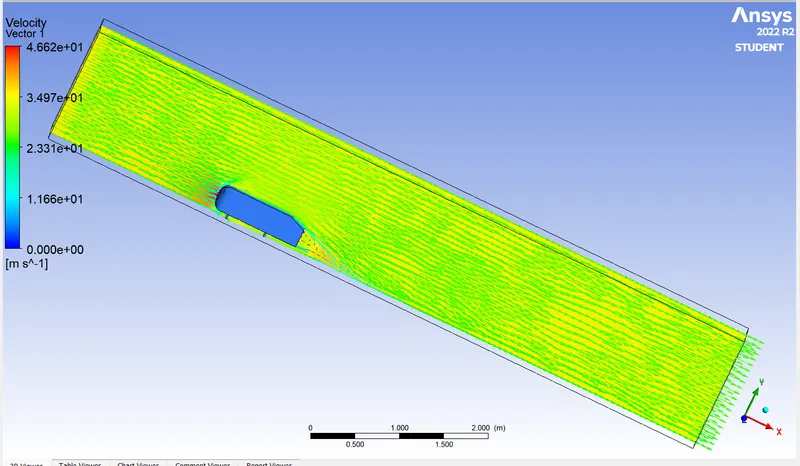
fig:pressure contour of vector
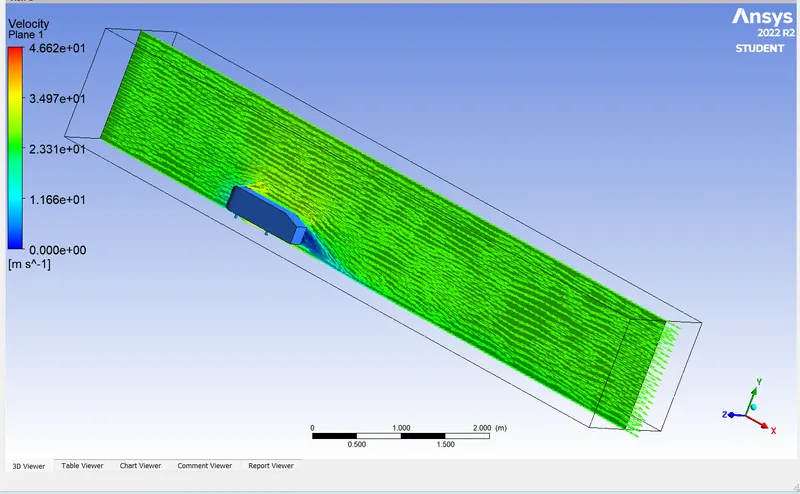
fig: velocity contour of vector.
CONCLUSION:
here i conclued that the mesh size is small then the accuracy of the drag and lift coefficients values. the converging the values on based on the mesh size if the mesh size is small then converged at higher iterations ,if mesh size is larger then the converaged at low iterations. there is small variantion in the contour plot