Week 3 - External flow simulation over an Ahmed body.
Aim
To conduct a CFD study on the Ahmed body at 25m/s and evaluate its drag coefficient and perform a qualitative study on the vector and pressure contours from the study.
Ahmed Body and its Importance
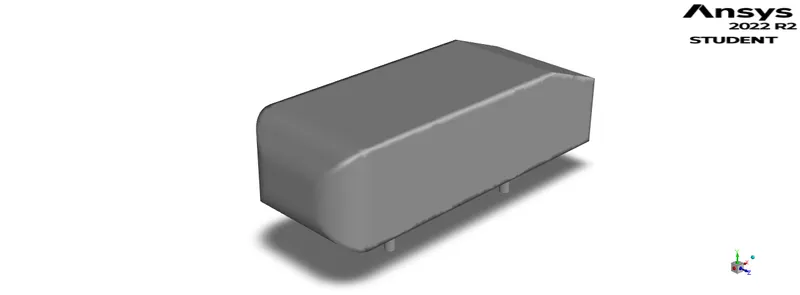
The Ahmed body, designed by SR Ahmed [1], is a generic car-shaped body which has all the major features of an automobile. The Ahmed body has now become a standardised body commonly used to validate CFD codes and evaluate the CFD code's capability to capture the flow around the Ahmed body. Since the airflow around the Ahmed body shows all the characteristics around that of an automobile, the CFD codes can then be confidently used to analyse modern automobiles.
Negative Pressure in the Wake Region
In the current analysis, all pressures recorded are gauge pressures and do not have atmospheric pressure added to them. A negative gauge pressure indicates a static pressure below the atmospheric pressure and thus creates a region of suction.
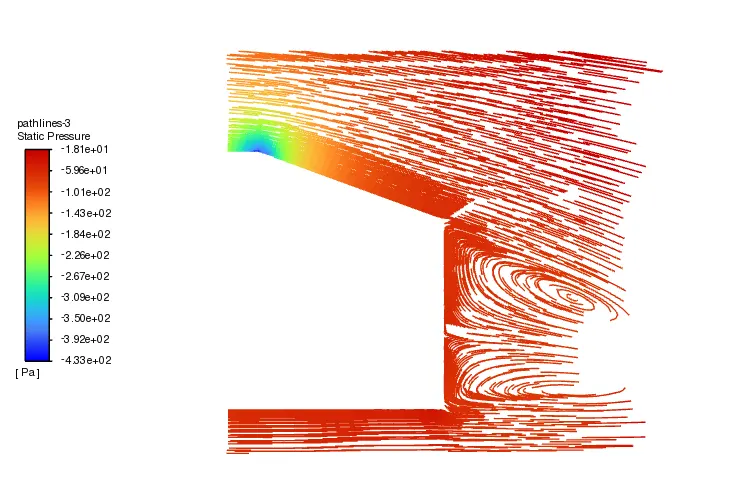
In the aft region of the Ahmed body, there exists a slope and a backwards-facing step normal to the flow direction. This region will subject the flow field behind the Ahmed body to large amounts of flow separation and turbulence. This region of separated flow acts as a region of suction and this leads to an increase in drag called the pressure drag. The negative pressure indicates the amount of suction the flow separation has created. Ideally, this negative pressure should be minimized to ensure a decrease in drag and improve the overall aerodynamic performance of the body.
The image below shows pathlines coloured by static pressure on the symmetry face of the domain zoomed in on the aft section of the Ahmed body. The large negative pressure has created a suction region behind the body and thus caused flow circulation.
Significance of Point of Separation
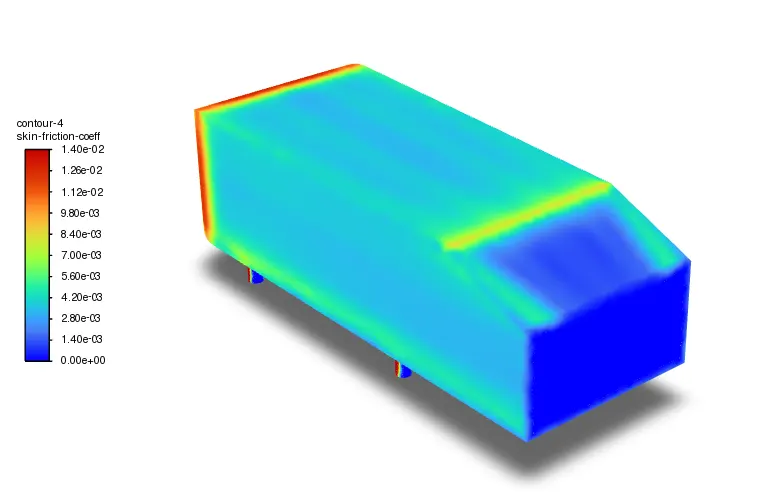
The point of separation indicates the exact point at which flow separation occurs on the body. This helps in understanding the reason for flow separation and also could be used to evaluate designs based on the location of separation i.e delayed or early. separation. The point of separation is often estimated using the wall shear stress or the skin friction coefficient on the body. The image below shows the contour of skin friction coefficient on the body. At the rear end, there exists a low skin friction coefficient indicating a region of separated flow. The point of separation can be seen to occur in the mid-region of the slant close to the plane of symmetry.
Post-process Equations
Total pressure coefficient
The total pressure coefficient can be used to visualise the loss in pressure energy in the flow. The equation is given as:
`C_(p_(T)) = P_(T)/((1/2) rho (V^2))`
Skin Friction coefficient
The Skin friction coefficient can be used to visualise the attached/separated nature of the flow field on the walls of the body. The equation is given as:
`C_(f) = (WSS)/((1/2) rho (V^2))`
Lift/Drag coefficient
The lift/drag coefficient is the non-dimensionalisation of the lift and drag forces and can be used to compare the aerodynamic performance of different bodies. The equations are given as:
`C_(L) = L/((1/2) rho (V^2)S)`
`C_(D) = D/((1/2) rho (V^2)S)`
where,
`P_{T}` - is the Total pressure [N/`m^2`]
WSS - is the wall shear stress [N/`m^2`]
L/D - are the lift and drag forces [N]
rho - is the density [kg/`m^3`]
V - is the free stream velocity [m/s]
S - Reference Area [m^2]
Method
Geometry
The Ahmed body is symmetrical along its longitudinal plane, hence only half-body simulations were decided to be conducted.
Fluid Domain
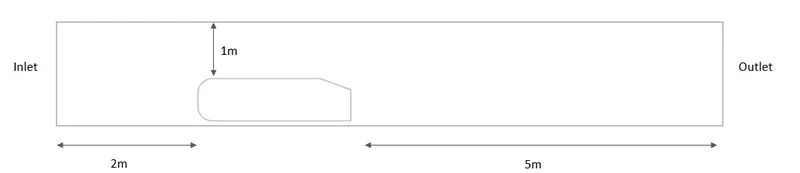
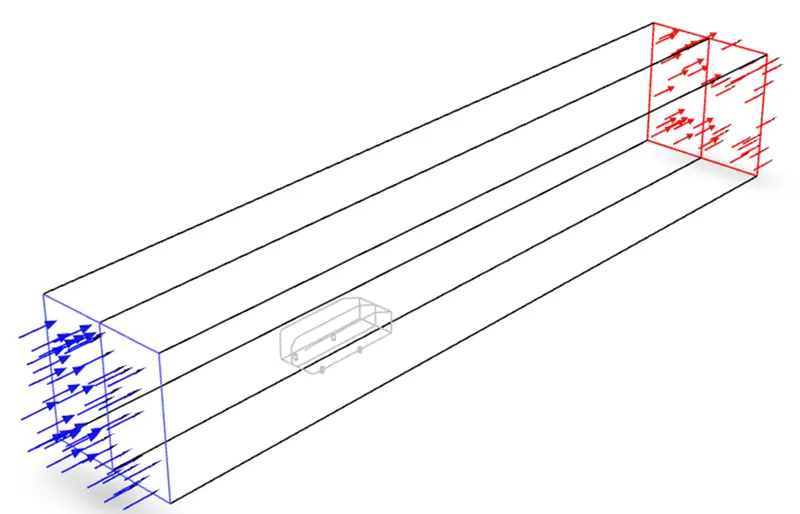
The fluid domain was constructed as a rectangular cuboid around the Ahmed body as shown in the schematic below with a depth of 1m.
The image below shows the mirrored view of the fluid domain with the Ahmed body inside it.
Mesh
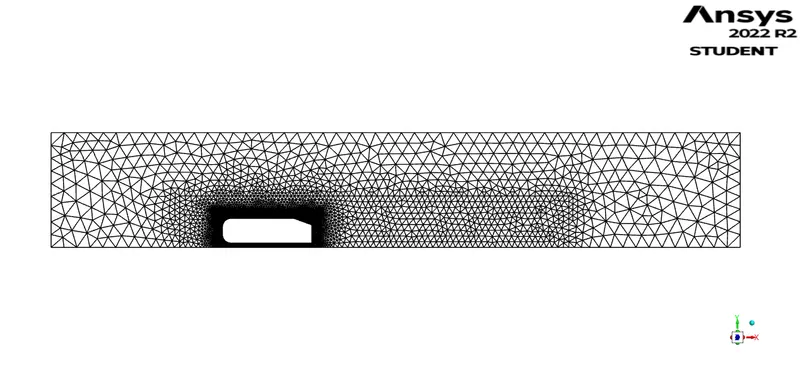
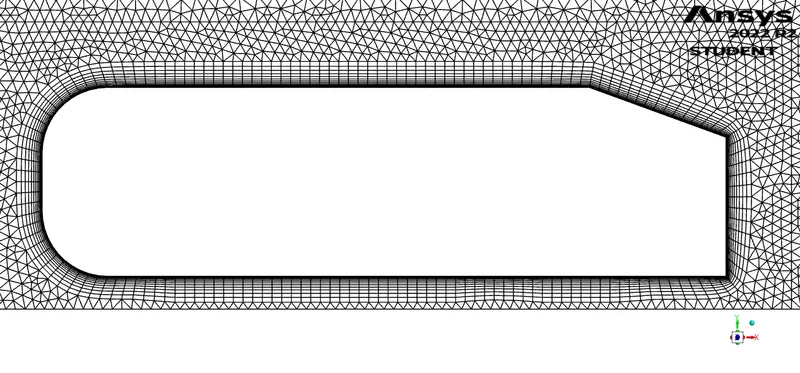
Three meshes were generated for this study with increasing mesh densities to verify the model. All the meshes are generated with two bodies of influences (boi) encompassing the ahmed body. The first boi was generated to capture the wake region of the ahmed body and the second boi was generated to capture the geometry of the ahmed body. Additionally, 12 inflation layers with first layer height of 0.001m were also added to capture the boundary layer on the ahmed body. The image below shows the refined mesh.
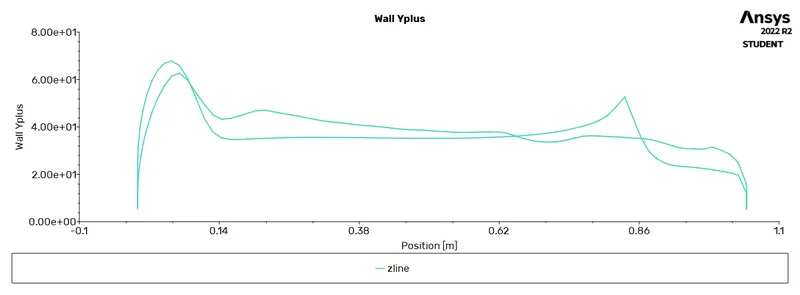
The image below shows the plot of wall `y^+` on the Ahmed body wall at the symmetry plane. The majority of the wall `y^+` is seen to be greater than 30 with only a few regions going below `y^+` = 30.
Solver
All Simulations were conducted using Ansys Fluent 22 R2. The fluid used in the domain was air with a constant density of 1.225 kg/`m^3` and dynamic viscosity at 1.7894e-05 kg/ms. The inlet was set to a velocity inlet with a 25m/s air velocity and a pressure outlet with 0 gauge pressure. The walls of the Ahmed body were set to no-slip conditon and all other faces of the domain were given the symmetry boundary condition. Reference Area of 0.112`m^2` was used to estimate the force coefficients derived from the works of Meile et al [2].
The pressure-based PV coupled scheme was used for spatial discretization. The realisable K-Epsilon turbulence model with standard wall functions was used with first-order accuracy to estimate turbulence parameters. Pressure and momentum were computed with second-order accuracy. The solution was initialised using hybrid initialisation followed by an FMG initialisation to quicken the simulation runtime. The pseudo transient method was also used with automatic conservative length scales.
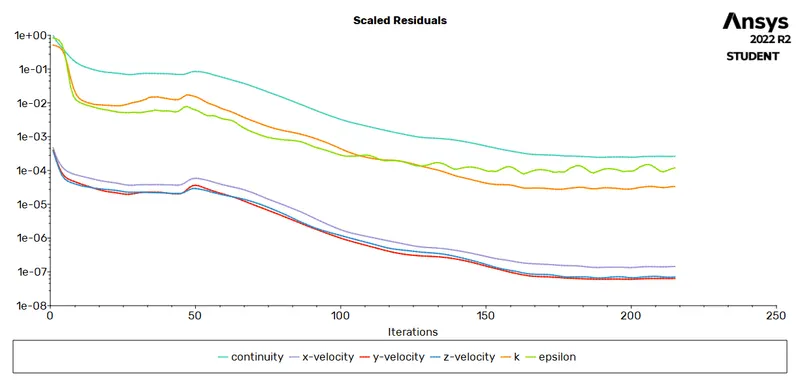
Convergence was monitored using the scaled residuals and the variations of lift and drag. The simulations were assumed to be converged when the lift/drag varied under 0.001 across iterations and scaled residuals were all below 1e-3. Simulations typically ran for 200 iterations before reaching convergence.
Mesh Sensitivity Analysis
Three meshes were constructed for the mesh sensitivity analysis. The sizings of the boi were altered to achieve the various mesh densities. The inflation layers were unchanged across the meshes to maintain proper capture of the boundary layer. The table below shows the sizings of the mesh and their corresponding drag/lift coefficient results.
| Mesh number | BOI 1 | BOI 2 | Size | `C_L` | `C_D` |
| Mesh 1 | 0.15 [m] | 5.5e-2 [m] | 130k | 0.310 | 0.342 |
| Mesh 2 | 6.55e-2 [m] | 2.35e-2 [m] | 251k | 0.334 | 0.314 |
| Mesh 3 | 6.55e-2 [m] | 1.475e-2 [m] | 510k | 0.300 | 0.318 |
Mesh 3 being the most refined mesh with the closest value compared to the standard Cd = 0.33 was chosen as the final mesh to post-process the results.
Results
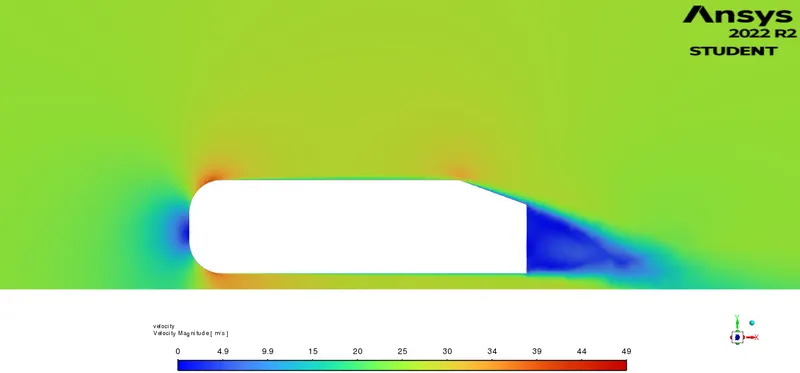
The image below shows the contour of velocity on the symmetry plane. The local flow accelerations around the curved edges of the Ahmed body can be noted along with the well-visible wake region behind the Ahmed body.
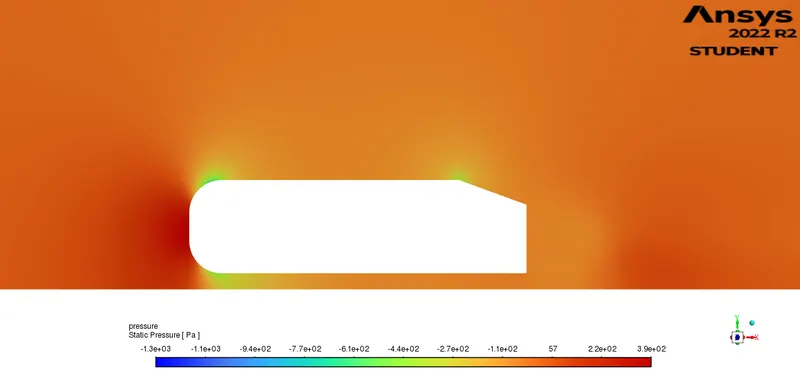
The image below shows the contour of static pressure on the symmetry plane. A region of negative static pressure indicates a region of adverse pressure gradient at the aft end of the Ahmed body indicating a region of suction. This low-pressure region will cause large amounts of base drag on the body.
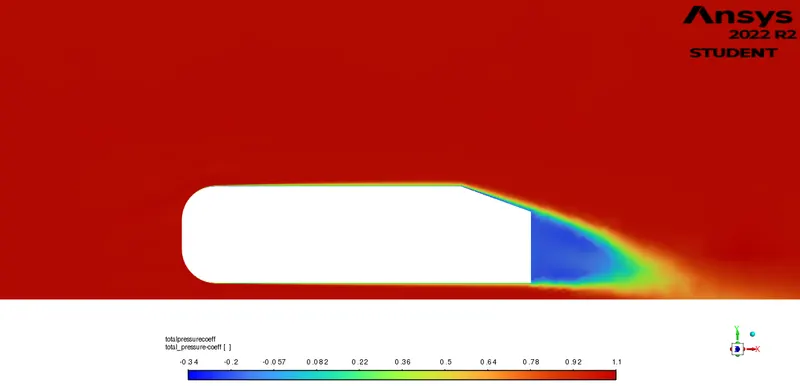
The image below shows the contour of total pressure coefficient on the symmetry plane. The wake region is clearly visible in this image showing a large region of low energy flow.
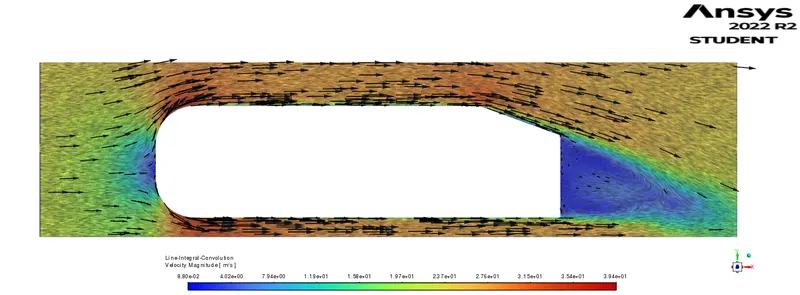
The image below shows the vector plot of velocity overlayed on to a line integral convolution plot coloured by velocity magnitude on the symmetry plane. The vortices in the wake region behind the Ahmed body can be easily visualised in this image.
The images below show the lift and drag variations with iterations. It is important to note that the lift and drag values shown here are for half-body simulations. The values will then be multiplied by 2 to retrieve the lift and drag coefficients for the full Ahmed body.
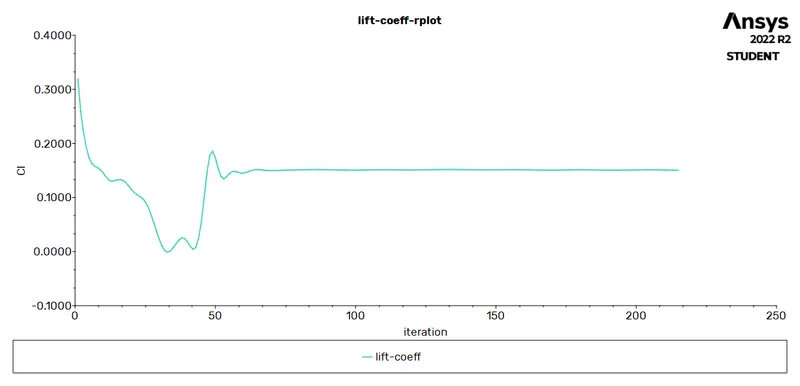
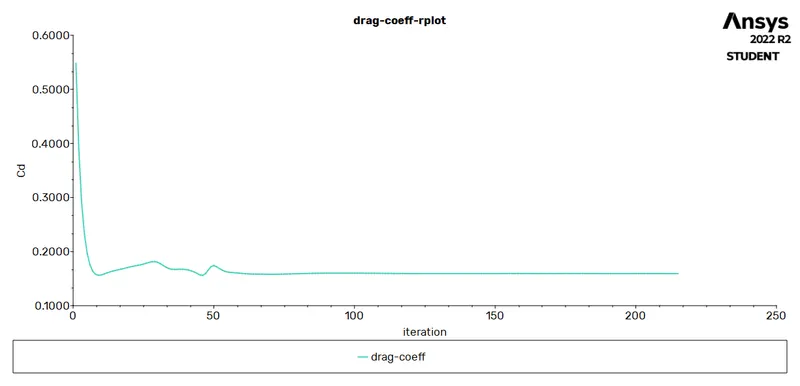
The image below shows the scaled residuals used to check convergence. It can be seen that continuity, momentum and Turbulence parameters have all reached 1e-3. From the images above, the variations of CL and CD are unchaged with a precision of 0.001 across iterations as well. Hence, the simulation is thus deemed converged.
Drag Coefficient of Ahmed body at 25m/s = 0.318
Lift Coefficient of Ahmed body at 25m/s = 0.300
Conclusion
An aerodynamic analysis was conducted on the Ahmed body with a velocity of 25m/s using CFD. The mesh was generated with an overall yplus>30 and verified with varying mesh sizes. The Realisable K-epsilon turbulence model was used for simulations and the results were post-processed. The lift/drag coefficients were obtained and the velocity and pressure contours were illustrated to visualise the flow field and the wake behind the Ahmed body.
References
- Ahmed, S. R., Ramm, G., & Faltin, G. (1984). Some Salient Features of the Time -Averaged Ground Vehicle Wake. SAE Transactions, 93, 473–503. http://www.jstor.org/stable/44434262
- Meile, Walter & Brenn, Günter & Reppenhagen, Aaron & Lechner, Bernhard & Fuchs, Anton. (2011). Experiments and numerical simulations on the aerodynamics of the Ahmed body. CFD Letters. 3.