Week 3 - External flow simulation over an Ahmed body.
1. Introduction
1.1 What is an Ahmed Body
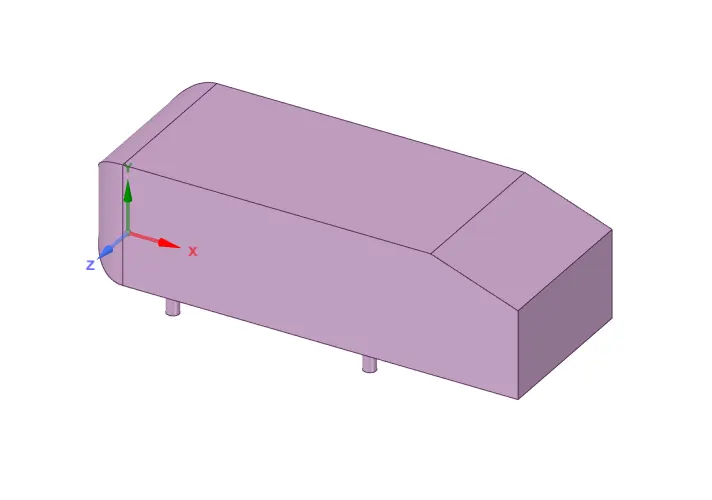
The Ahmed Body is an experimental structure that is used in the Flow analysis which captures the required data of the flow features flowing over it. This experimental flow body is utilised to study the different features of the flow along with understanding the lift and drag coefficients to get the efficiency of the structure and based on the data obtained the design can be further finetuned by changing necessary characteristics and understanding the effects of changing these features.
1.2 What is Point of Separation
The Point at which the flow becomes detached and takes up the form of the experiment structure and forms a wake region is called as Point of Separation. It can also be defined as the differentiation point between the normal flow and the wake region flow. This in general can be observed in the wake region of the vehicle creating the drag force.
1.3 Negative Pressure in the Wake Region
In general, for an aerodynamic body the high and the low-pressure regions are created on the boundary layer of the body when air passes onto it. For these aerodynamic bodies, the rear portions are considered to be of steep angles. When the air flow passes through these high- and low-pressure regions, the air speed reduces when air flows from this low-pressure region to high pressure region due to which a Point of Separation is created and the air flow through this region becomes turbulent asserting a pressure drag onto the body causing a backward force acting on the aerodynamic body.
2. Problem Statement
- Describe Ahmed's body and its importance.
- Explain the reason for the negative pressure in the wake region.
- Explain the significance of the point of separation.
3. Problem Setup for Simulation
3.1 Geometry Setup
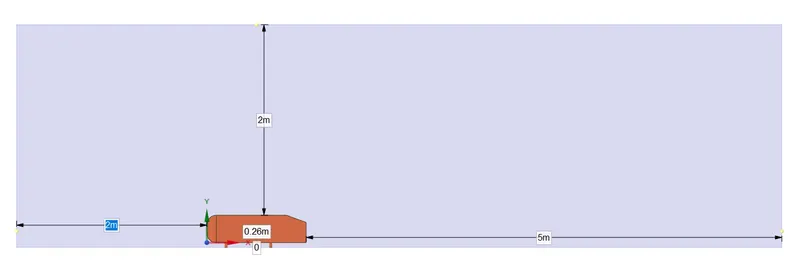
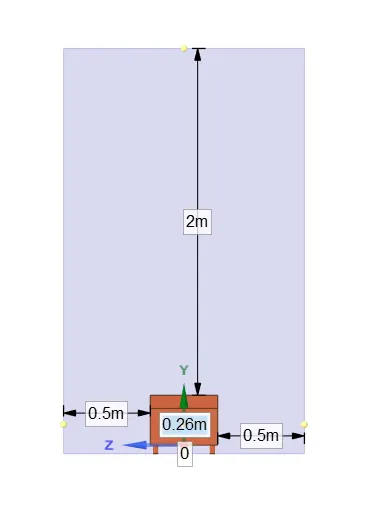
- The geometry provided is imported into SpaceClaim for an Enclosure is to be created with the dimensions of the enclosure represented below.
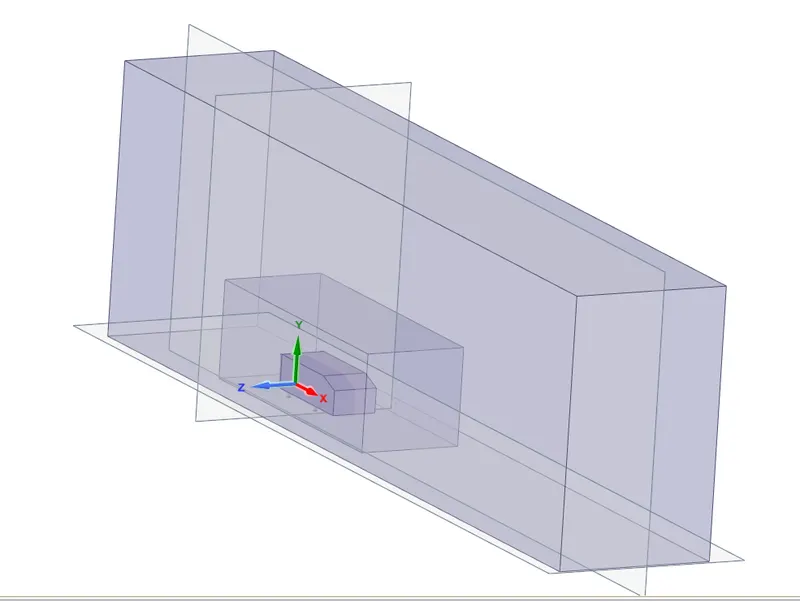
- Another Inner Enclosure is to be created in-order to get a refined mesh around the Ahmed Body and able to capture more data for the flow around the Ahmed body with the dimensions as represented below.
- The topology of the created enclosures needs to be Shared with the Ahmed Body to obtain a finer and continuous mesh elements between these sections. For this, the Interference tool needs to be utilised.
3.2 Mesh Setup
- Initially a coarse mesh can be used for the first case of simulation without the second inner enclosure. For the Second and Third cases where an intermediate and Finer Mesh is required, Sizing methods are utilised where in for the First Enclosure, A MultiZone Mesh is to be setup with an element size of 100mm.
- The Body Sizing is employed for the second inner enclosure with n element size of 50mm.
- Thirdly Face Sizing is employed for the legs portion of the Ahmed body to obtain a refined mesh on it with an element size of 5mm.
- For the Second and the Third cases, it is necessary to understand the near wall flow over the Ahmed Body. For this, an inflation Layer of 5 Layers is setup with a Growth Rate of 1.2 by using Total Thickness.
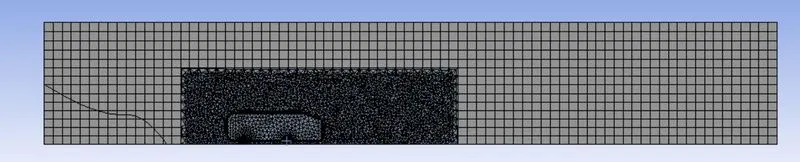
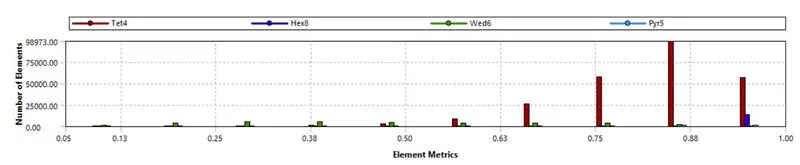
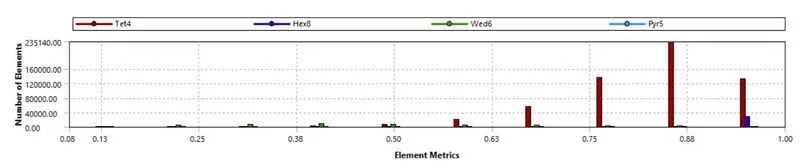
- For High Mesh, following are the Mesh representation and Mesh Element Quality.

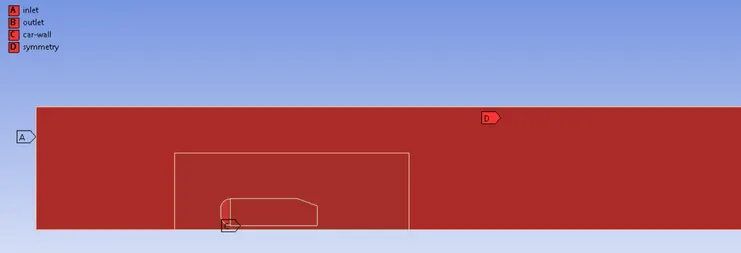
- Providing Named Sections to the structure as represented below.
3.3 Solver Setup
- For Steady State simulation, Steady is selected in the Time Section of the General Tab is to be selected.
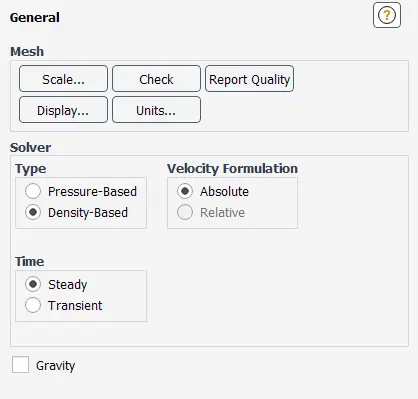
- For all the scenarios, K-Epsilon Flow model is employed.
- The material properties are to be setup as per the requirements, in this case, it is Air and parameters represented are left unchanged.
- The inlet velocity for the Boundary Conditions is set to 25 m/s in all the cases and the pressure outlet boundary conditions are left unchanged.
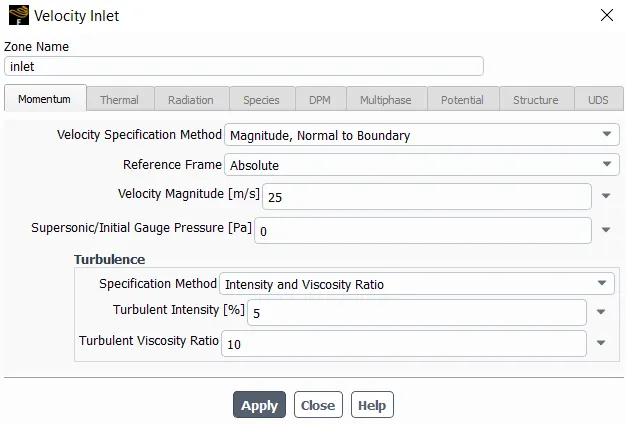
- Setting up a Monitor Point at a distance of 10 m from the centre of the cylinder section in the same axis.
- Lift and Drag Coefficient Reports are to be generated for the Ahmed Body Walls.
- A SIMPLE Solution Method is employed.
- The Setup is Initialised and the number of iterations is set to 500 Iterations to obtain the required result.
4. Simulation Results
4.1 Base Mesh
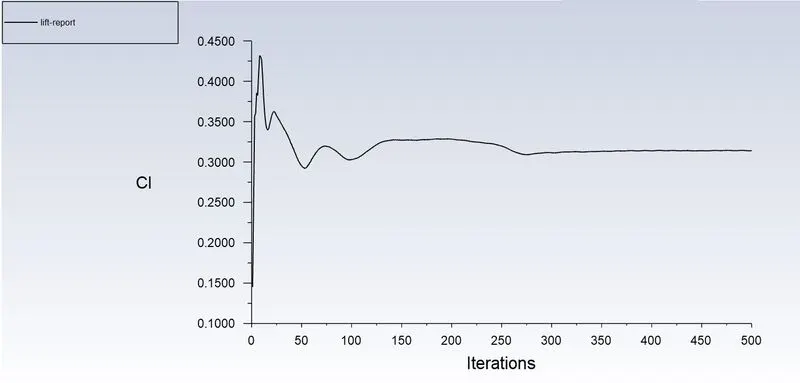
- Base Mesh Lift Report
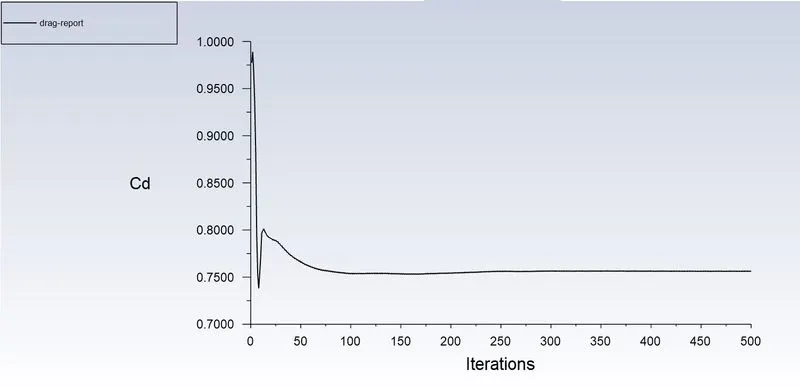
- Base Mesh Drag Report
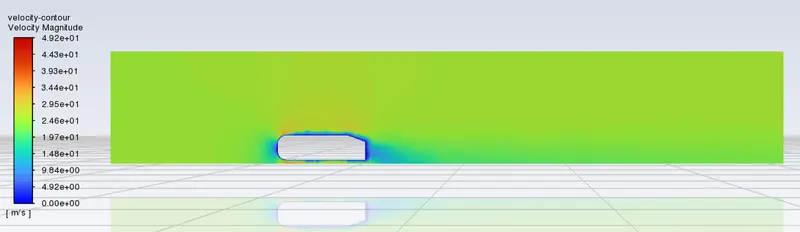
- Base Mesh Velocity Contour
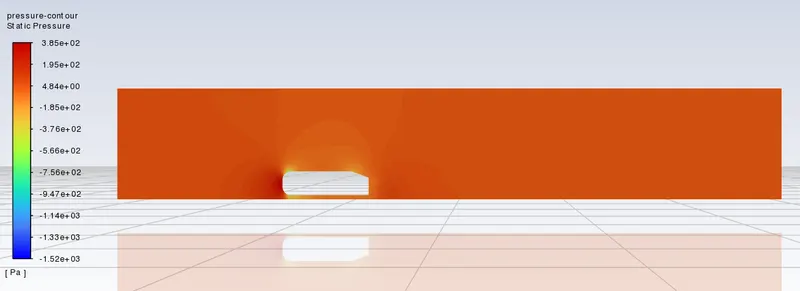
- Base Mesh Pressure Contour
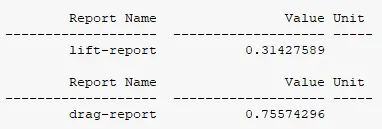
- Base Mesh Lift and Drag Coefficients
4.2 Medium Mesh
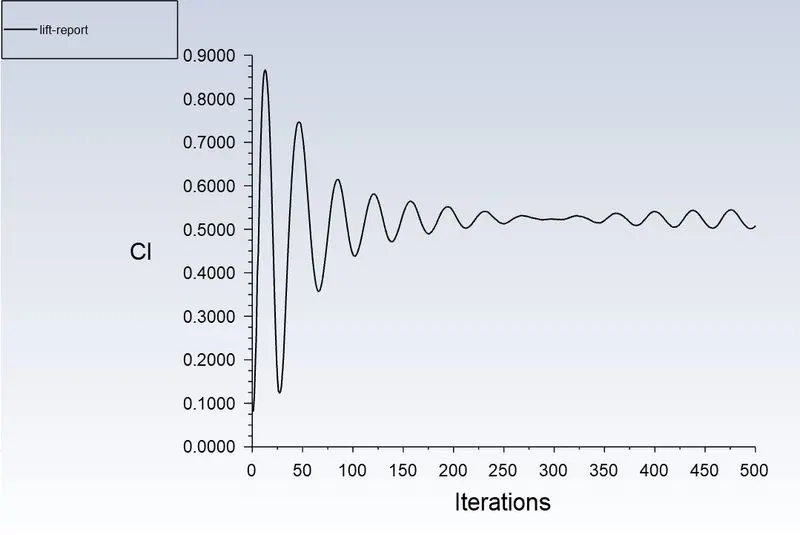
- Medium Mesh Lift Report
- Medium Mesh Drag Report
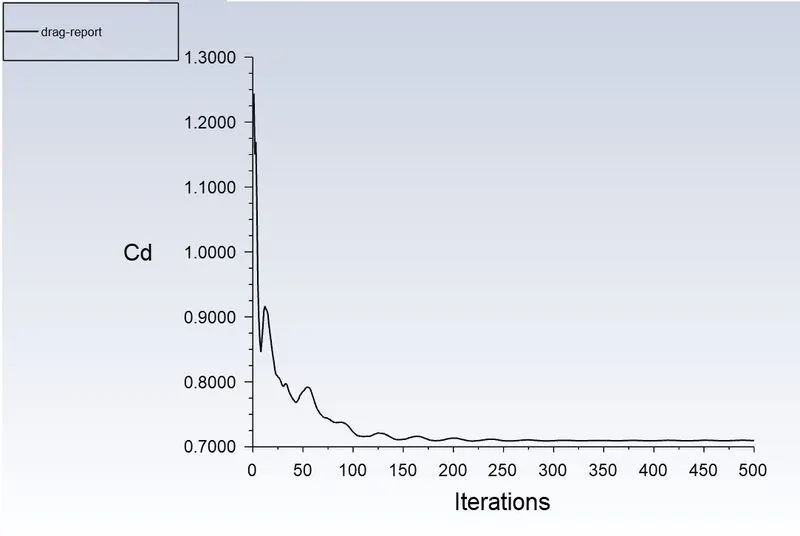
- Medium Mesh Velocity Contour
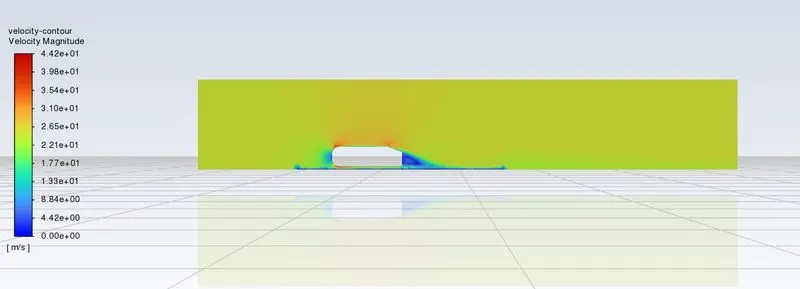
- Medium Mesh Pressure Contour
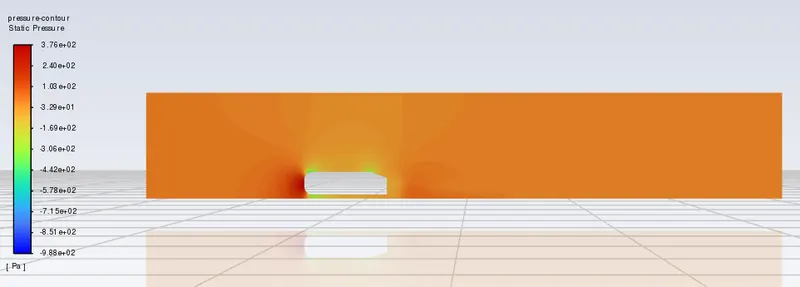
- Medium Mesh Drag and Lift Coefficients
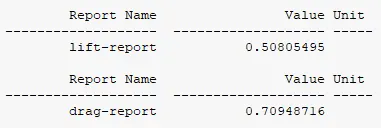
- Medium Mesh Streamline Contour
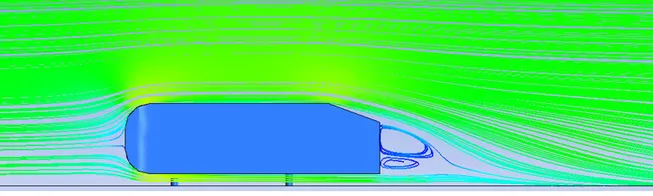
4.2 High Mesh
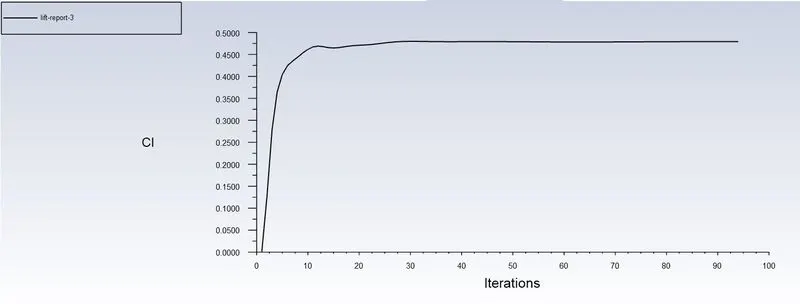
- High Mesh Lift Report
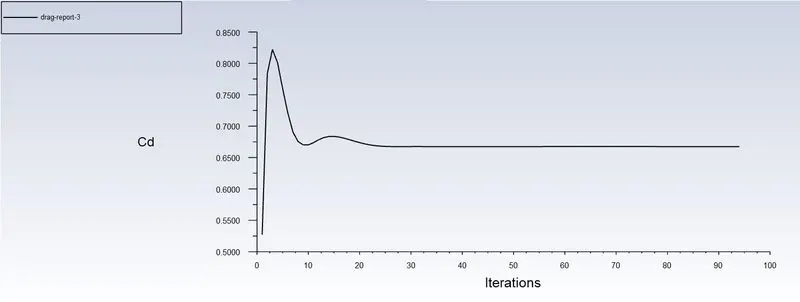
- High Mesh Drag Report
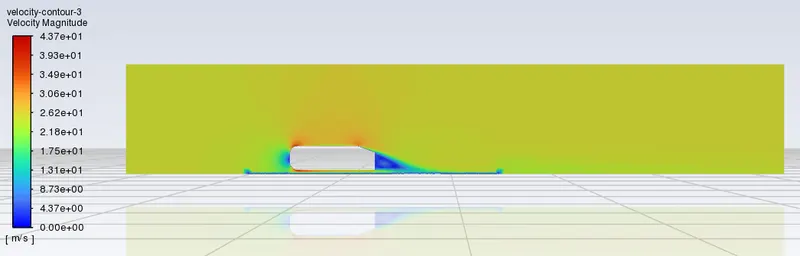
- High Mesh Velocity Contour
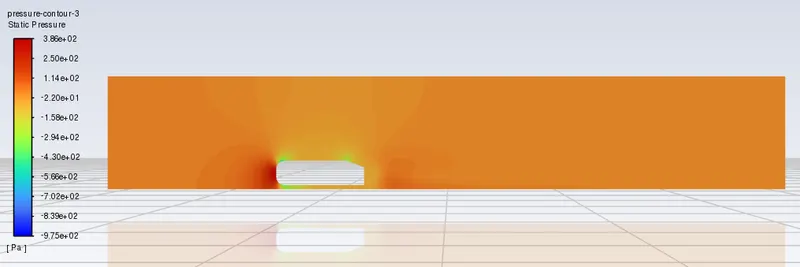
- High Mesh Pressure Contour
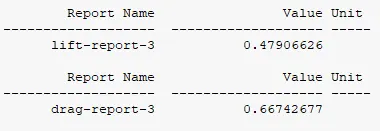
- High Mesh Drag and Lift Report
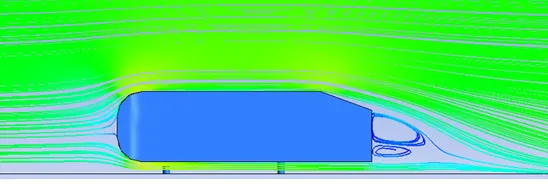
- High Mesh Streamline Contour
5. Discussion of Results
The velocity and pressure contour graphs for each of the three situations in this challenge have already been shown . The far more distinct area of all three velocity contour graphs is the trailing zone at the rear of the Ahmed body. With improved mesh quality, the wake region has more features. The pressure contour plots also change depending on the mesh quality in a similar manner. The Refined Medium Mesh presure contour plot has the most information. Front and rear of Ahmed's body may be observed to be under the most pressure.
| Simualtion Case | Drag Coefficient | Lift Coefficient |
| Base Mesh | 0.75574296 | 0.31427589 |
| Medium Mesh | 0.70948716 | 0.50805495 |
| High Mesh | 0.66742677 | 0.47906626 |
Streamline plots have also been shown for the streamline plot that focuses on the tail zones. The mesh quality improves the nuances and precision. The airflow indicated by the lines is surrounding Ahmed's body, particularly in the tail zone. Due to the reduced pressure, the air inside has begun to move, as visible in the blue area. The body is being drawn lower by the flow of the air.
Finally, a Mesh or Grid independent investigation has been completed and is shown in the data atop. The drag coefficient for refined Medium and High Meshes, with the refinement, the Drag and Lift coefficients are observed to be decreasing. However, in the baseline scenario, the very coarse mesh caused the drag coefficient to be slightly greater with the lift data being lower which is not suitable to be considered for lift results.
6. Conclusion
- Lienhart, H., Stoots, C. and Becker, S., 2002. Flow and turbulence structures in the wake of a simplified car model (ahmed modell). In New results in numerical and experimental fluid mechanics III (pp. 323-330). Springer, Berlin, Heidelberg.
- Meile, W., Brenn, G., Reppenhagen, A., Lechner, B. and Fuchs, A., 2011. Experiments and numerical simulations on the aerodynamics of the Ahmed body. CFD letters, 3(1), pp.32-39.