Week 3 - External flow simulation over an Ahmed body.
Aim:
To expriment Aerodynamic property of an Ahmed Body with default properties of air. To compute the drag co-efficient and visulize the wake region under different conditions.
Introduction:
In this problem setup we are using the ahmed body and analyse the results simulated under different mesh refinement. The below mentioned are the results to be obtained .
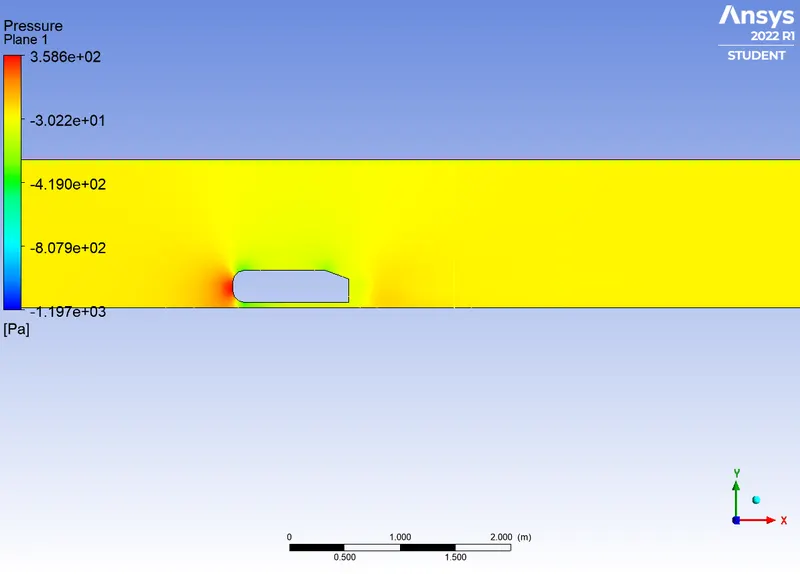
- Velocity and pressure contours.
- The drag coefficient plot for a refined case.
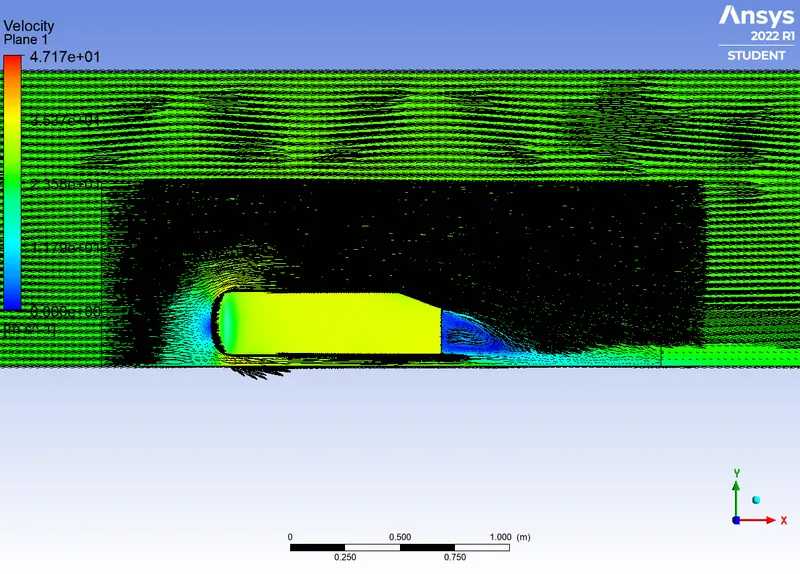
- The vector plot clearly showing the wake region.
- Perform the grid independency test and provide the values of drag and lift with each case.
Theory:
Ahmed Body:
Ahmed body is a simplified model of a car developed to study drag force and its importance. The aerodynamic properties of a car determines the ride comfort ,stablity,and performance of a car,due to the effect of drag force sourrounding the body it creates a low pressure region at the rear end of a car called as wake region this is affects the above mentioned ....... . The body can be named into three regions the front round part, a rectangular middle part and a slanting rear part. Since higher drag force could lead to more fuel consumprion,this simple model helps in designing a more suitable car to overcome the drag force. Therefore this model serves as a benchmark design for developing a car.
The different results such as drag and lift force co-efficient,velocity and pressure changes, visulising the vortices and wake regions developed can give the designers ideas to of where this points and regions so that they could introduce new designs to reduce it. The number of different studies carrier out using this model made it more powerful model as still an aerodynamic designer uses the exprimental datas of Ahmed body under wind tunnel testing to validate for their computational devloped models. As the majour flow around the body is turbulant flow either of k-epsilon or k-omega model is used to compute the results. The rear slant part is has a critical angle of 30°, the significant of this angle is immportant as this is responsible for creating the wake region at the rear end. At first hand the wake region is due to a phenemenon called as Flow Seperation that occurs at the very tip of a body,here it is the rear part. So, if the slant angle is greater it results in flow seperation and leads to creation of wake region and eventually increasing the drag-force. And for angle less than that the a counter vortices occurs which reduces the flow seperation.
Wake Region:
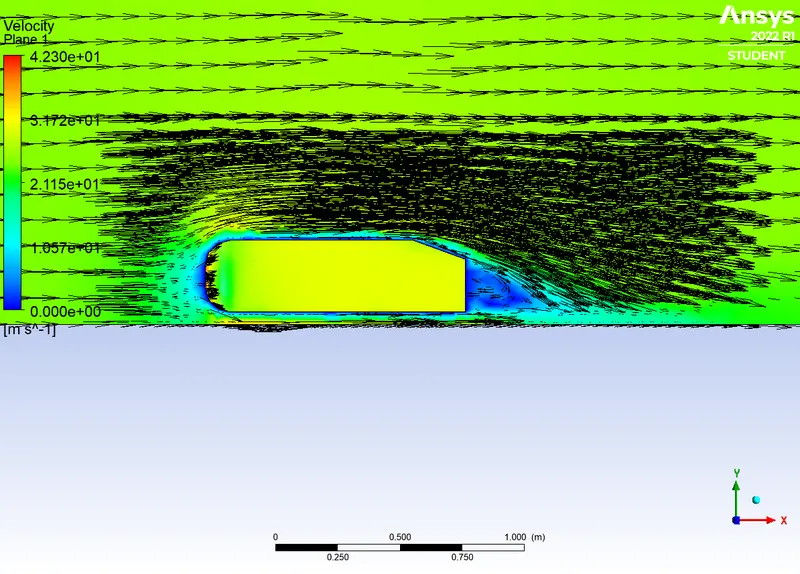
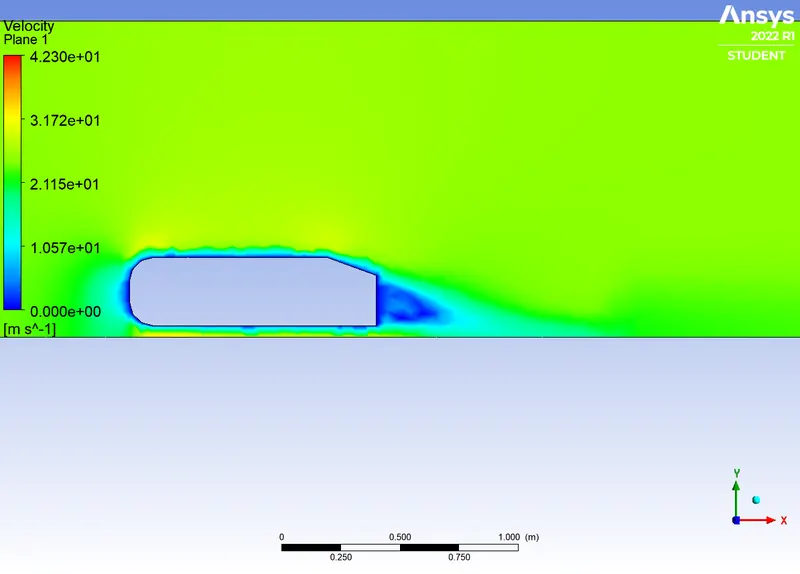
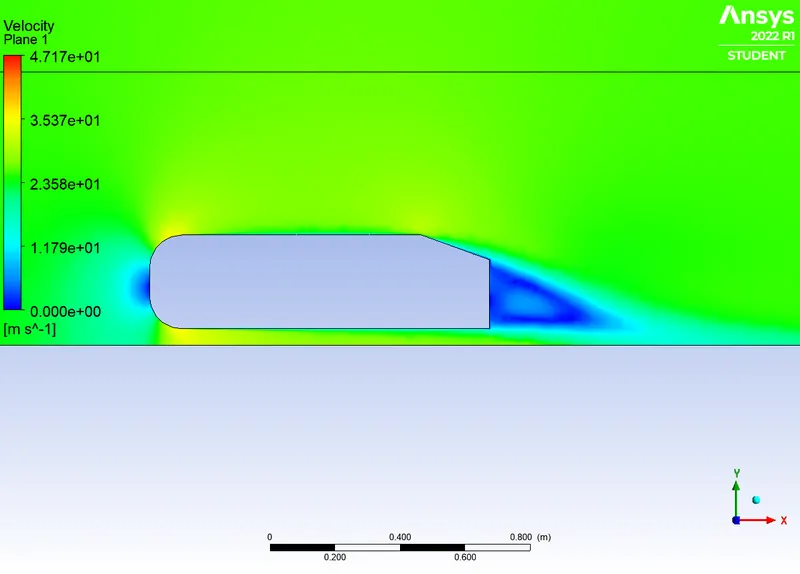
It is a region of recirculating flow (or vortices) behind a blunt body caused by flow seperation and Turbulance of the free flowing fluid. Inside the wake region are number of velocity vectors of small quantaties which are recirculated towards the body rather than away from it. This wake is due to flow seperation of a fluid.
Flow Seperation:
The free flowing fluid around any body will be under constant force ,this will make the fluid being in contact to the surface above which the fluid flows, this is majourly because of viscosity. So that the fluid will not be able to seperate inself away from the body and contnious to flow anlon the profile of that body. This developes a boundary layer over the surface ,and the fluid transition from the surface to the free space beyond the body will be smooth if the profile is smooth, but in case of blunt bodies where this does not happens (ie commercial cars) ,the boundary layer will begun immidieatly after the profile and causes seperation. And this point is called as seperation point and a downstream vortices occurs beyond this which causes drag force. The effect of reynolds number and viscosity is a major consiration in this case. The reynolds number give the relation between fluid inertial force and its viscous force,so higher reynolds number means lower viscous force and more chances of boundary layer seperation. Because, inertial force will increase the dynamic pressure ,which is formed due to faster motion of fluid and makes it as a turbulant flow,Thus the viscous force which makes the fluid adhered to the surface is overcomed.
Negative Pressure in Wake Region:
The body flowing in a free flowing fluid accumulates the fluid particles it its front end of the body as it tears the incomng fluid,this accumulation creates a high pressure region ahead and induces drag. The nature of the body is less stream line and creates a negative pressure or void behind the body and the chang in pressure sucs the fluid into this region. Due to this low pressure region the area behind the wake region at atmospheric pressure fluid would be pulled into this thus creating small eddies in form of vortices.
Another possible explation will be the creation of high turbulant kinetic energy,due to the seperation of boundary layer. The generated vortices and kinetic energy is due to less viscous force at the seperation point. These are a forms of energy,so what happens is that the energy is converted into this form by the high potential energy of the flow before separation manifested by high pressure. So, high turbulant kinetic energy in wake region is accompanied by low pressure.
Point of Seperation:
It is a point where the velocity gradient and the pressure along x-axis tends to zero. This is the point where the viscous force which helps in adhersion of fluid over the profile overcomed by inertial force and the fluid starts to seperate away from the boundary.
Procedure:
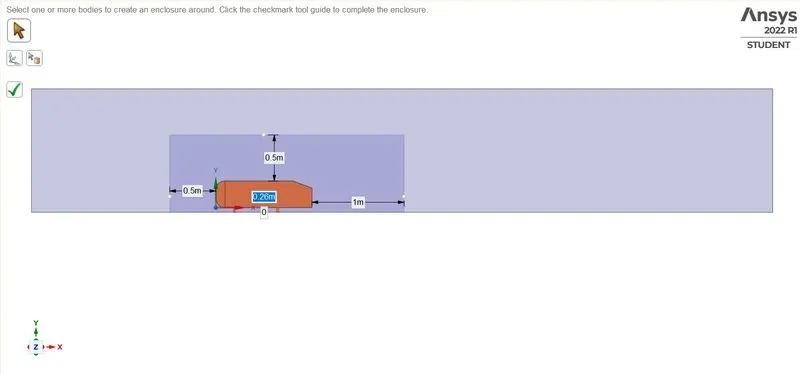
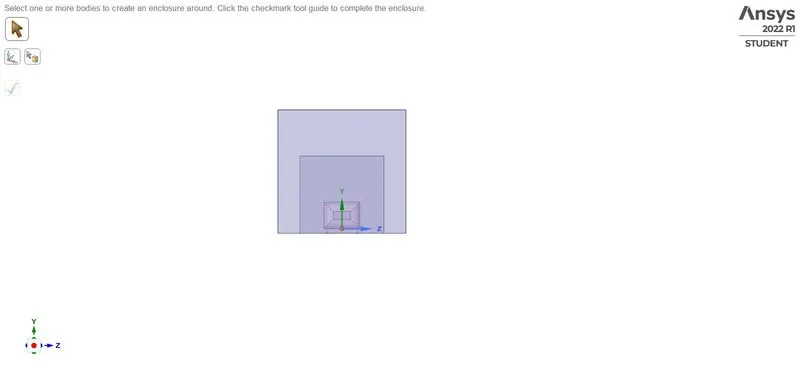
- First we open space claim an import the Ahmed Body. Since the flow is an external flow we create a local closeed volume inside which the ahmed body is enclosed into.We create two such enclosures ,the second enclosure is created to study the wake characteristics more precisely with more mesh refinement the dimention of this enclosure is given based on the size of the wake region created.
- Since the two enclosures overlap ecahother ,this would result in creating mesh inside the ahmed body and we dont want this as the flow is external. We use the interference option to extrude the interfered region from the model. And we have to enable the share option to allow the enclosure to share properties. Since the entire body is perfectly symmetry we use split body to split out the other identical half from the model. This way we can refine even better and obtain more elements for accurate results.
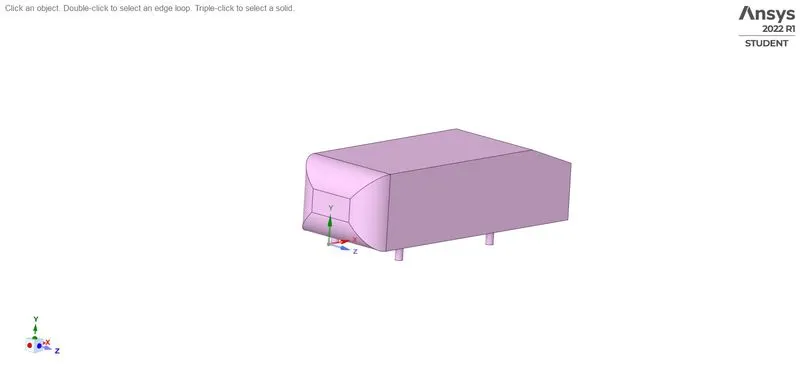
Symmetry body
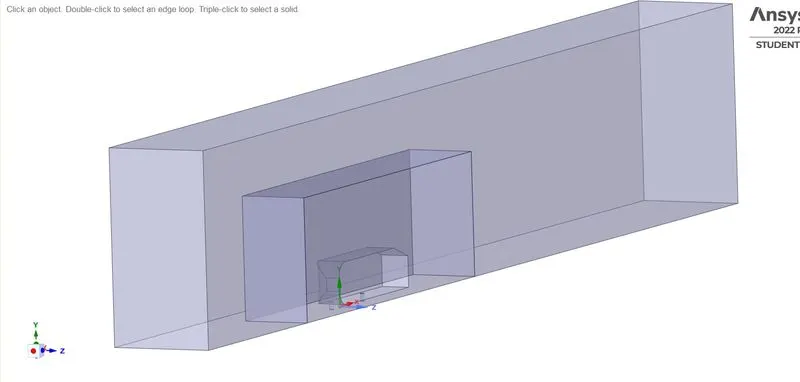
Then we use open the meshing interface where we name the faces of the body. Since we have to study the change in velocity and the wake region and its associated drag and lift forces we simulate for the following case,
- Default case
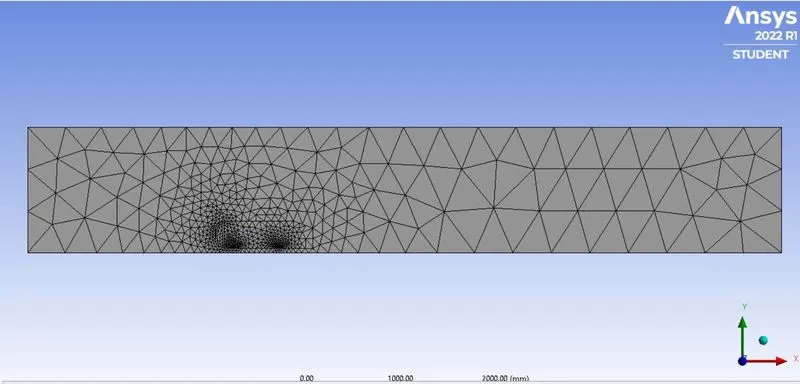
- 110 mm with no inflation
- 110 mm with Inflation
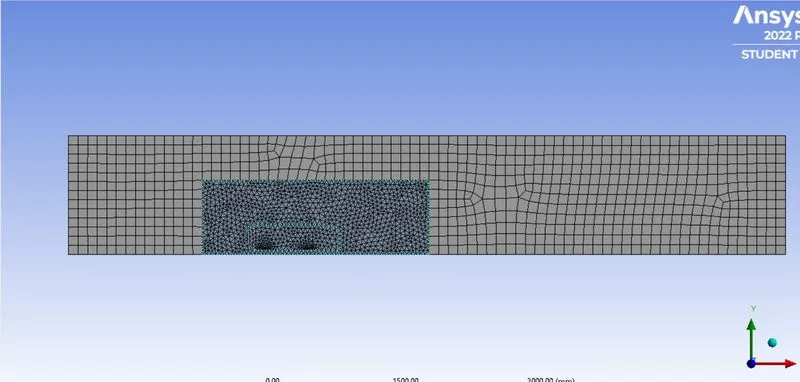
- 70 mm with infaltion
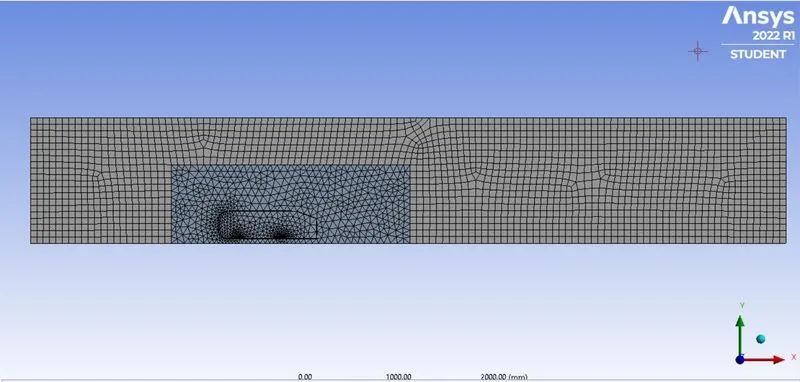
- 40 mm with Inflation
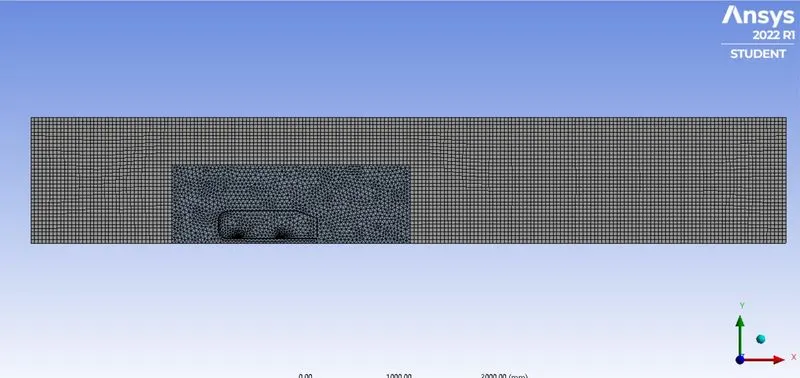
- 32 mm with Inflation
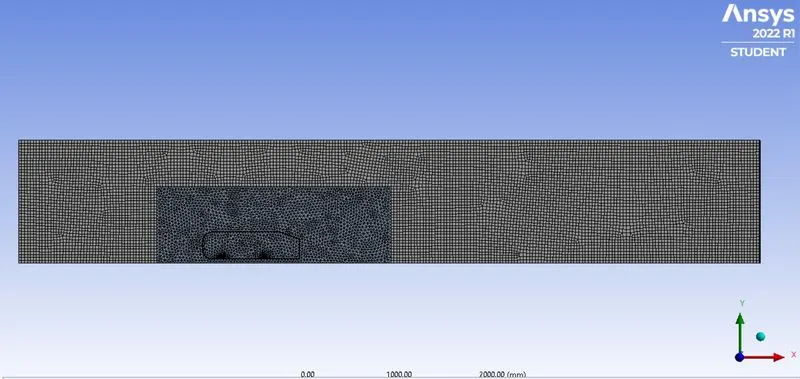
- We mesh the two enclosures with different mesh sizes for better capturing of results. Then since it is an external flow over the body we need to capture the changes near the oundary layer we create inflation layer near the boundary with total thickness option and create 6 layers of inflation.
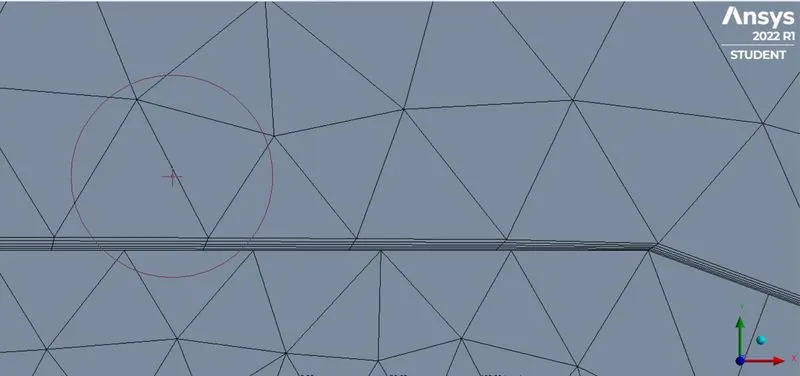
Total thickness = 8.33428 mm.
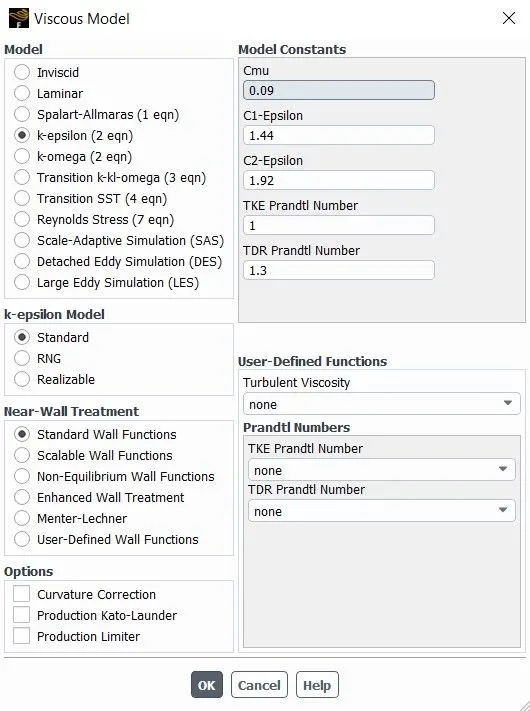
- Then we open the Fluent setup, since the flow is Turbulant we have to choose either of the turbulant model k- omega or k-epsilon turbulance model. We choose k-omega model for no inflation case and k-epsilon model for the Inflation case . The k-omega model is used for capturing the near wall changes to the boundary layer and the Y+ value ranges between 1-5 . this y+ value is how we determine the thickness of each inflation layer. And it ranges between 30-100 for k-epsilon model. And K-omega model will solve for the wall function irrespective of the inflation layer.
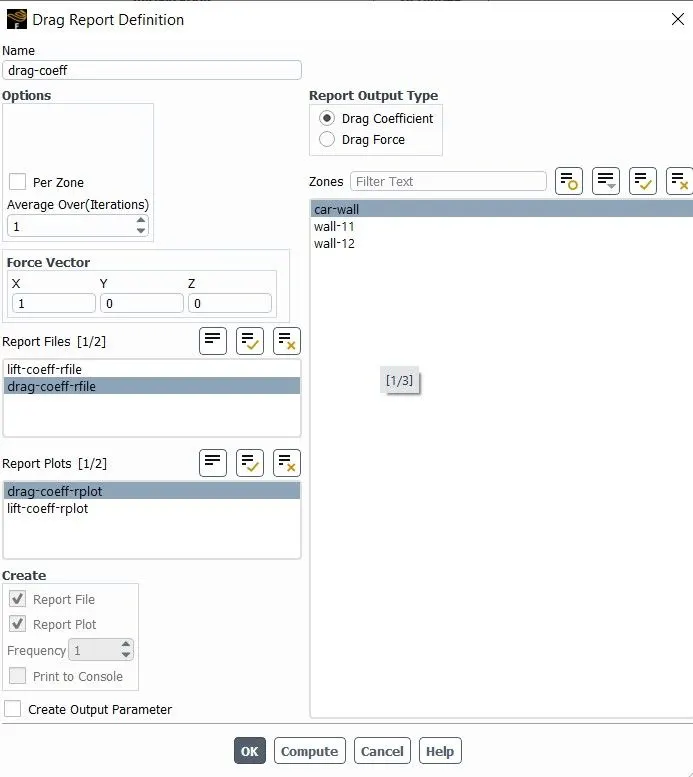
- We use pressure based solver and we give input velocity as 25 m/s. Then we create the plot to find the Drag adn Lift co-efficient we then initialize the hybrid solution.
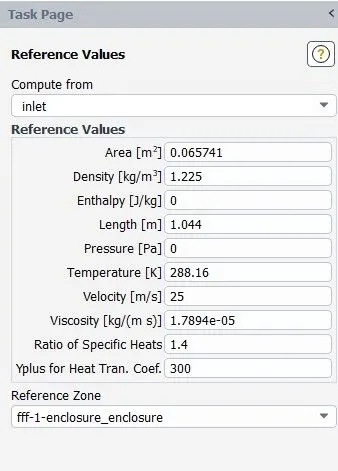
- From the projected area we find the area of the Ahmed body and we fill the reference value with the needed data.
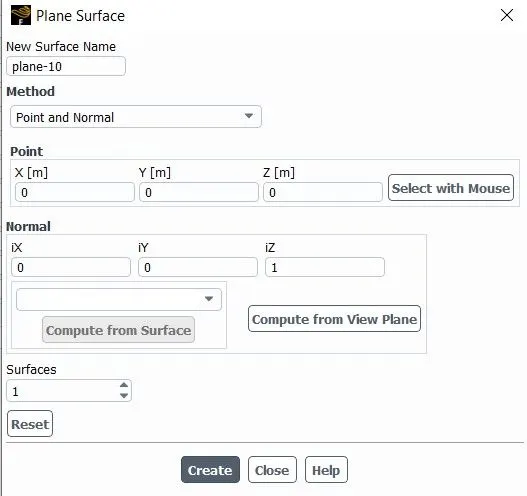
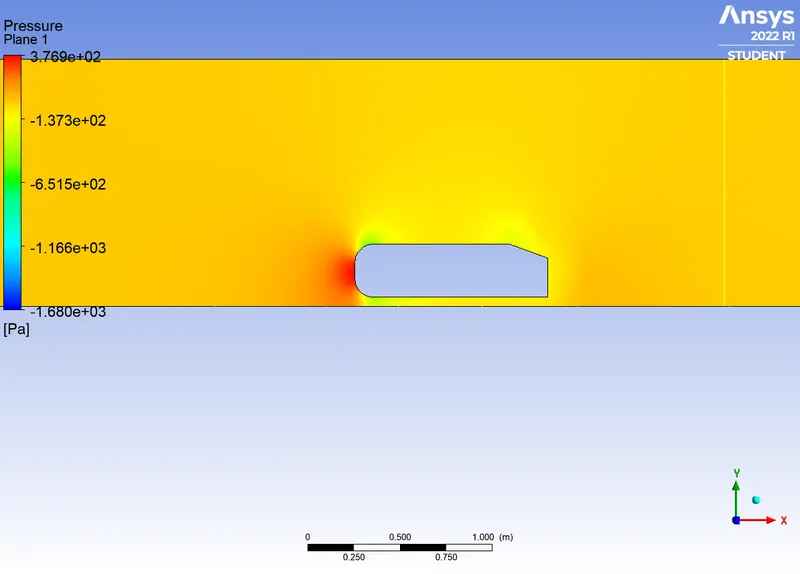
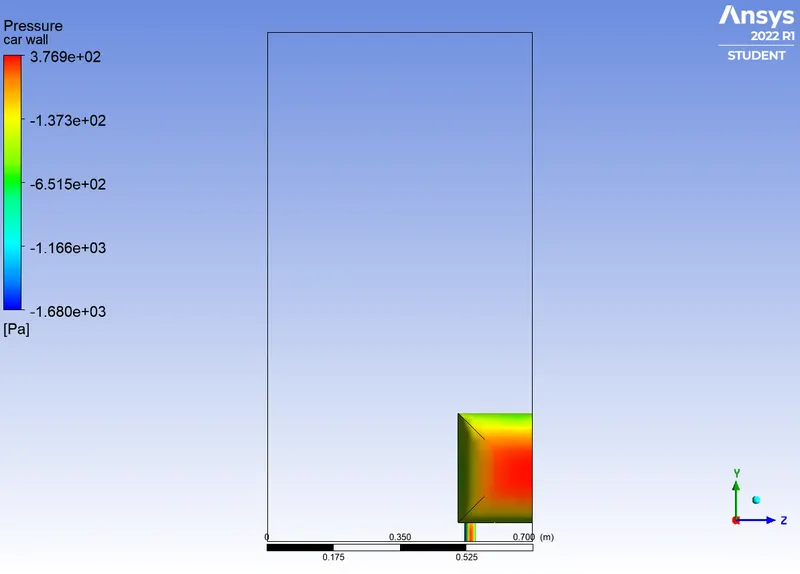
- Then we create a plane normal to z-axis for velocity and pressure contours. Fianlly we run the simulation till the solution is converged.
1. Default Case
Outer Enclosure : 409 mm
Face sizing : 200 mm
No. of elements :
Pressure Contours:
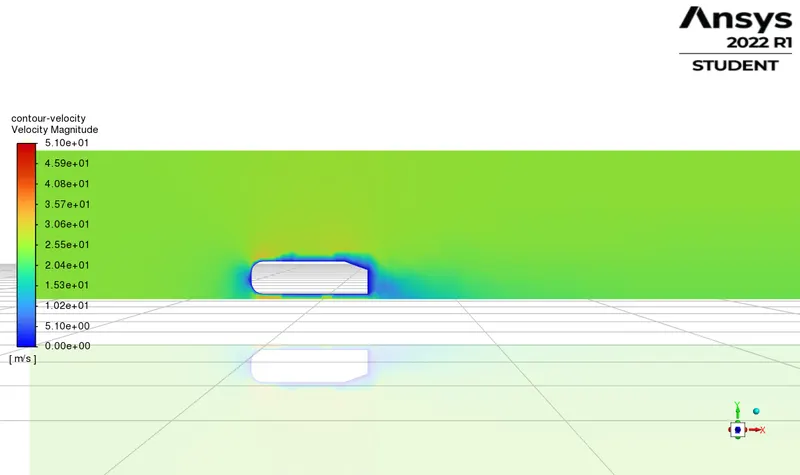
Velocity Contour:
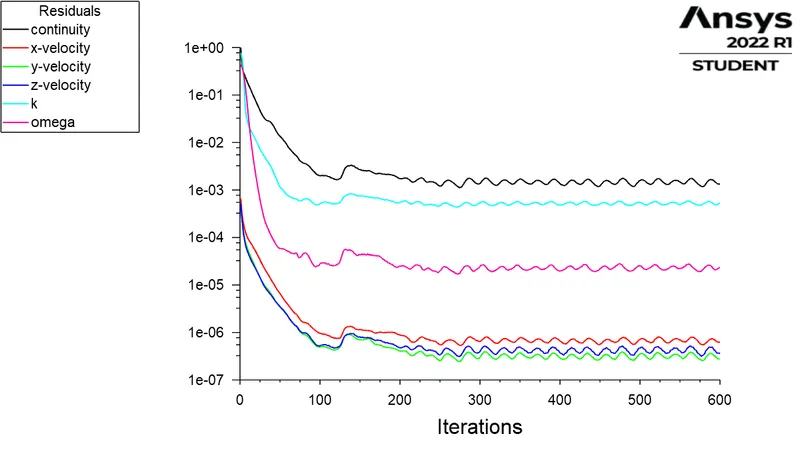
Resuidal :
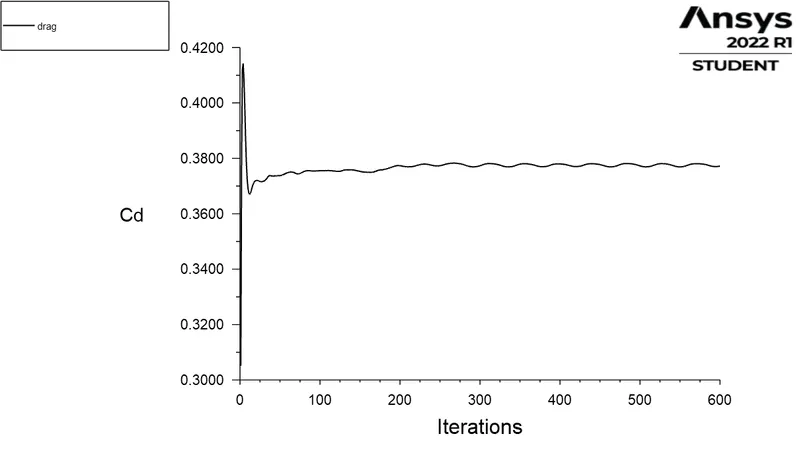
Drag-Coefficient :
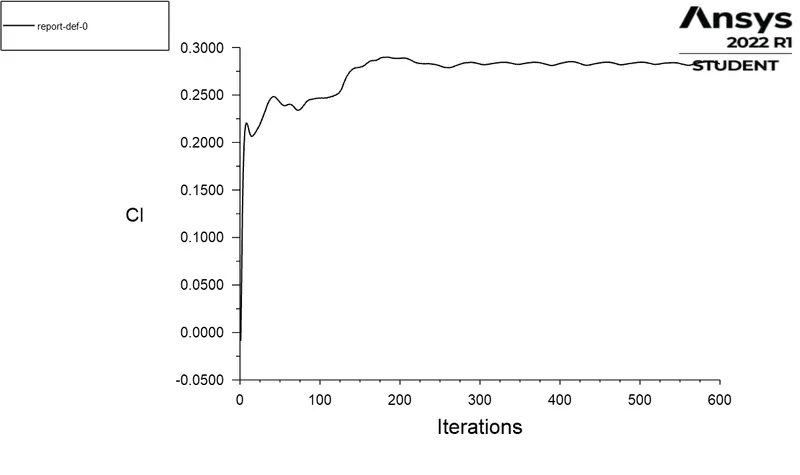
Lift-Coefficient :
Vector:
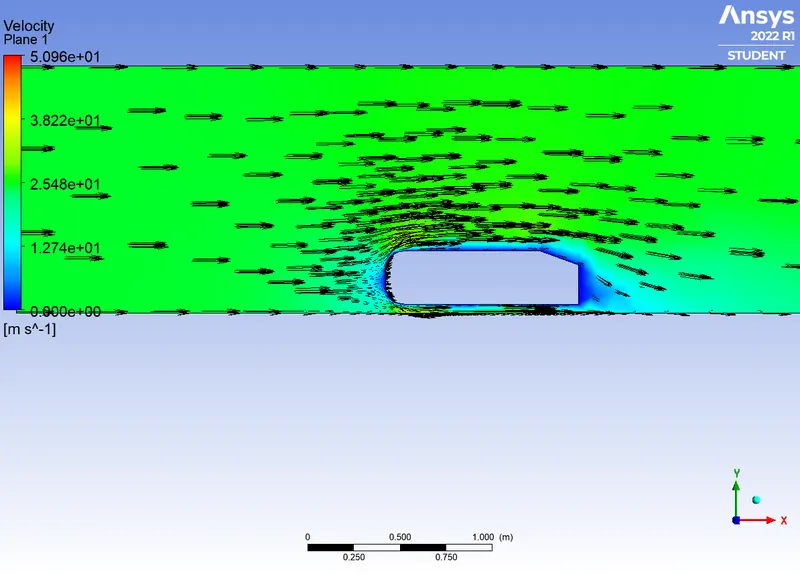
Wake :
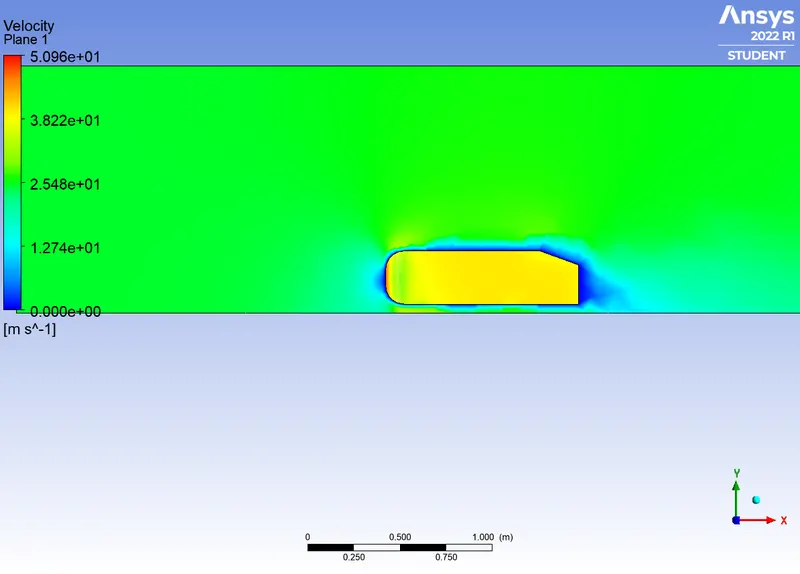
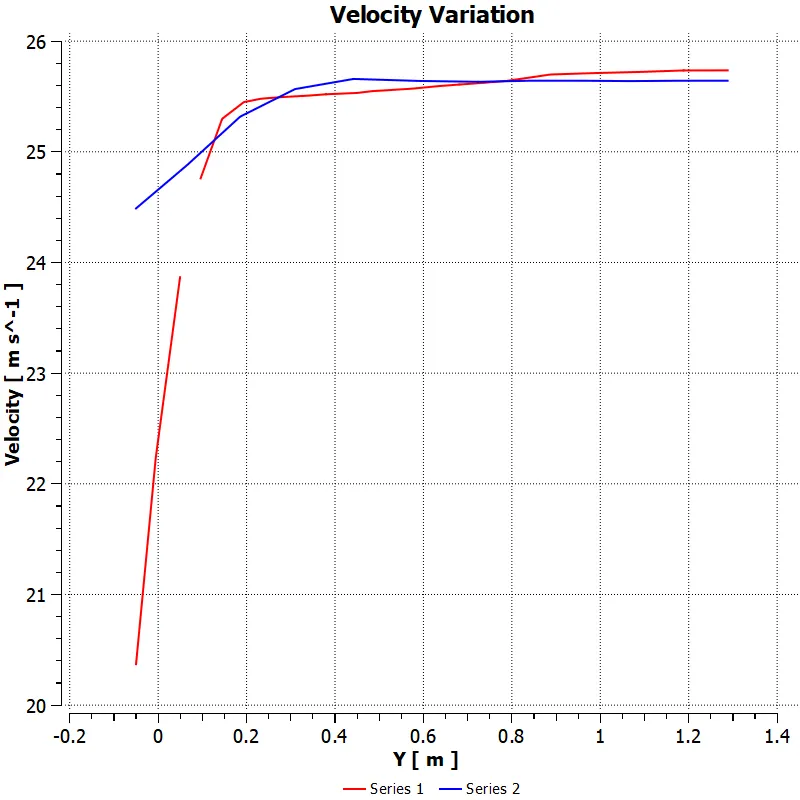
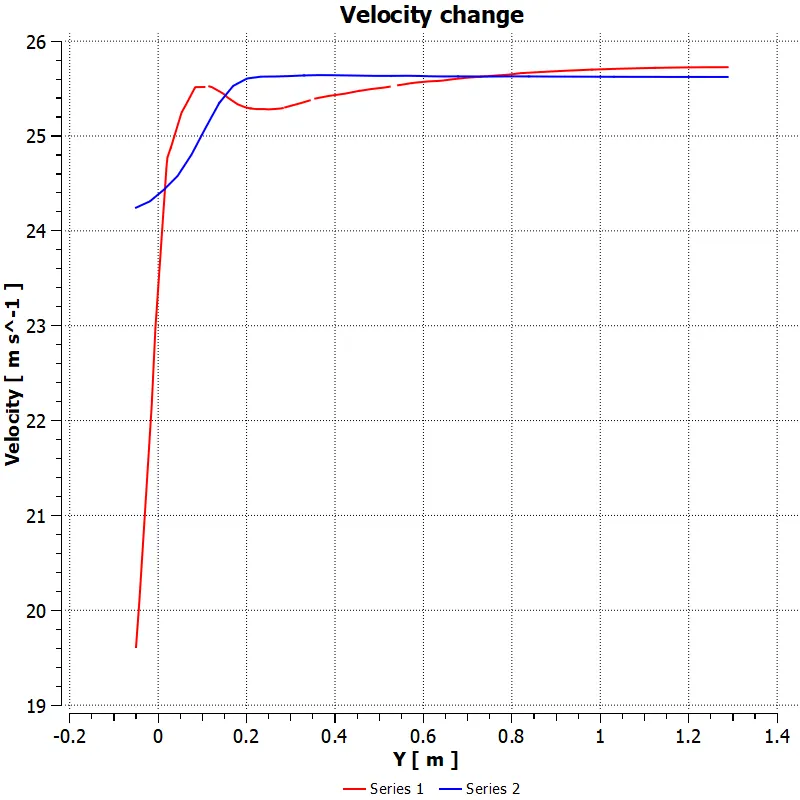
Velocity change along y-axis:
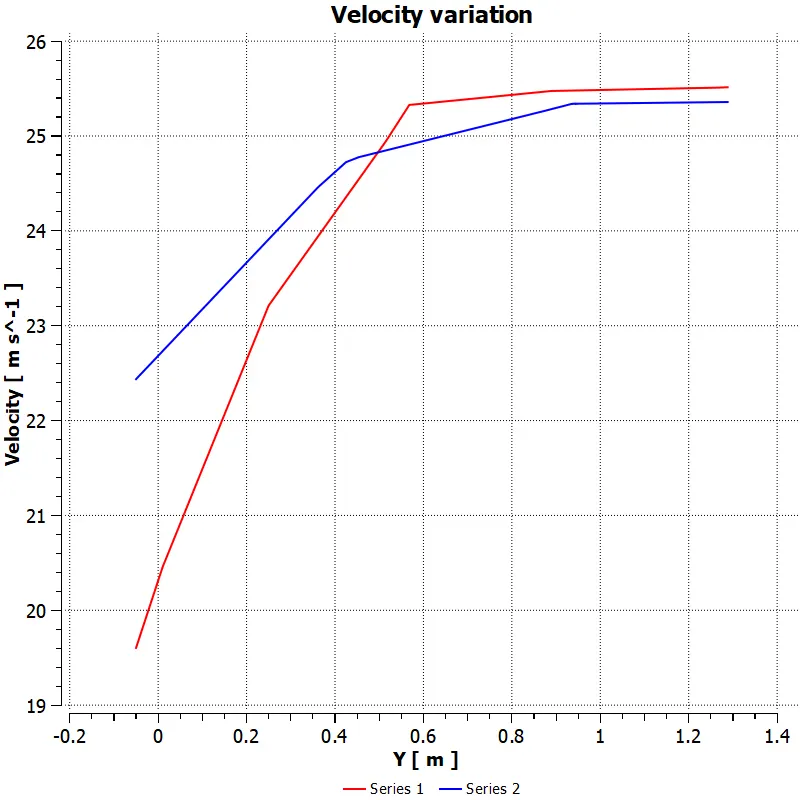
2. 110 with no Inflation (k-omega)
Outer Enclosure :110 mm
Inner Enclosure : 50 mm
Face sizing : 10 mm
No. of elements : 47760
Pressure Contours:
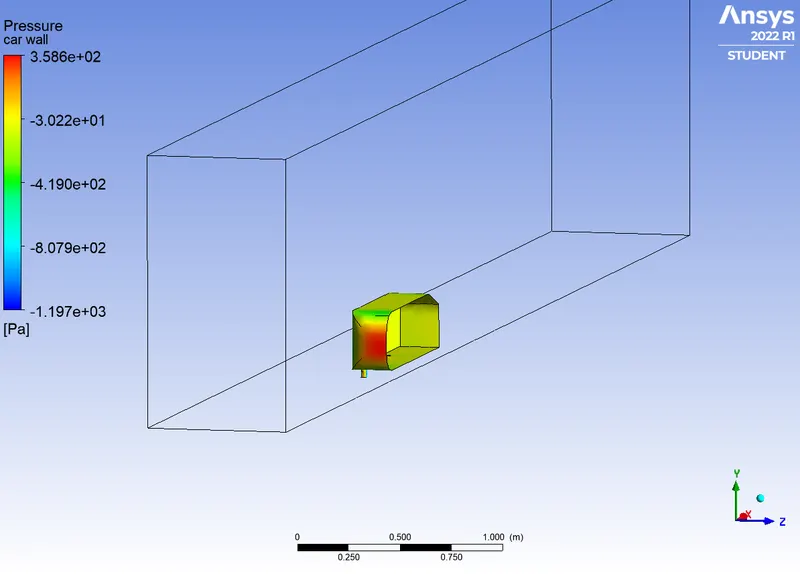
Velocity Contour:
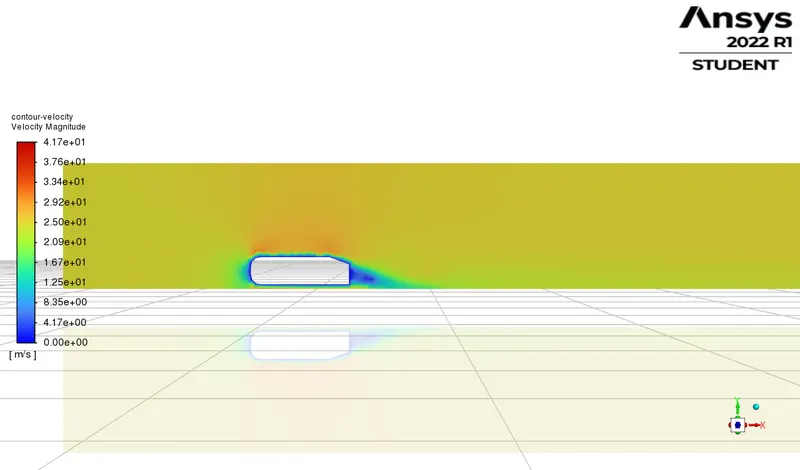
Resuidal:
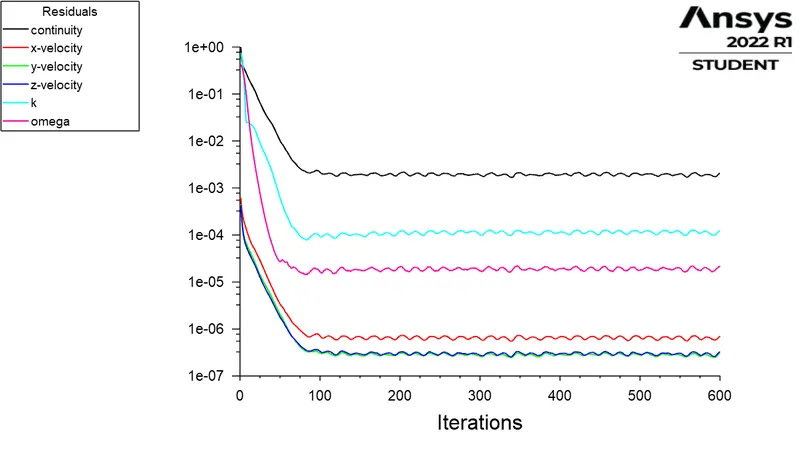
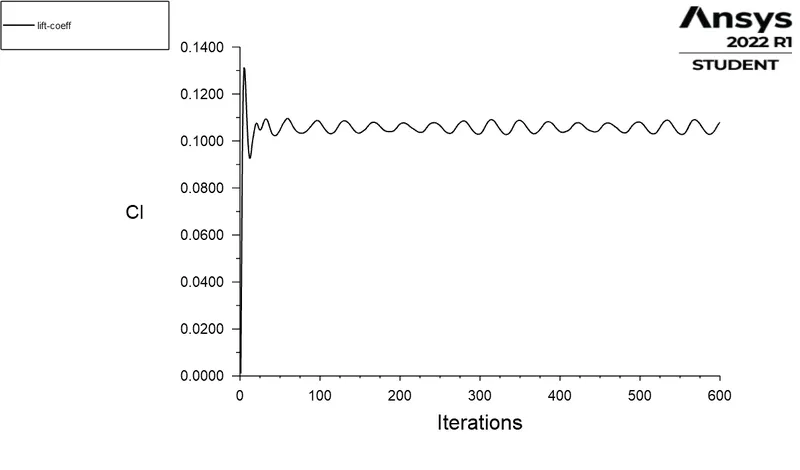
Drag-Coefficient :
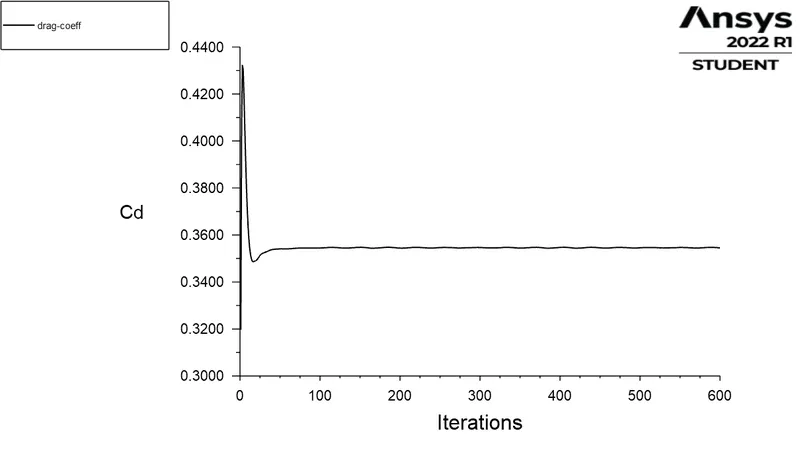
Lift-Coefficient :
Vector:
Wake :
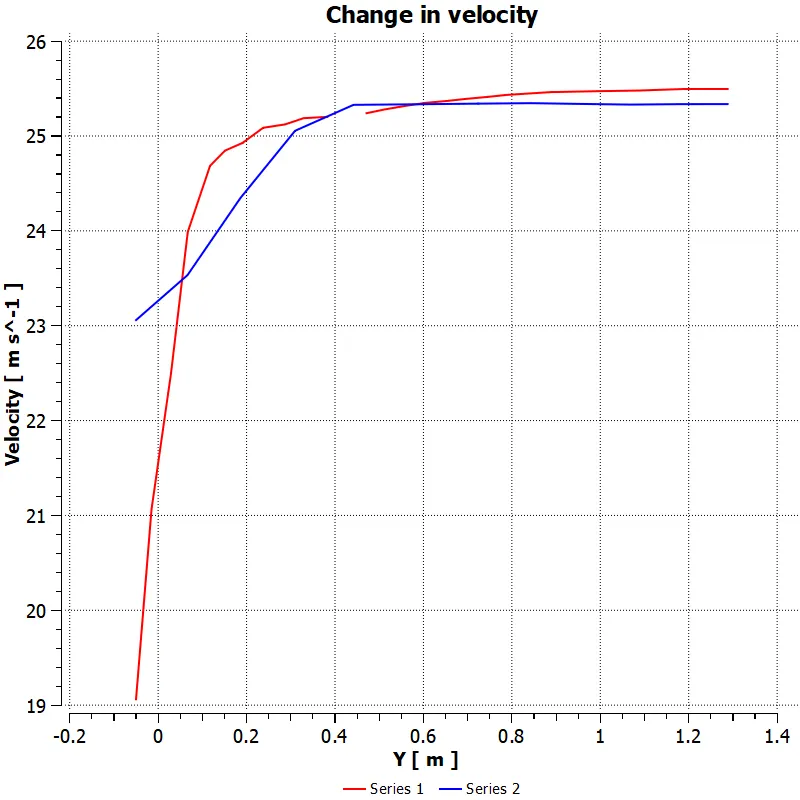
Velocity change along y-axis:
3. 110 with Inflation
Outer Enclosure : 110 mm
Inner Enclosure : 50 mm
Face sizing : 10 mm
Inflation Total Thickness : 8.3342877 mm
No. of elements : 66510
Pressure Contours:
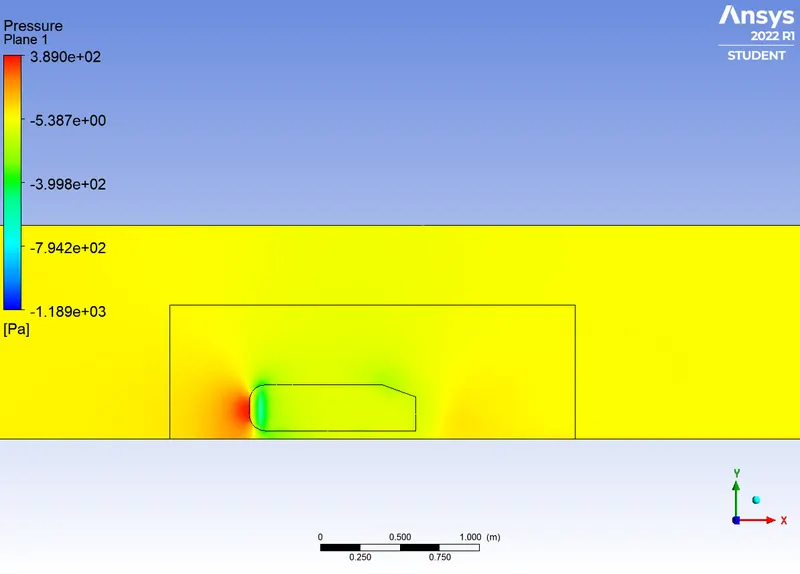
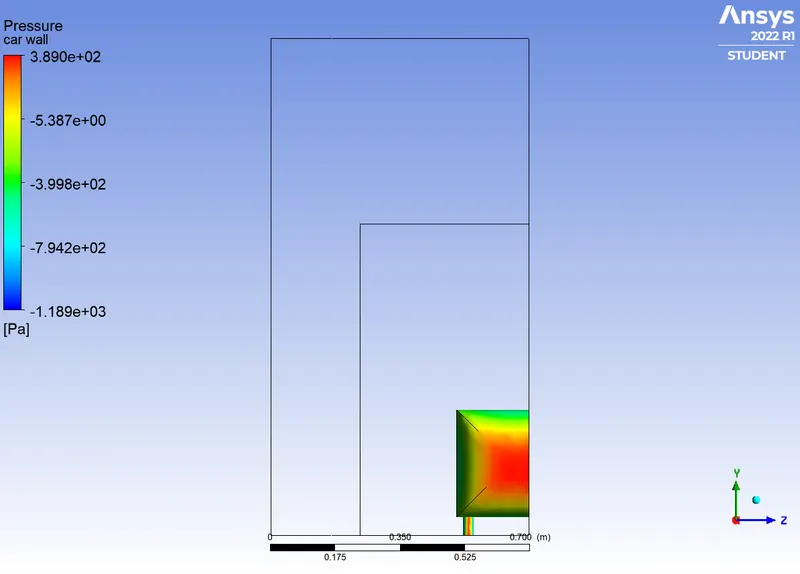
Velocity Contour:
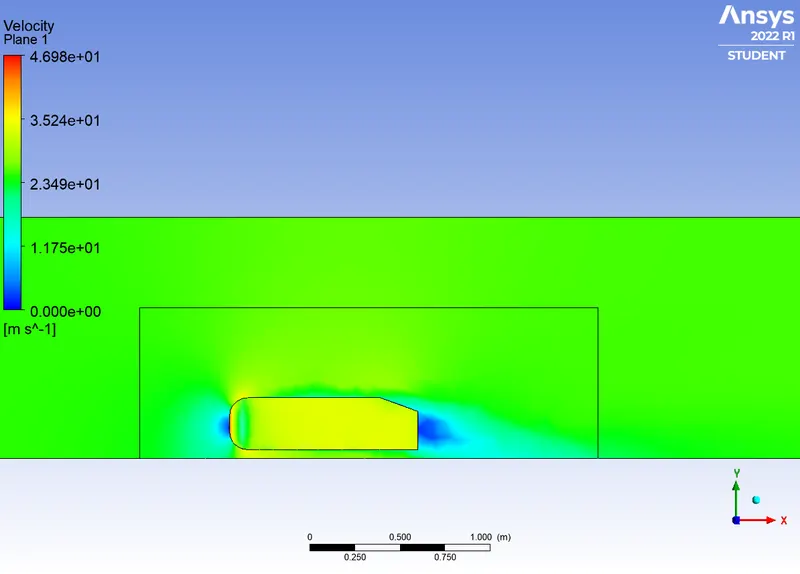
Resuidal:
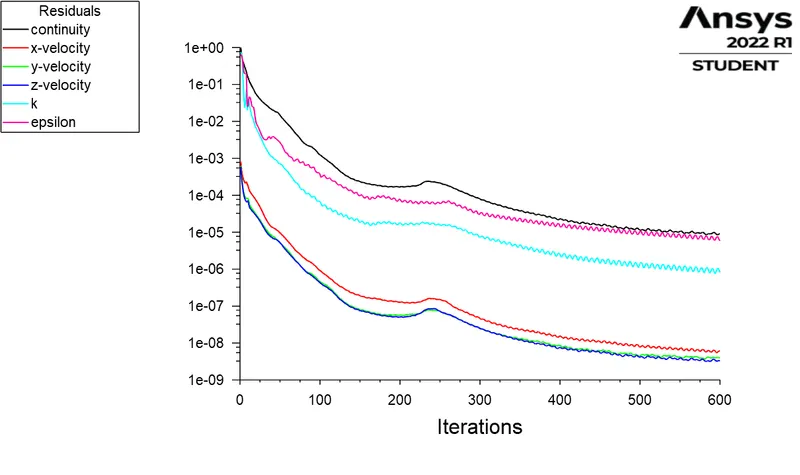
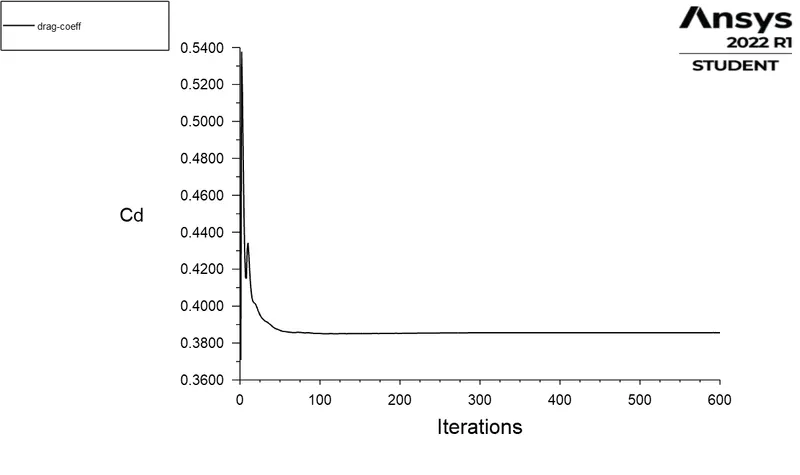
Drag-Coefficient :
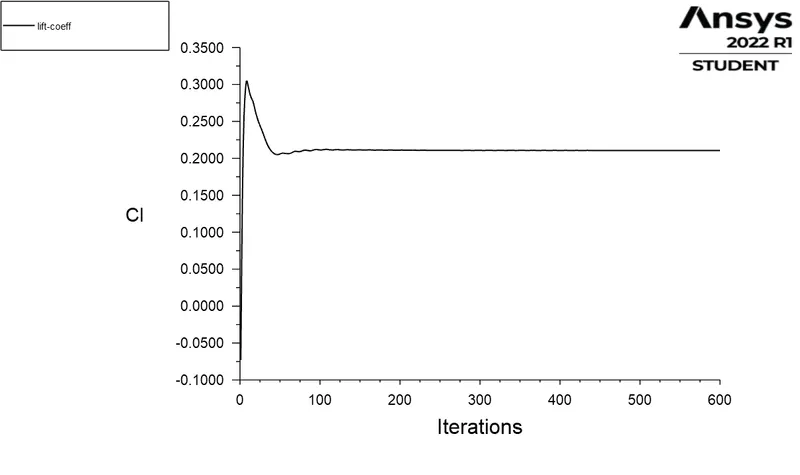
Lift-Coefficient :
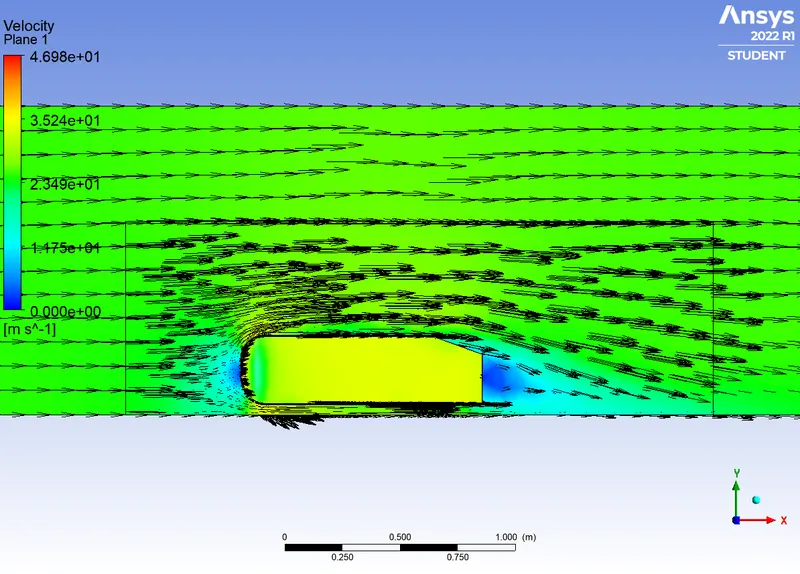
Vector:
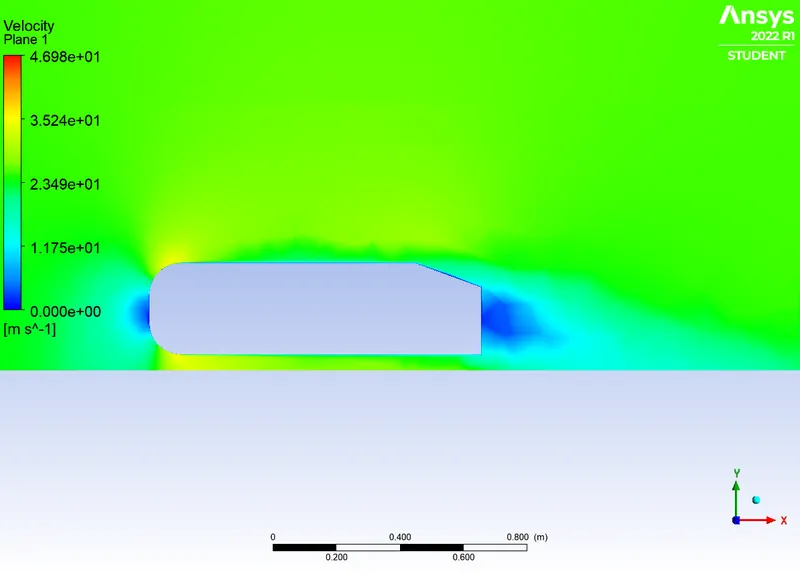
Wake :
Velocity change along y-axis:
4. 70 with Inflation
Outer Enclosure : 70 mm
Inner Enclosure : 30 mm
Face sizing : 10 mm
Inflation Total Thickness : 8.3342877 mm
No. of elements : 305101
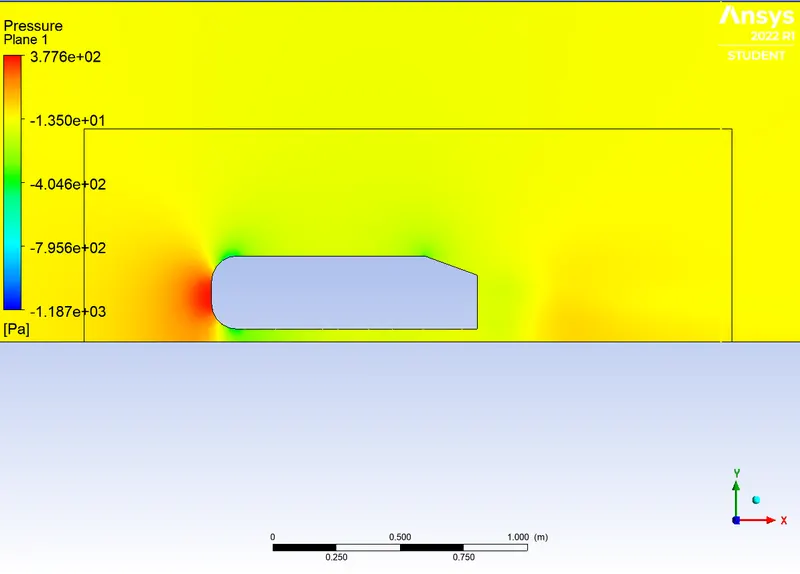
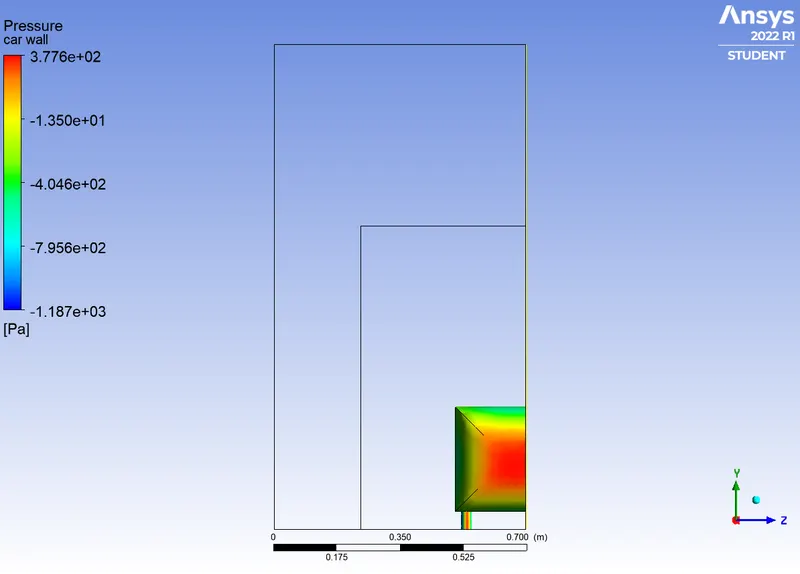
Pressure Contours:
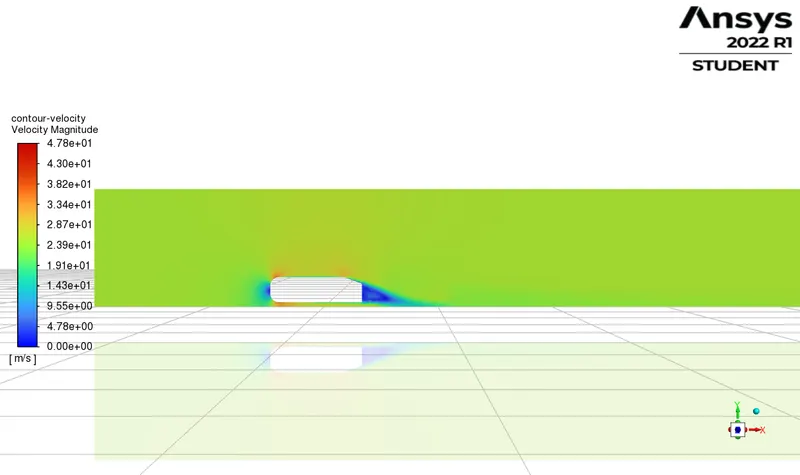
Velocity Contour:
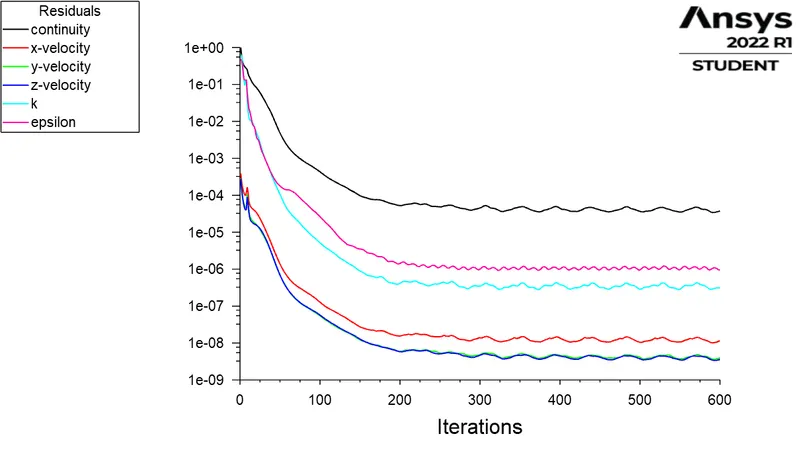
Resuidal:
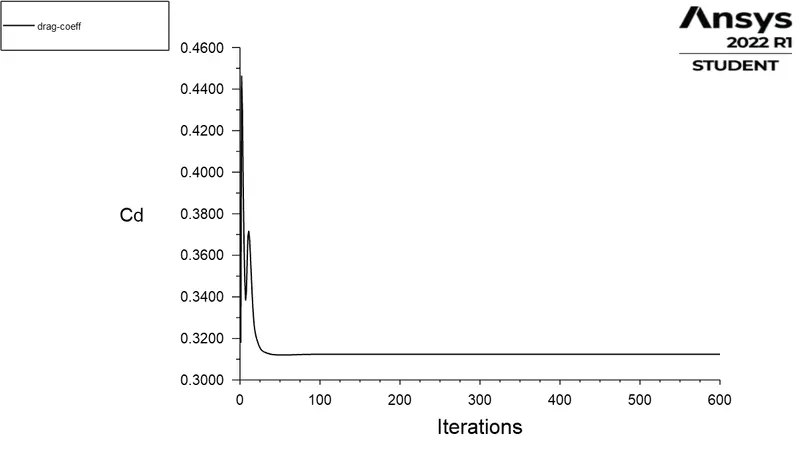
Drag-Coefficient :
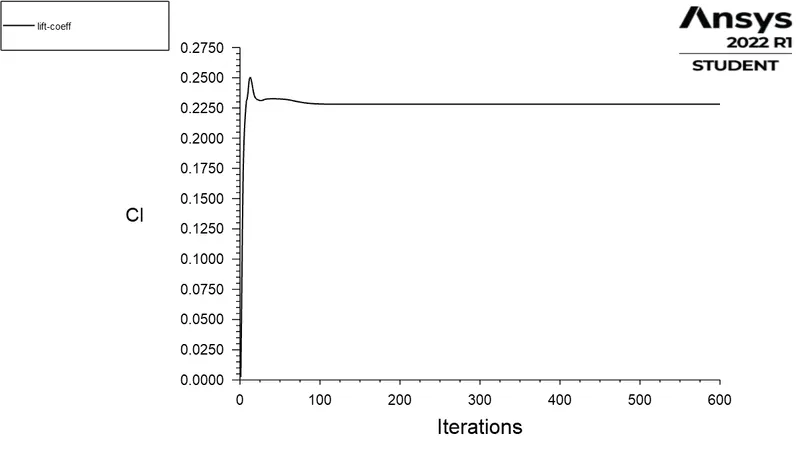
Lift-Coefficient :
Vector:
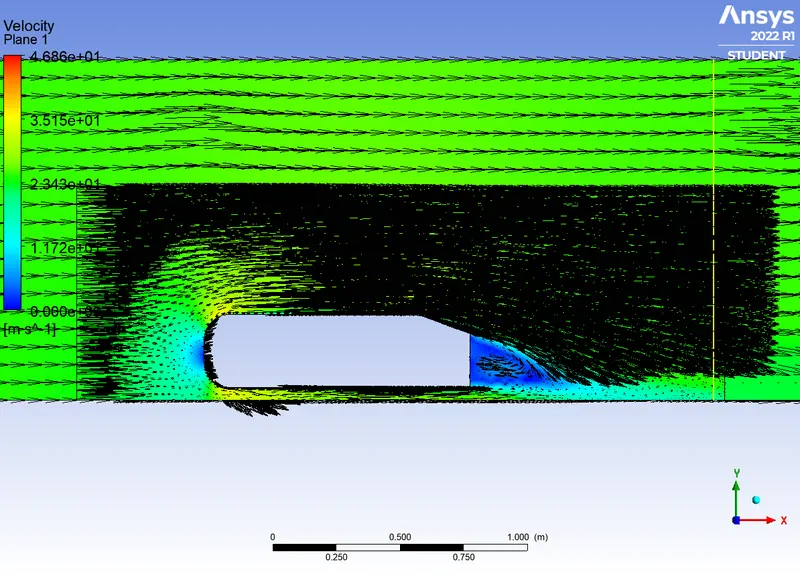
Wake :
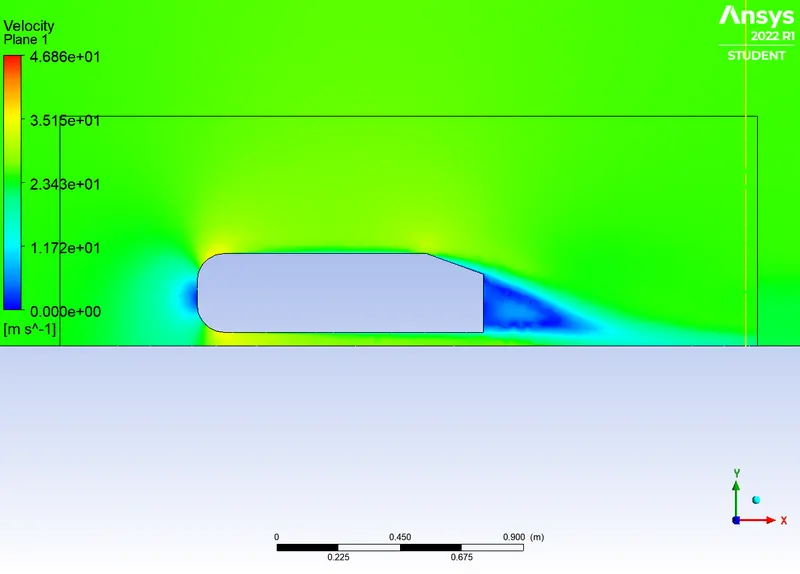
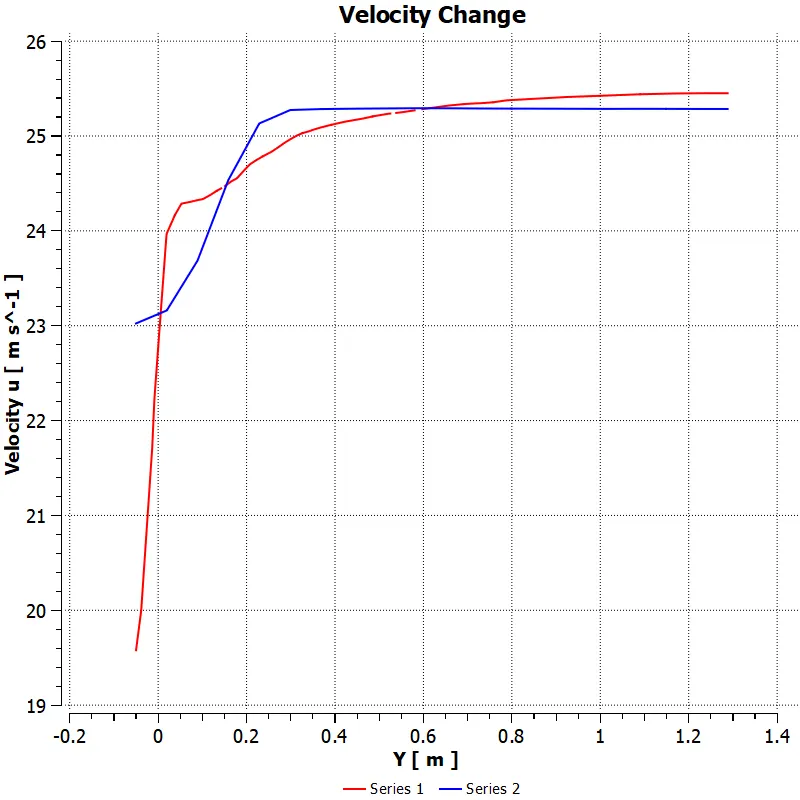
Velocity change along y-axis:
5. 40 with Inflation
Outer Enclosure : 40 mm
Inner Enclosure : 10 mm
Face sizing : 10 mm
Inflation Total Thickness : 8.3342877 mm
No. of elements : 260336
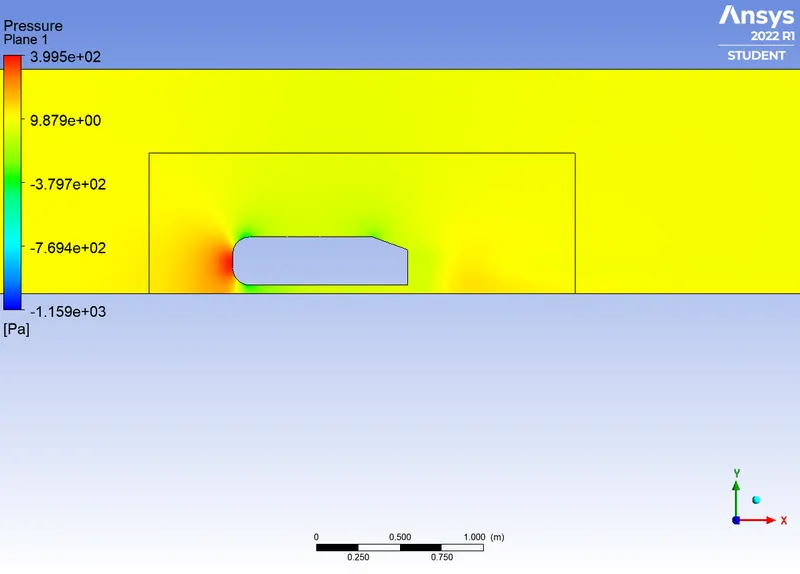
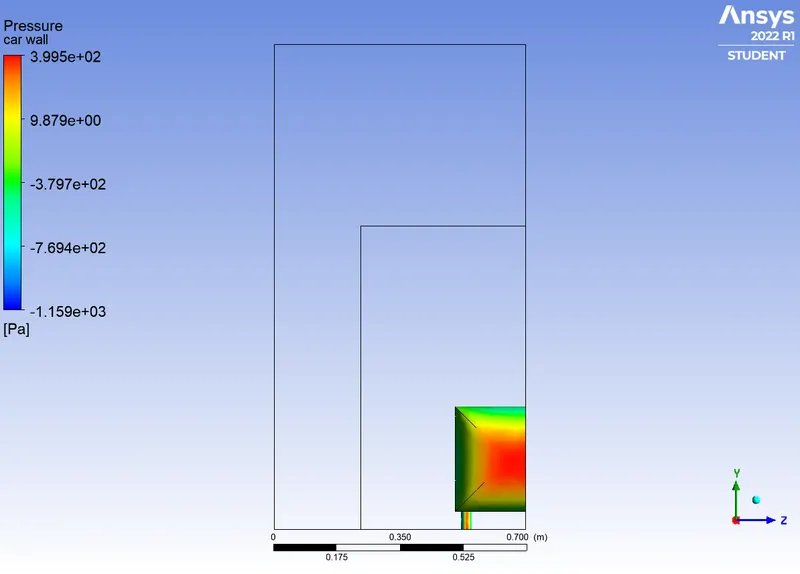
Pressure Contours:
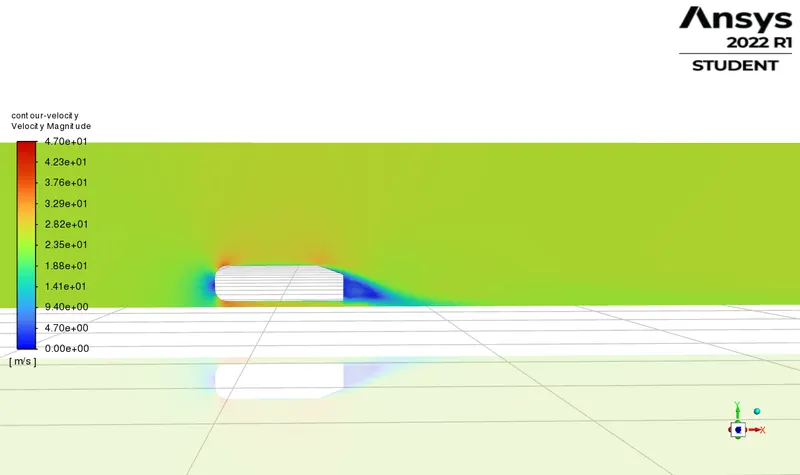
Velocity Contour:
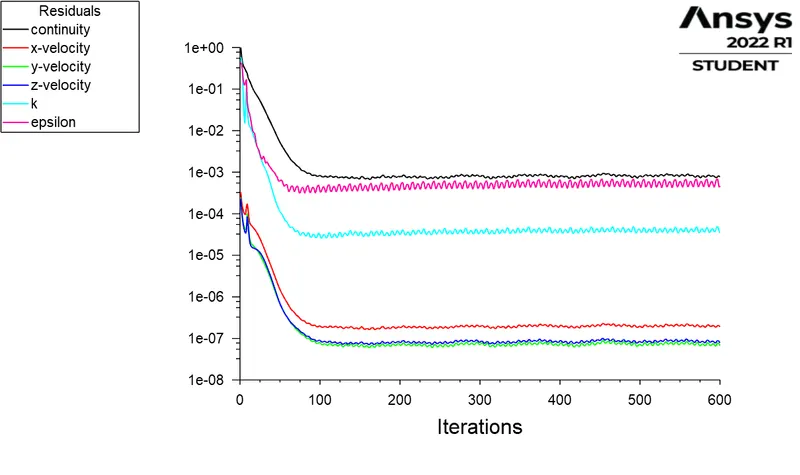
Resuidal:
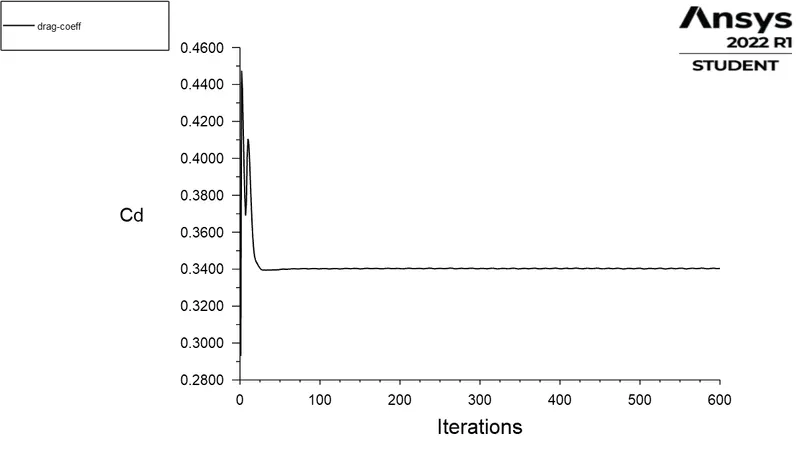
Drag-Coefficient :
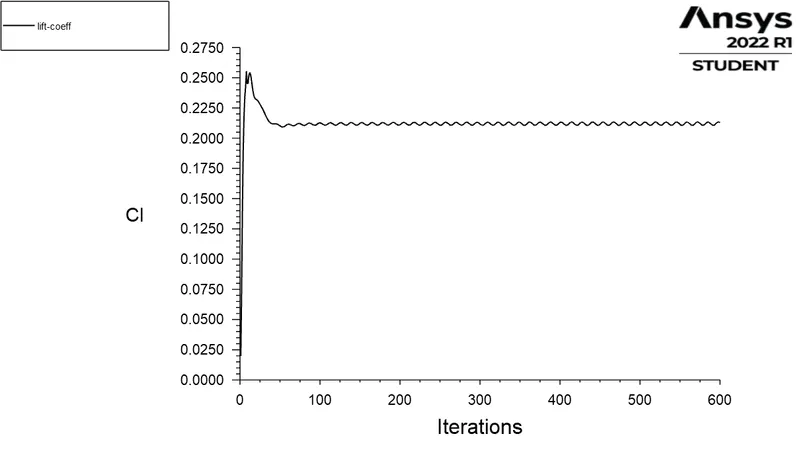
Lift-Coefficient :
Vector:
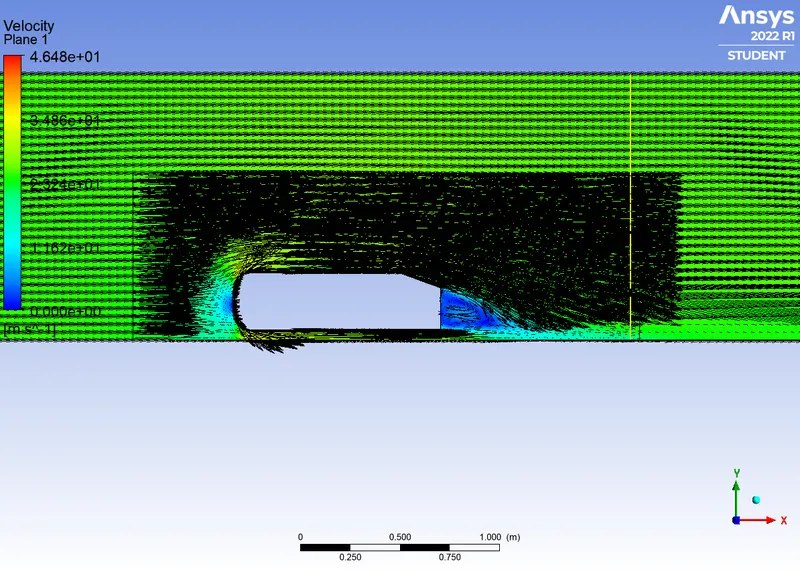
Wake :
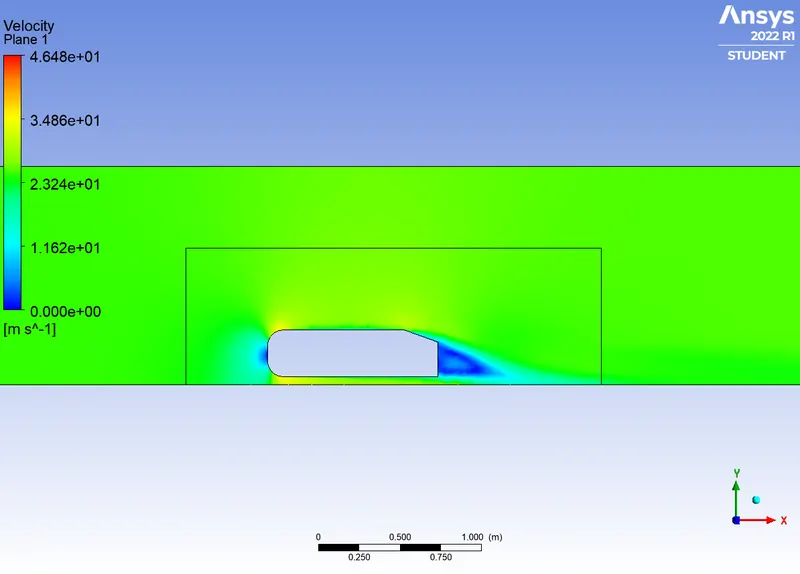
Velocity change along y-axis:
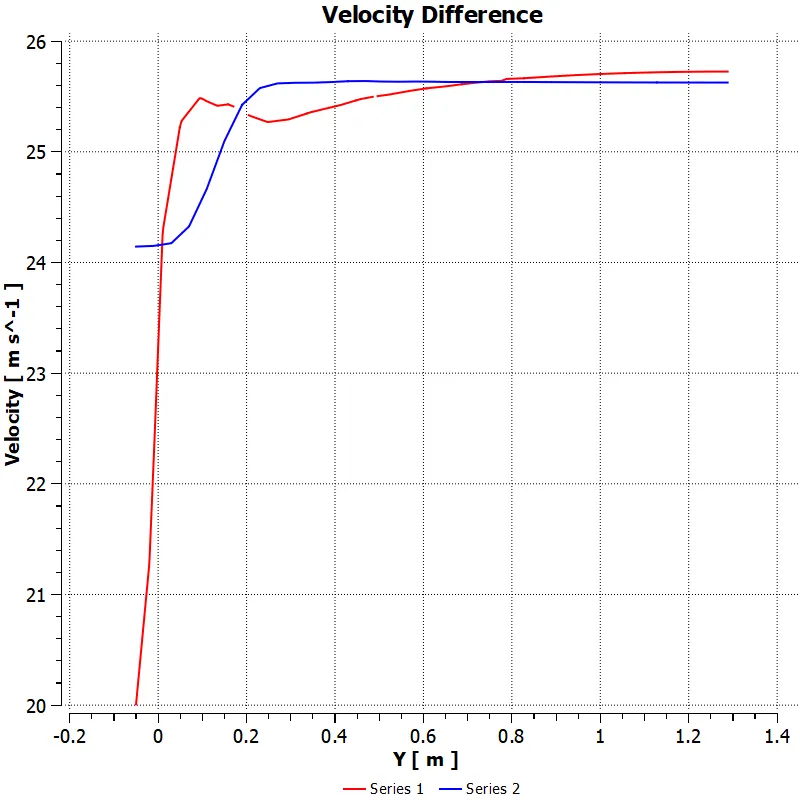
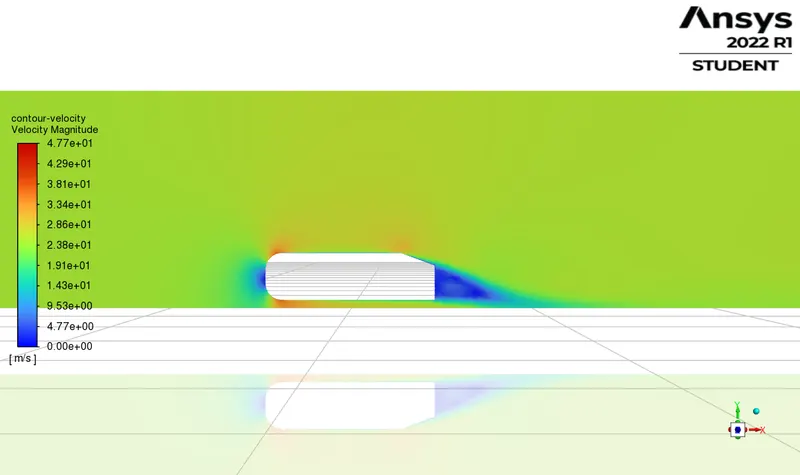
6. 32 with Inflation
Outer Enclosure : 32 mm
Inner Enclosure : 10 mm
Face sizing : 10 mm
Inflation Total Thickness : 8.3342877 mm
No. of elements : 478619
Pressure Contours:
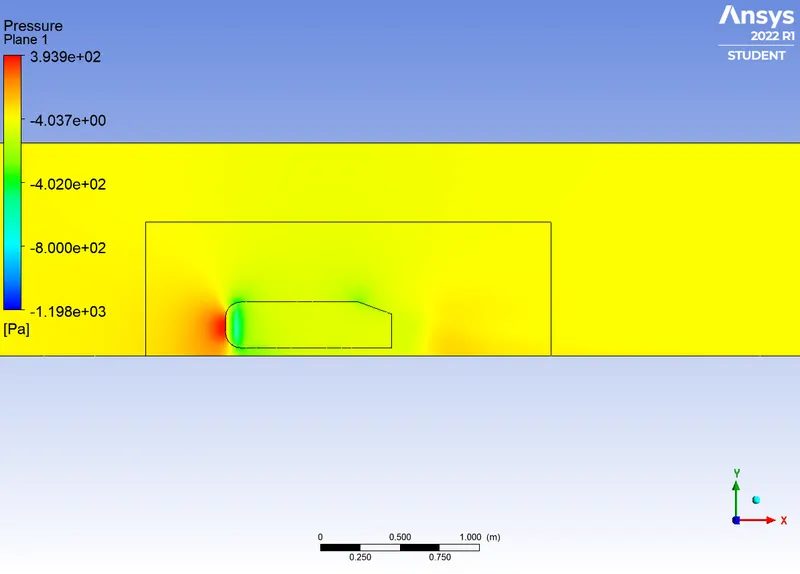
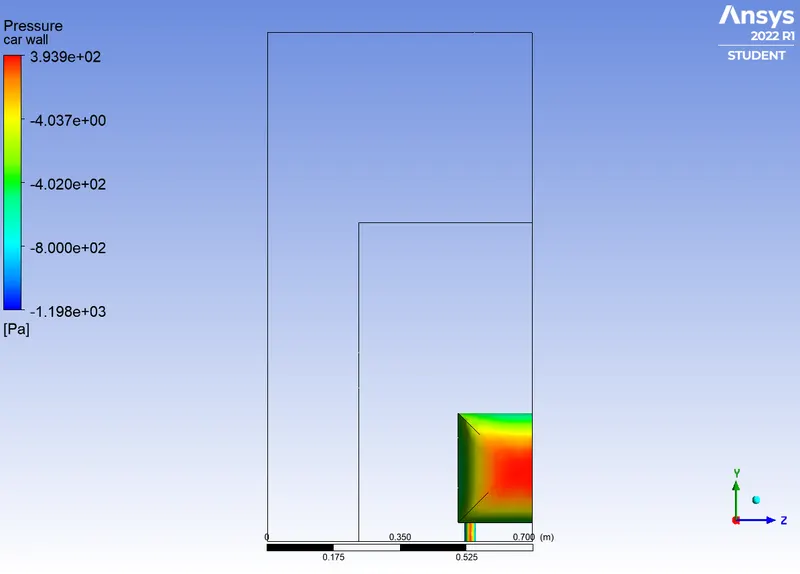
Velocity Contour:
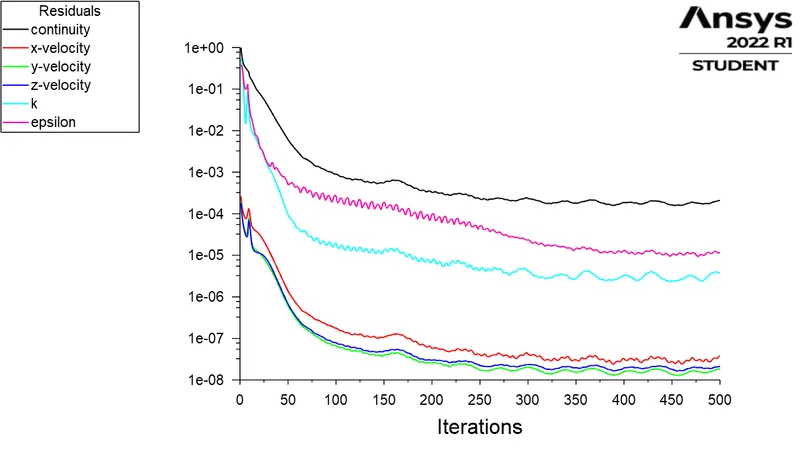
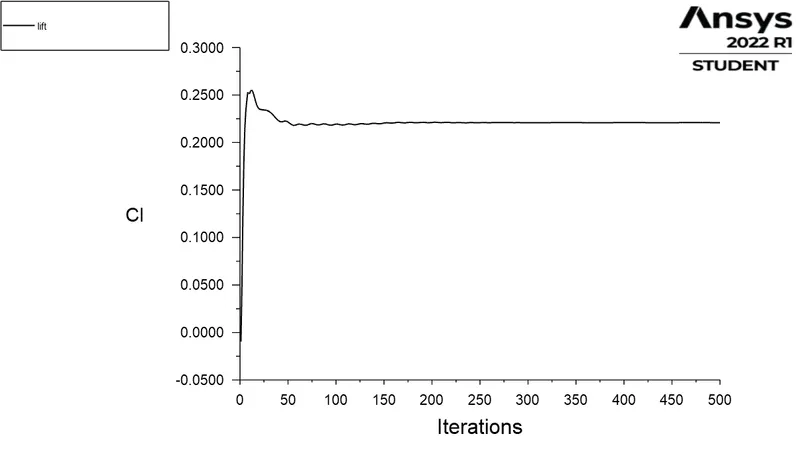
Resuidal:
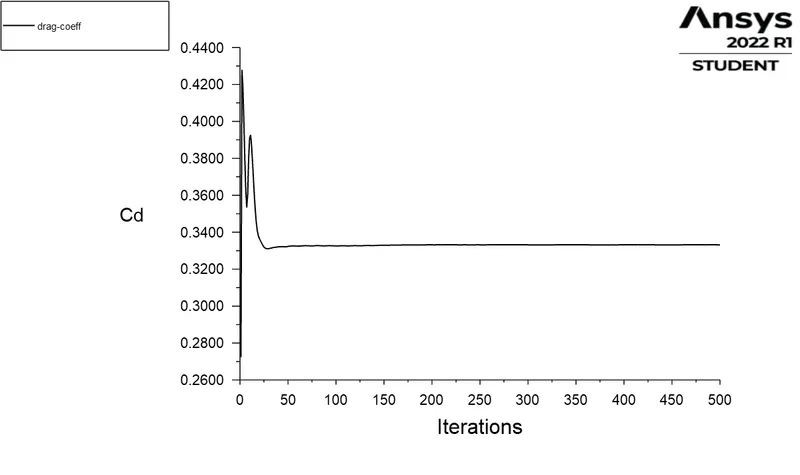
Drag-Coefficient :
Lift-Coefficient :
Vector:
Wake :
Velocity change along y-axis:
Conclusion:
| Mesh Size (mm) | No.of Elements | Drag-Coefficient | Lift-Coefficient |
| 110 | 47760 | 0.385612 | 0.210674 |
| 70 | 305101 | 0.312418 | 0.228101 |
| 40 | 260336 | 0.340391 | 0.212894 |
| 32 | 478619 | 0.332564 | 0.219361 |
The simulated conditions is with k-epsilon model with y+ value of 50 and the obtained reynolds number is 17,88,772.102. The expremintal drag co-efficient for the refined mesh size is equal to the therotical value of 0.33. The grid independency test therefore sattes the smaller cell size required for the accurate Drag-Coefficient value. using the appropriate Y+ value with the required model is vital foe the external flow simulation.Therefore the wake region is visualized and the co-efficient of drag is thus computed and verified computationally.