External flow simulation over an Ahmed body
OBJECTIVE
To run an external flow simulation on an Ahmed body and to analyse the coefficient of drift, lift with a free stream velocity of 25 m/s.
THEORY
- Ahmed's body and its importance
Ahmed body is a simplified car model, created to analyze the impact and flow pattern of drag, and is extensively used in automotive industries. The external dynamics gives a lot of information about fuel consumption, stability and comfort at high speeds. It is constructed in such a way that it has a round front part, a moveable z slant plane in the rear of the body to investigate the detachment phenomena at different angles and a rectangular box which links the front part and the rear slant plane. The prime objective of such a body is to analyze the flow processes involved in drag and therby modifying the design of the car to reduce the drag, hence enhancing the vehicle performance by reducing fuel consumption.
- The reason for the negative pressure in the wake region.
Due to the slant in the rear sides of the Ahmed body, flow separation and counter rotating vortices are generated at the slant edges. The ddrag forces keeps on increasiing with the slant angle and once it hits 30 degrees (critical slant angle), the drag force will be the maximum. For values higher than 30 degrees, adverse pressure gradient in between the slant and the roof is so intense that the flow fully detaches over the slant. However, below the critical slant angle, the flow still separates, but the pressure difference is still sturdy enough to generate substantial strream-wise vortices at the lateral edges. This initiates the downward motion over the slant, mainly in the downstream part. The flow around the Ahmed body has several separations from front to rear, and these flow separations contribute a larger proportion to the vehicle's drag.
- The significance of the point of separation.
Point of separation is defined as the region where the velocity gradient along with the pressure gradient falls to 0, and a negative pressure gradient starts to form after that point. It can be analyzed with the help of dP/dx and dV/dy plots
PROCEDURE/WORKFLOW
- GEOMETRY
- Import the geometry of Ahmed body to Spaceclaim.
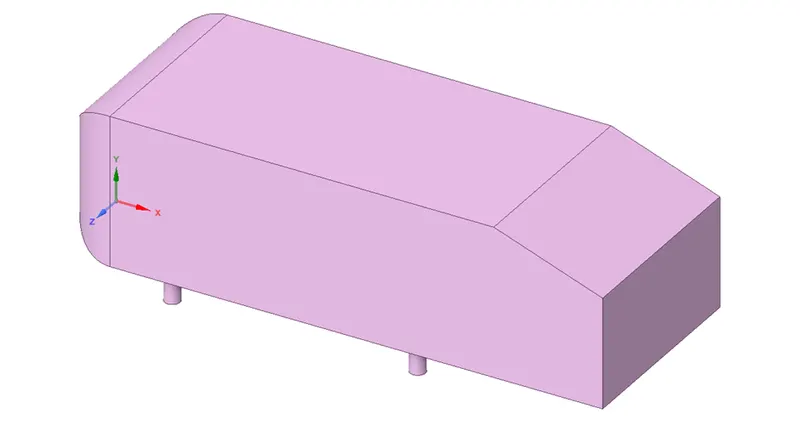
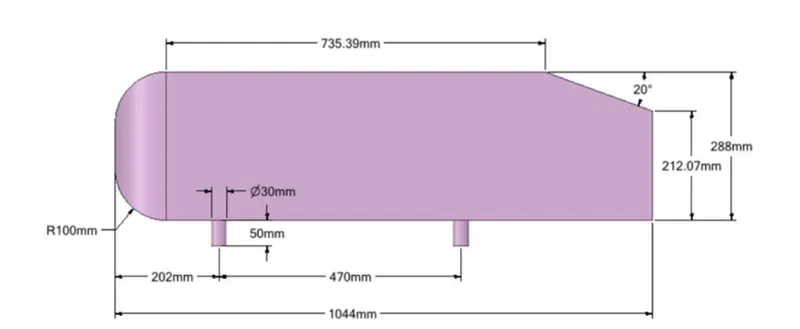
- To create the first enclosure, select the Ahmed body->prepare->enclosure ->provide the dimensions as shown
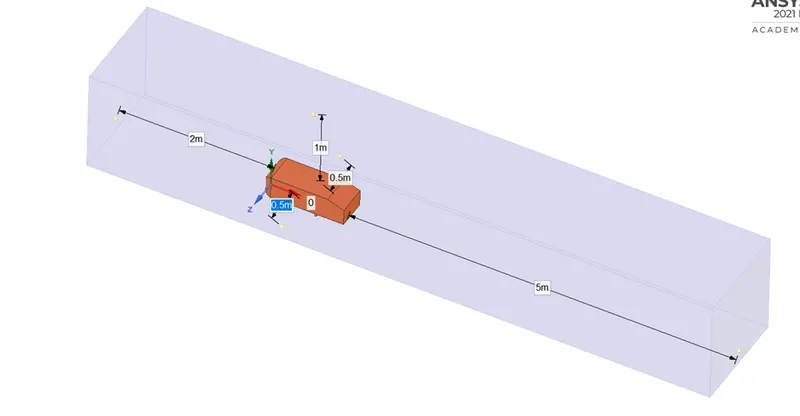
- To create the second enclosure, follow the same pattern and dimensions could be provided as shown.
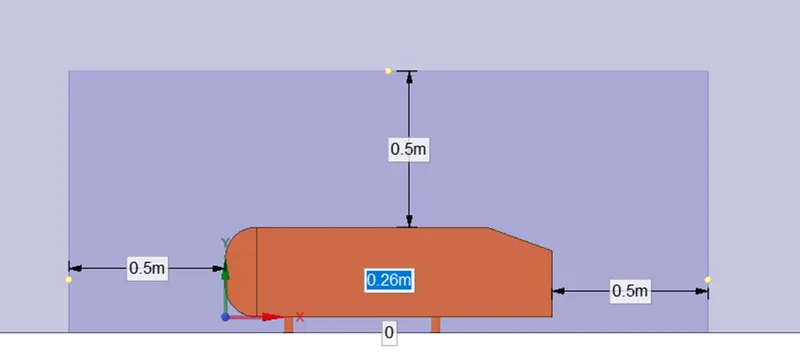
- The Ahmed body is suppressed for physics.
- MESH
- Provide the necessary named selections
- Mesh->element size->default->update
- Insert->method->select the outer body->multi-zone->element size =100, maximum element size=100->update.
- Insert->sizing->select the inner enclosure->element size =50 (later changed)->update
- Insert-> inflation->from named selecetion->select car body->first layer thickness->provide the calculated value-> number of layers =6->update
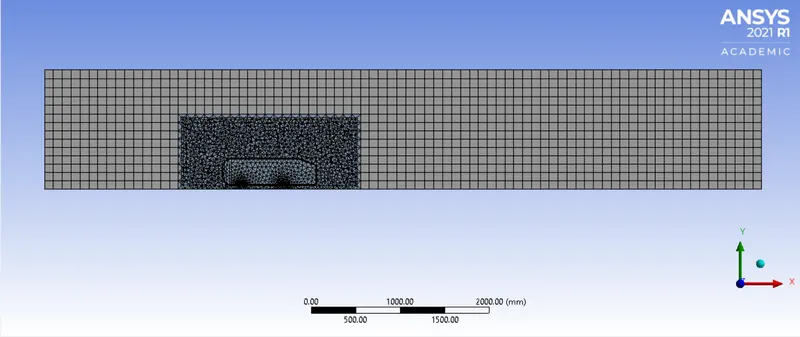
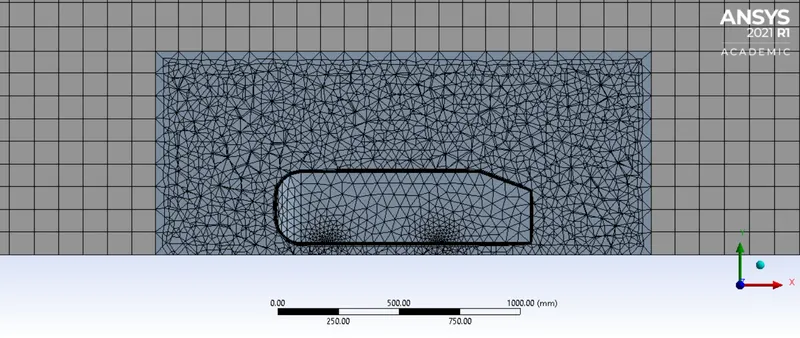
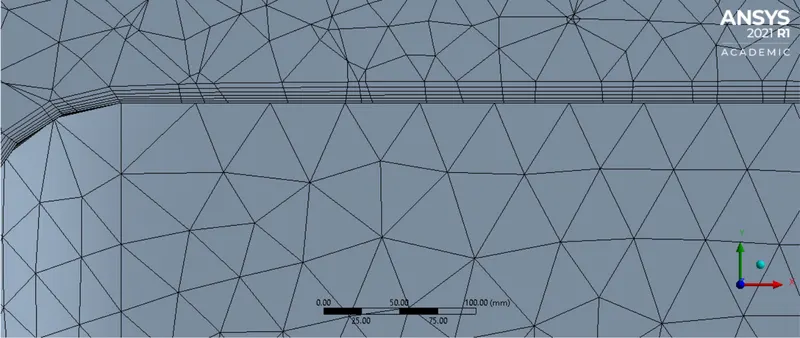
- Calculating the first layer thickness
- Characteristic length =1044mm (length of the ahmed body)
- Velocity=25 m/s
- Density ρ =1.205 Kg/m3
- Dynamic viscosity µ=1.82 5-5 Kg/m-s
- Estimated y+ value =100 (for K-epsilon model, y+ ranges from 30-300)
- Using google calculator, wall distance =1.5 mm
- Since we have 6 layers of inflation with 1.2 growth rate, the respective size of each layer is as follows
|
Layer |
Size (mm) |
|
1 |
1.5 |
|
2 |
1.8 |
|
3 |
2.16 |
|
4 |
2.592 |
|
5 |
3.1104 |
|
6 |
3.73248 |
|
Total thickness=14.894 |
- SETUP
- Double precision, parallel processors-checked
- Solver
- Density based
- Velocity foundation-absolute
- Steady flow
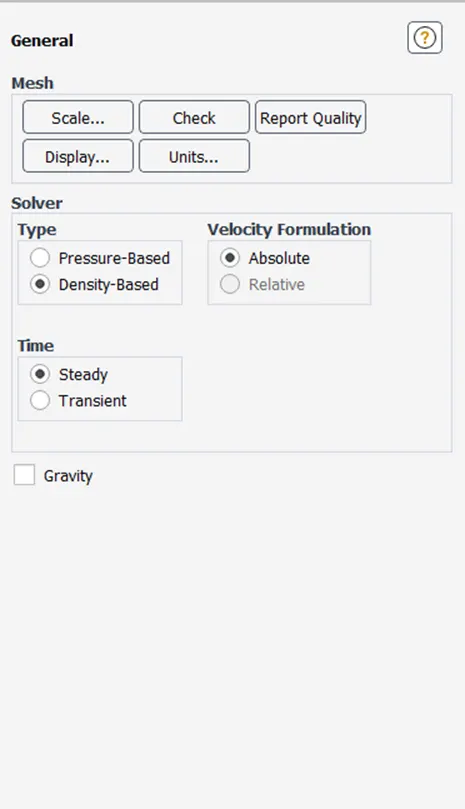
- Setting up Physics
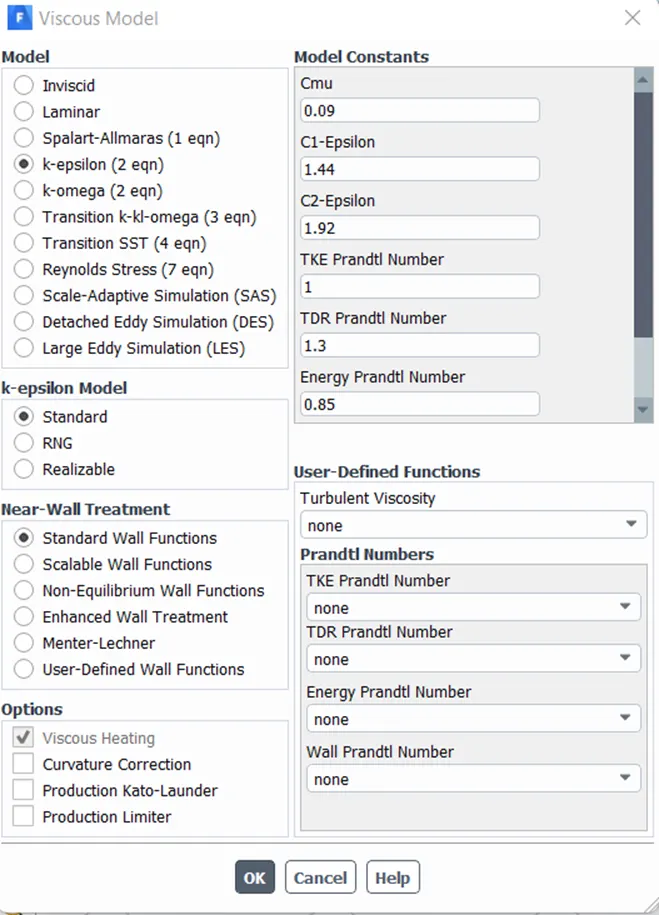
- Viscosity-K-epsilon Turbulence model with standard wall conditions
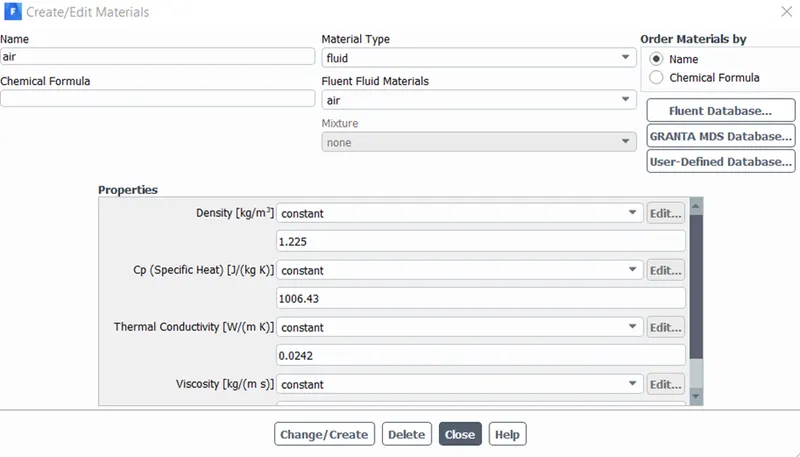
- Materials
- Default
- Boundary
- Inlet-25m/s
- Outlet- 0 Gauge pressure
- Symmetry wall- symmetry
- SOLUTION
- Initialization->Hybrid
- Generate Cd and Cl graphs
- Solving->definitions->force reports->Cd and Cl->write to console-create
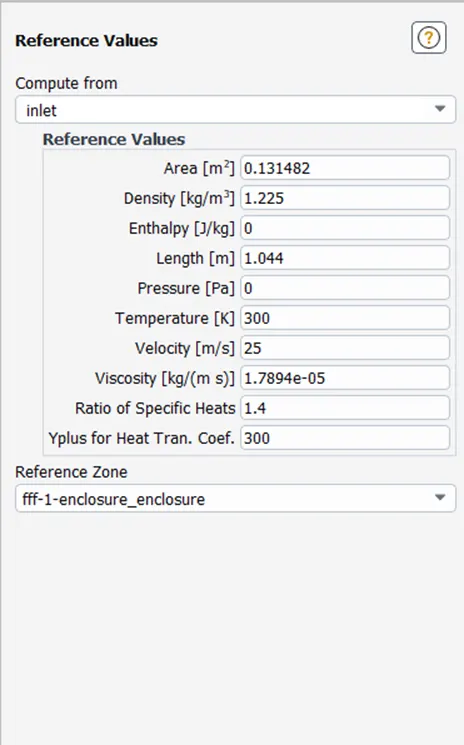
- Make sure to provide the reference values correctly in-order to obtain correct results for Cd and Cl
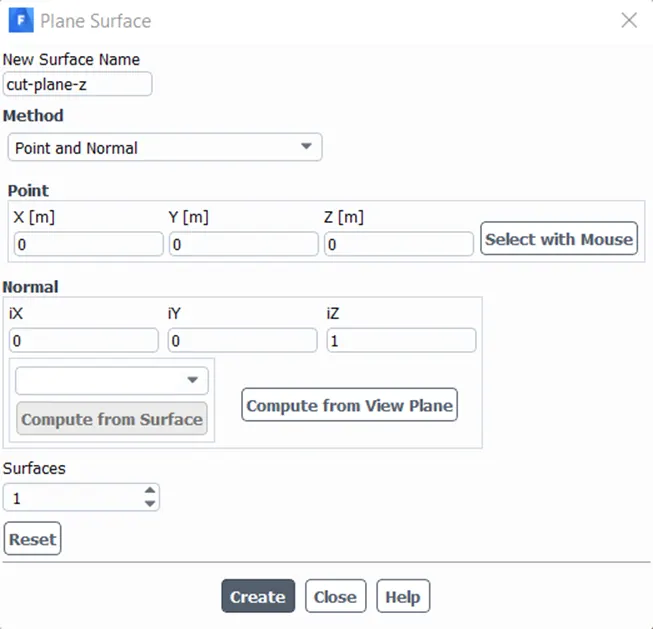
- Generate a cut-plane
- Post-Processing->create->plane->point and normal->(0 0 0) for point and (0 0 1) for normal->rename (cut-plane-z)
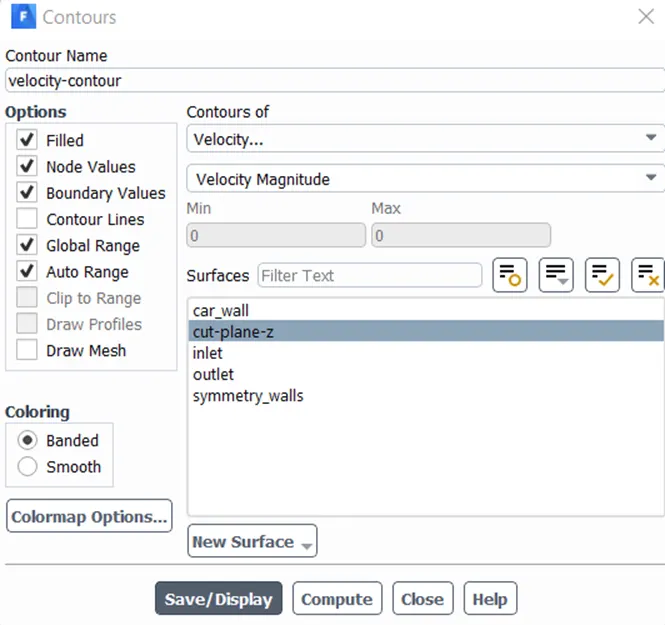
- Create a contour plot
- Post-Processing->contours->new->velocity->cut-plane-z
- Create animation
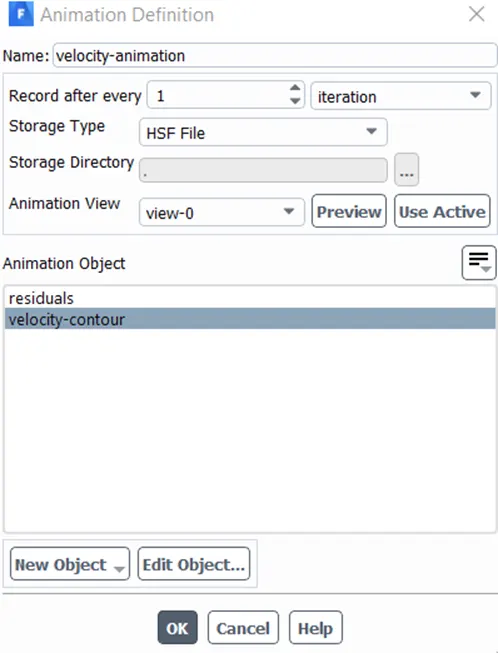
- Solving->activities->solution animation->velocity contour->select the view->use active->rename
- RUN
- Run the calculation for 500 or more iterations until it converges
- RESULTS
- Check the car walls on
- Insert->plane->rename (cut-plane-z)->XY plane->variable->velocity
- Create multiple reference lines
- Insert-location-line->provide the location
- Insert->chart-XY->data series->location-line 1->x-axis-y coordinate->y-axis-velocity u
- Duplicate the line and give new location (coordinates) and repeat the process of getting new XY chart
- Go to the previously created chart data series->new data series->change location as line 2
PLOTS AND RESULTS
Case 1:
| Outer enclosure size (mm) | 100 |
| Inner enclosure size (mm) | 50 |
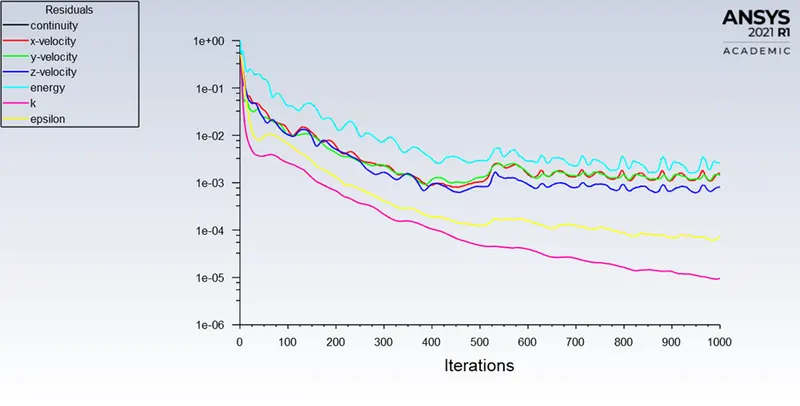
Figure 1: Residual plot
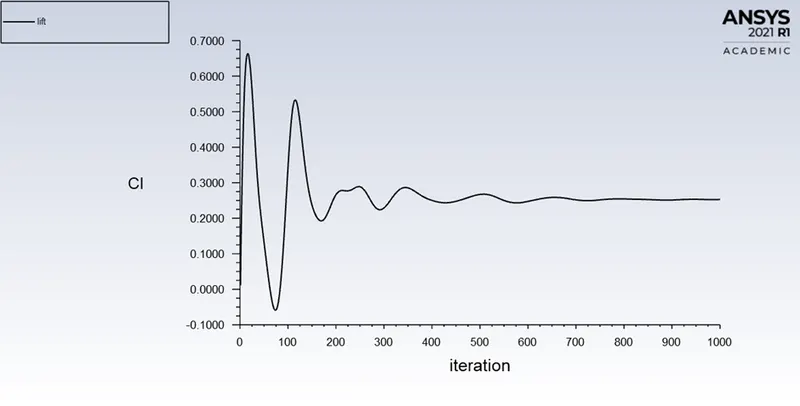
Figure 2: Coefficient of lift
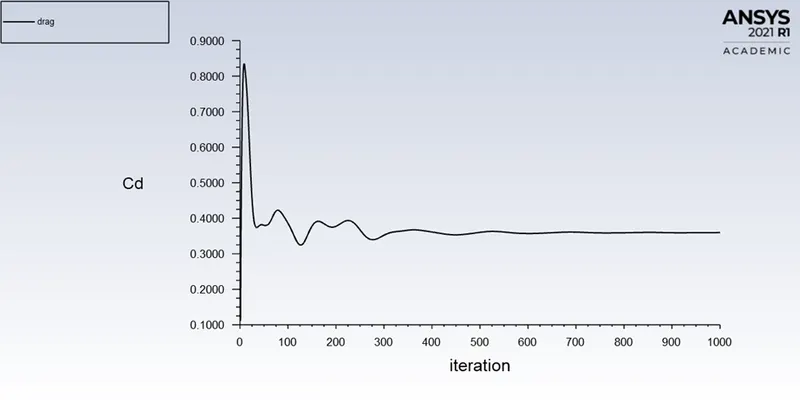
Figure 3: Coefficient of drag
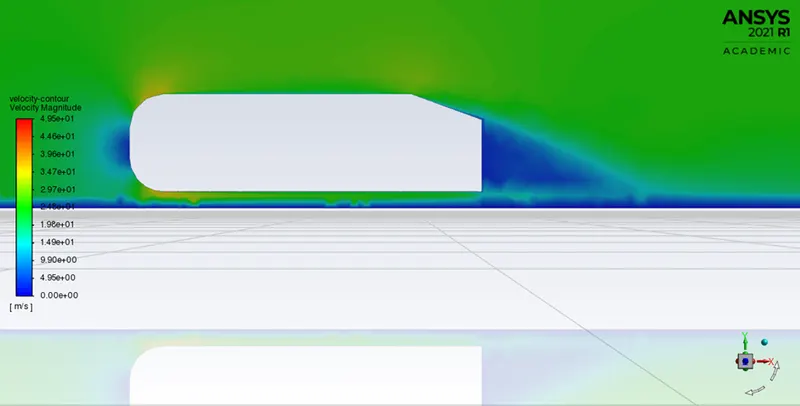
Figure 4: Velocity Contour
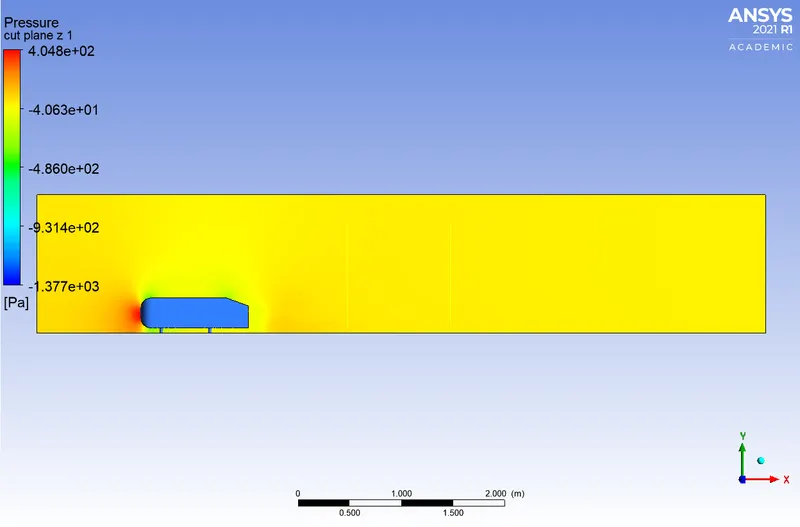
Figure 5: Pressure Contour
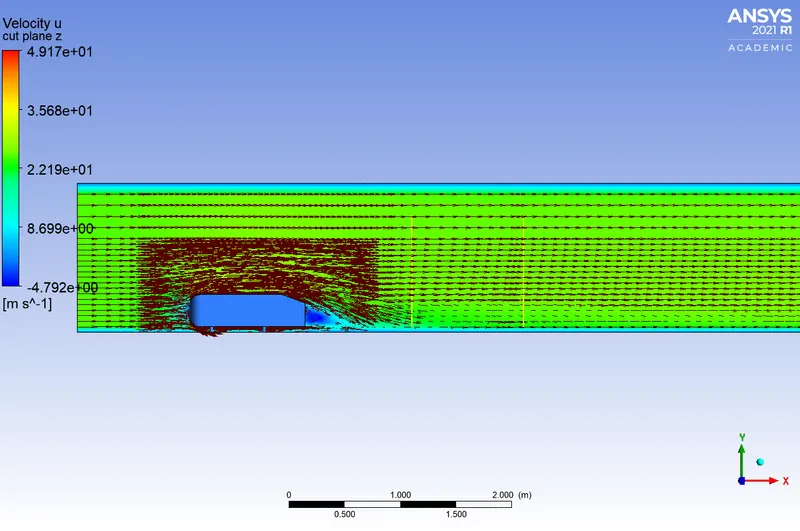
Figure 6: Vector plot showing wake region
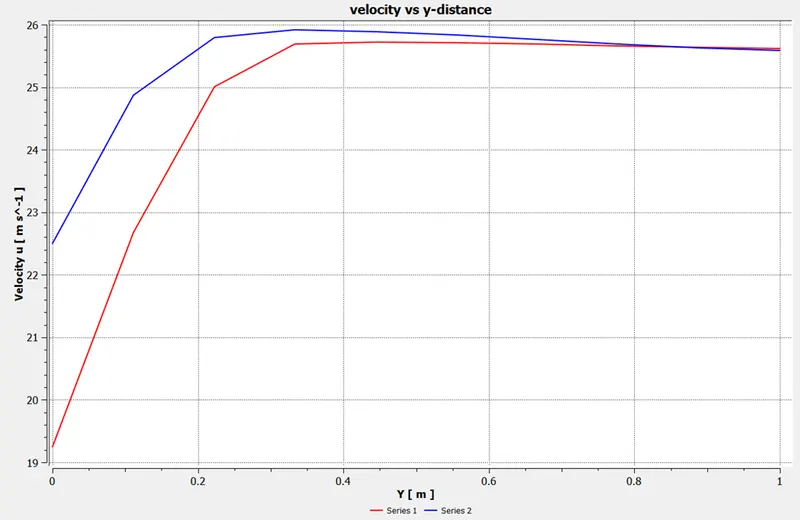
Figure 7: Vector vs y distance at 2 different lines at back of the ahmed body
Case 2:
| Outer enclosure size (mm) | 100 |
| Inner enclosure size (mm) | 40 |
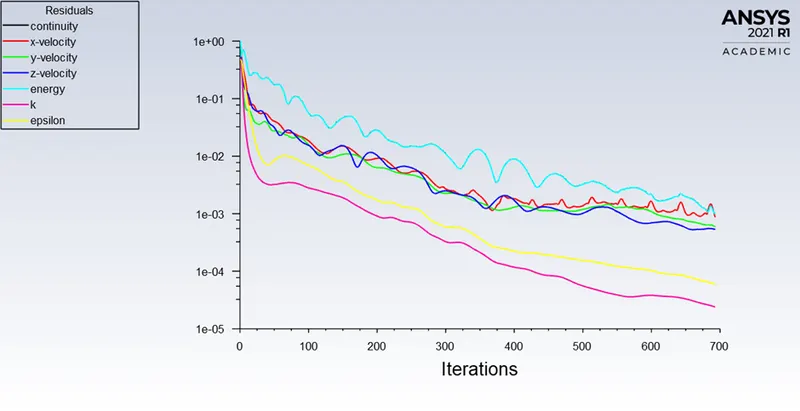
Figure 8: Residual plot
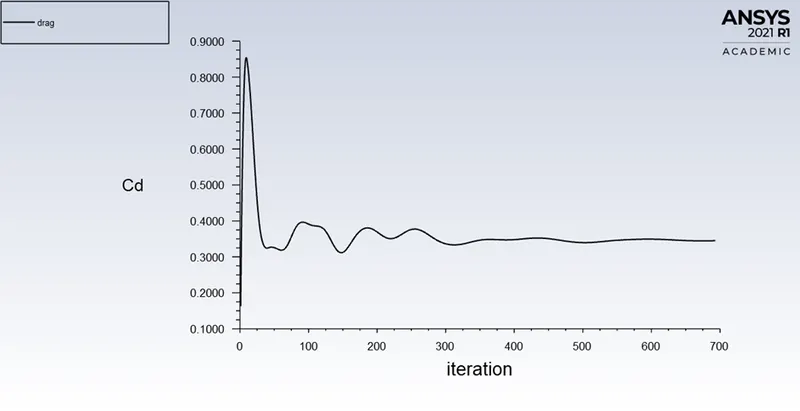
Figure 9: Coefficient of drag
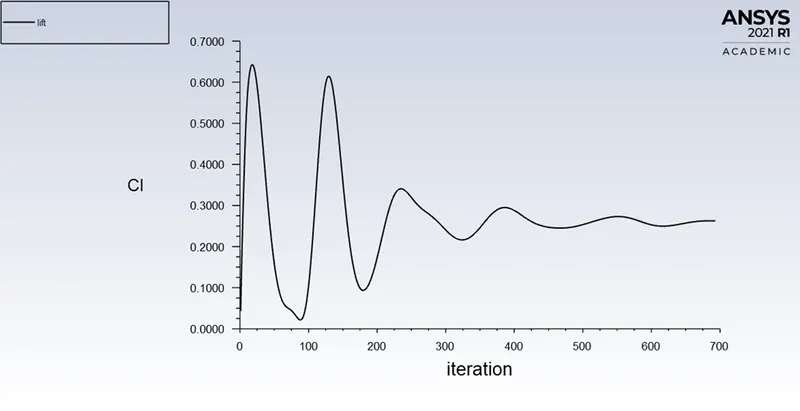
Figure 10: Coefficient of lift
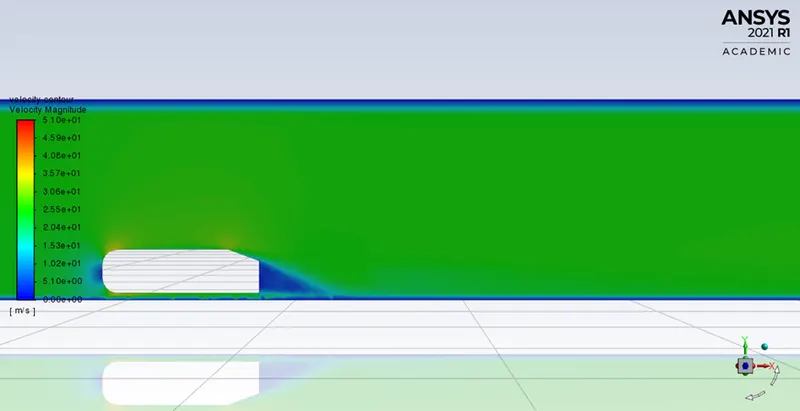
Figure 11: Velocity Contour
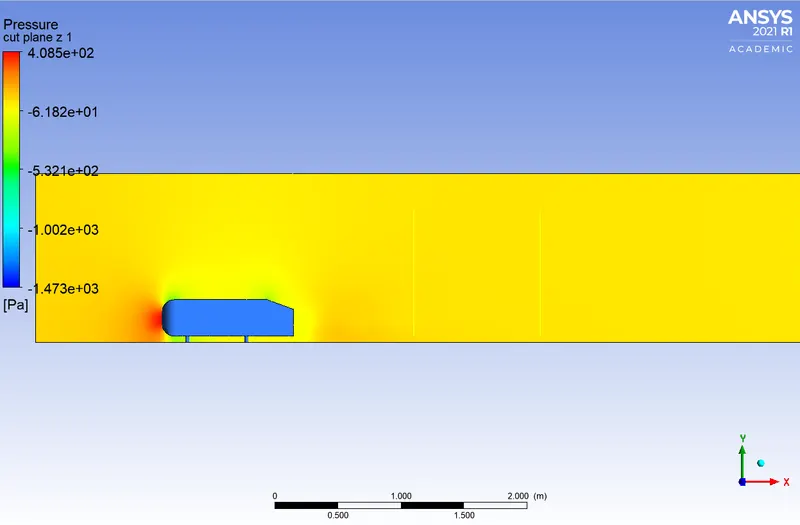
Figure 12: Pressure Contour
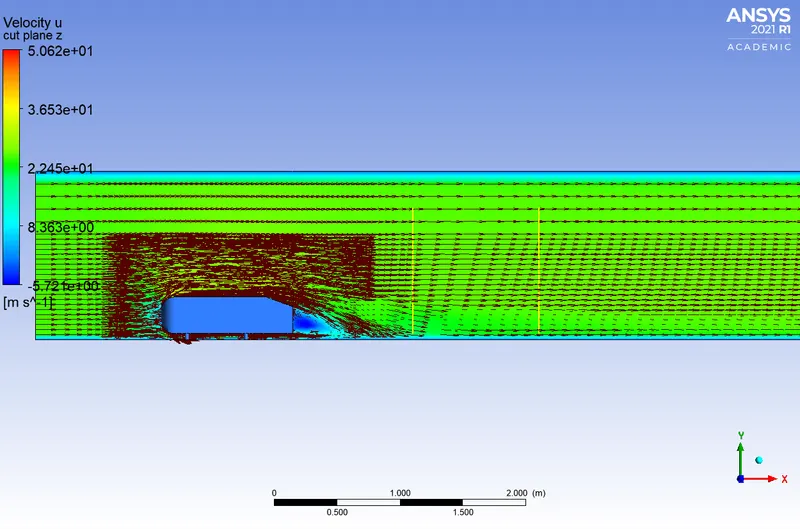
Figure 13: Vector plot showing wake region
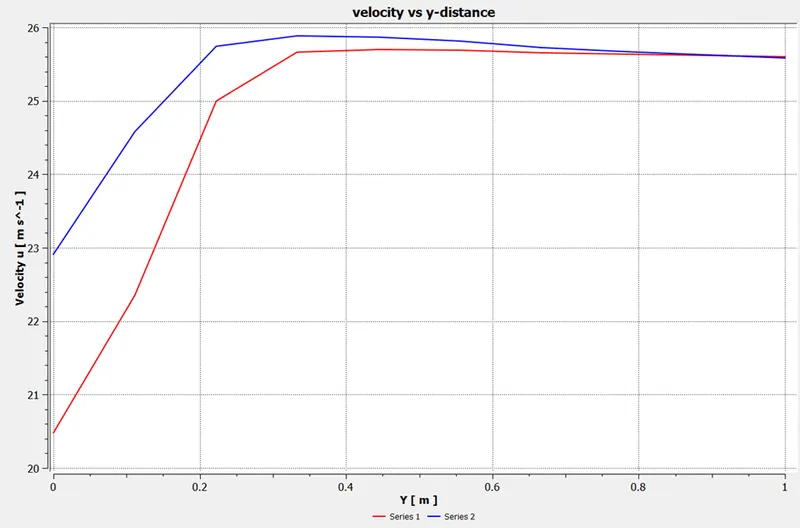
Figure 14: Vector vs y distance at 2 different lines at back of the ahmed body
Case 3:
| Outer enclosure size (mm) | 100 |
| Inner enclosure size (mm) | 30 |
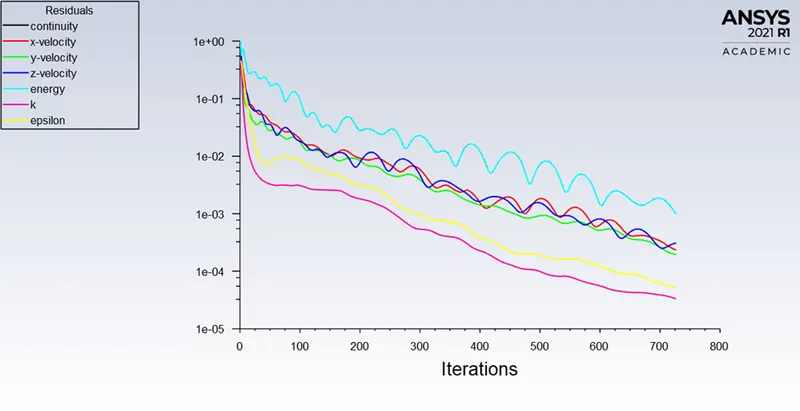
Figure 15: Residual plot
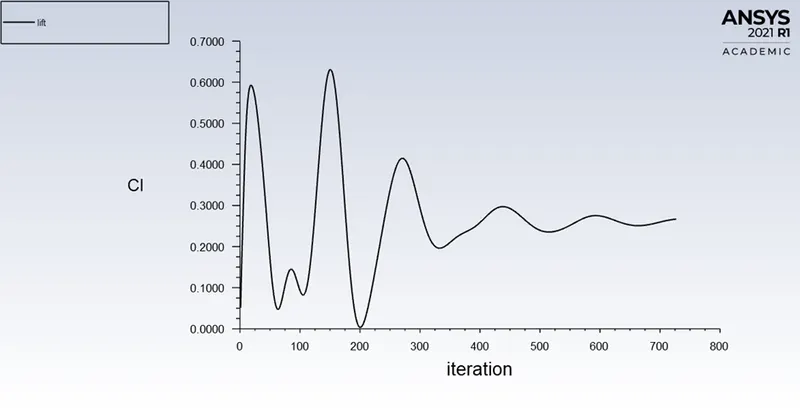
Figure 16: Coefficient of lift
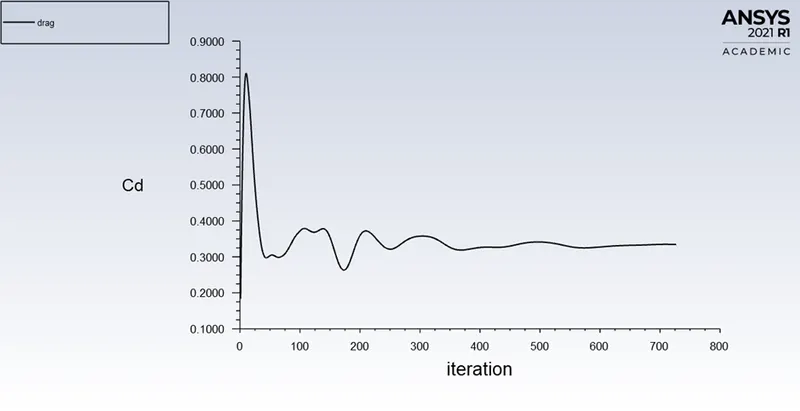
Figure 17: Coefficient of drag
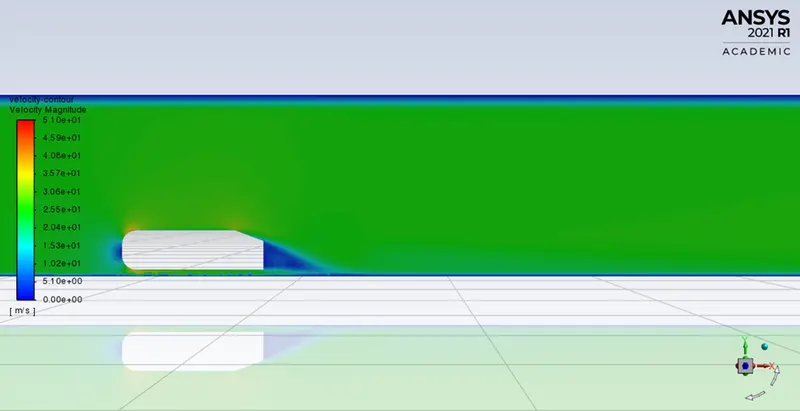
Figure 18: Velocity Contour
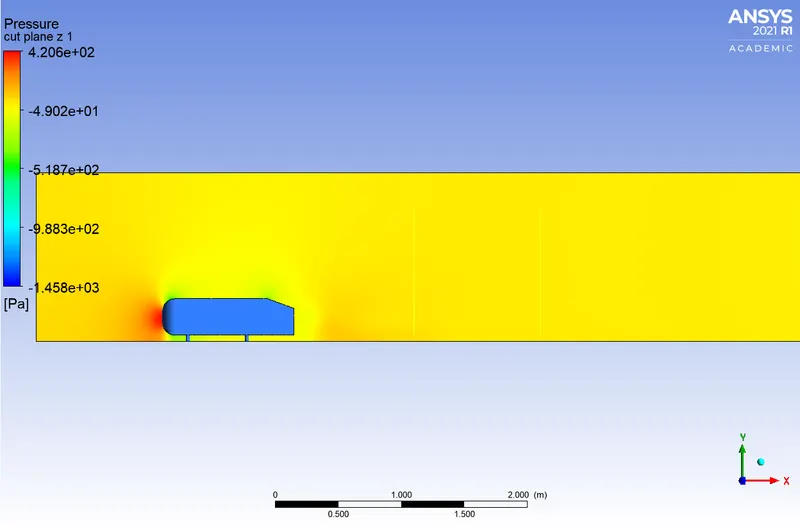
Figure 19: Pressure Contour
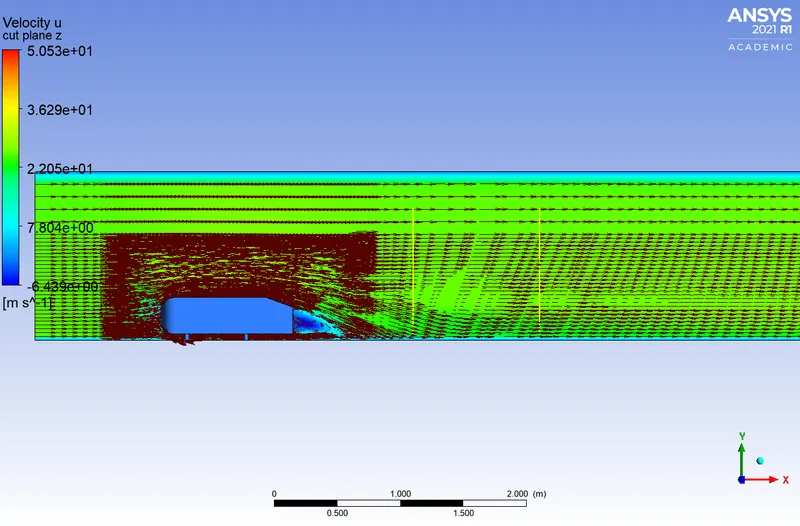
Figure 20: Vector plot showing wake region
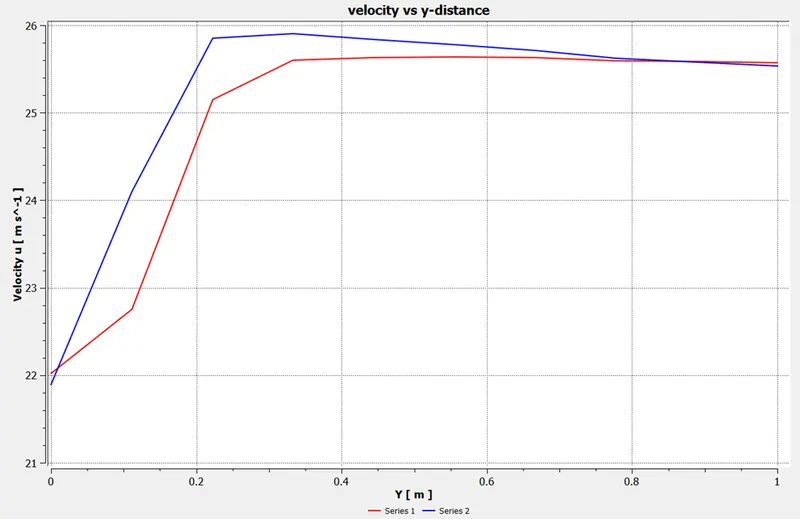
Figure 21: Vector vs y distance at 2 different lines at back of the ahmed body
GRID INDEPENDENCE TEST
| Case | Outer enclosure size (mm) | Inner enclosure size (mm) | Number of cells | Cd | Cl |
|
1 |
100 | 50 | 160545 | 0.3596 | 0.2527 |
|
2 |
100 | 40 | 218789 | 0.3449 | 0.2625 |
|
3 |
100 | 30 | 343927 | 0.3343 | 0.2669 |
As a result of the grid independemce test, we can conclude that as the mesh is getting finer, the coefficient of drag value approaches the analytical value of 0.33
CONCLUSION
- High presure region is created in front of the Ahmed body because of loss of kinetic energy of air.
- The geometry of the model results in creation of a wake region behind the body where adverse pressure generation occurs due to flow separation, thus having a significant impact on Cd and Cl.
REFERENCE
[1] Meile, Walter & Brenn, Günter & Reppenhagen, Aaron & Lechner, Bernhard & Fuchs, Anton. (2011). 'Experiments and numerical simulations on the aerodynamics of the Ahmed body'. CFD Letters, Volume 3.