Week 3 - External flow simulation over an Ahmed body.
1.Describe Ahmed's body and its importance.
Ahmed body represents a vehicle model. External aerodynamic simulation is done around this model to capture the flow characteristics like drag coefficient, lift, wake region around an automobile. Despite the considerable deviation of its geometry from usual vehicles, the body represents the basic aerodynamic properties of a vehicle, especially in the rear part. The slant angle ϕ has a strong influence on the aerodynamic drag and lift at the back. Both the drag and lift coefficients change abruptly at the angle ϕ=30°. Therefore, this angle is called the critical slant angle.
2.Explain the reason for the negative pressure in the wake region.
As the flow happens downstream, there will be momentum loss due to increasing pressure, i.e., , which is called adverse pressure gradient.
Up to , the flow area is like a constricted passage and the flow behaviour is like that of a nozzle.
Pressure reduces and we call it a favouable pressure gradient.
The viscous force opposes the combined pressure force and the force due to acceleration. Fluid particles overcome this viscous resistance due to favourable pressure gradient.
After the flow area is like a diverged passage and the flow behaviour is much similar to a diffuser
Pressure increases and we call it a negative pressure gradient.
Here the force due to acceleration is opposed by both the viscous force and pressure force.
3.Explain the significance of the point of separation.
As the air flows around the object, it remains attached to the wall of the object which is known as the boundary layer. The point on the body where the boundary layer gets ditached from the surface is called the separation point. When the air flow separates from the surface, the pressure drag usually increases.
The flow region which presents the major contribution to a car’s drag, and which poses severe problems to numerical predictions and experimental studies as well, is the wake flow behind the car. The location at which the flow separates determines the size of the separation zone, and consequently the drag force. Clearly, a more exact simulation of the wake flow and of the separation process are essential for the correctness of drag predictions.
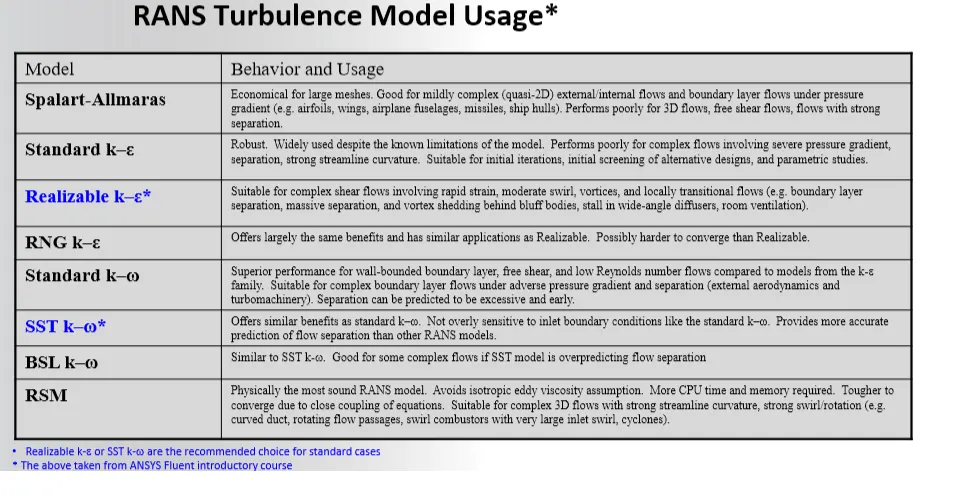
Results:
1. Velocity and pressure contours.
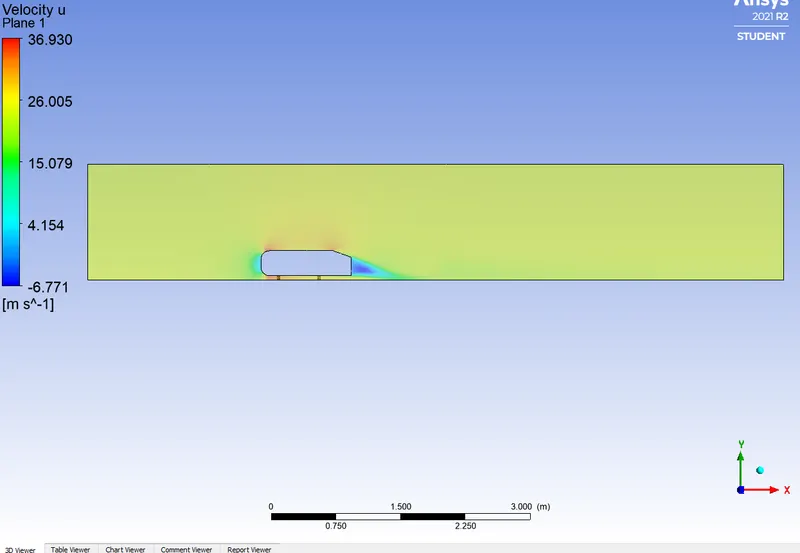
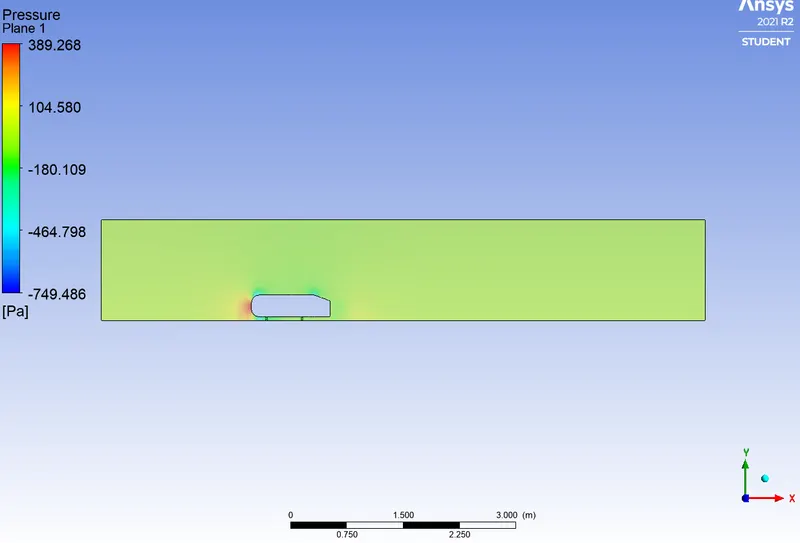
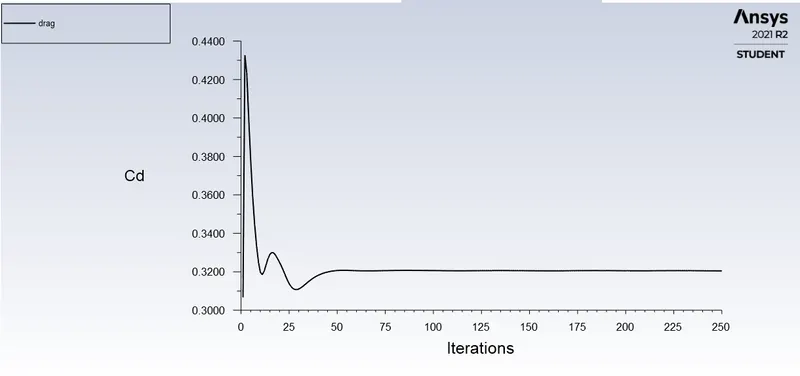
2. The drag coefficient plot for a refined case.
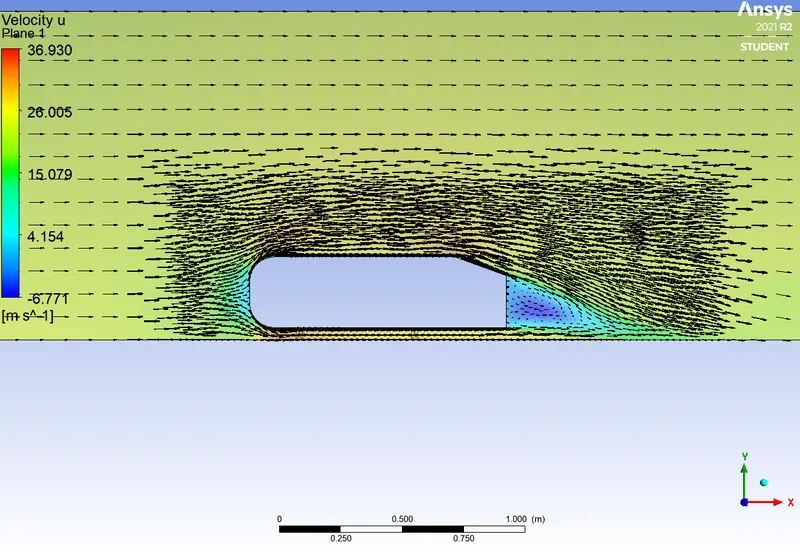
3. The vector plot clearly showing the wake region.
4. Perform the grid independency test and provide the values of drag and lift with each case.
| Enclosure Body sizing | Element count | Drag | Lift |
| 0.05 | 62728 | 0.389 | 0.210 |
| 0.04 | 110157 | 0.375 | 0.275 |
| 0.03 | 240164 | 0.359 | 0.33 |
| 0.025 | 398497 | 0.319 | 0.267 |