Week-3 Challenge: ADVISOR Tool
THEORY:-
ADVISOR TOOL:-
ADVISOR, NREL’s ADvanced VehIcle SimulatOR, is a set of model, data, and script text files for use with Matlab and Simulink. It is designed for rapid analysis of the performance and fuel economy of conventional, electric, and hybrid vehicles. ADVISOR also provides a backbone for the detailed simulation and analysis of user defined drivetrain components, a starting point of verified vehicle data and algorithms from which to take full advantage of the modeling flexibility of Simulink and analytic power of MATLAB.It is a set of models, data, and script text files for use with Matlab and Simulink.
The benefits of using ADVISOR Tool:-
- Estimate the fuel economy of vehicles that have not yet been built
- Learn about how conventional, hybrid or electric vehicles use (and lose) energy throughout their drivetrains.
- 1s simulation technique,fast and easy to use.
- Compare relative tailpipe emissions produced on a number of cycles
- Evaluate an energy management strategy for your hybrid vehicle’s fuel converter
- Optimize the gear ratios in your transmission to minimize fuel use or maximize performance, etc.
How To start ADVISOR Tool:-
- Download advisor tool and get extract to a file.
- Go to matlab and open the extracted folder and search for advisor.m file
- Write advisor in the command window and enter
- advisor tool will open, select the appropriate option and start the work.
Advisor tools have 3 windows:
1. Vehicle Input window
2. Simulation Parameter window
3. Results window
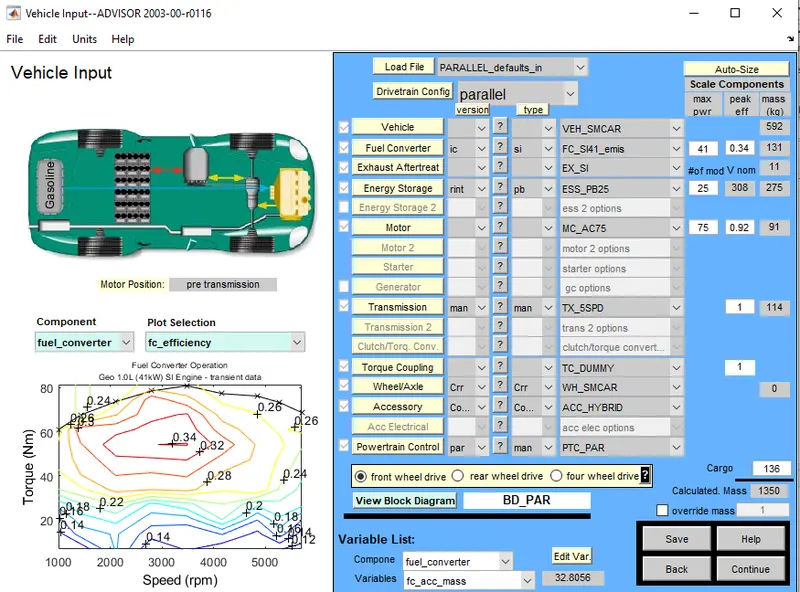
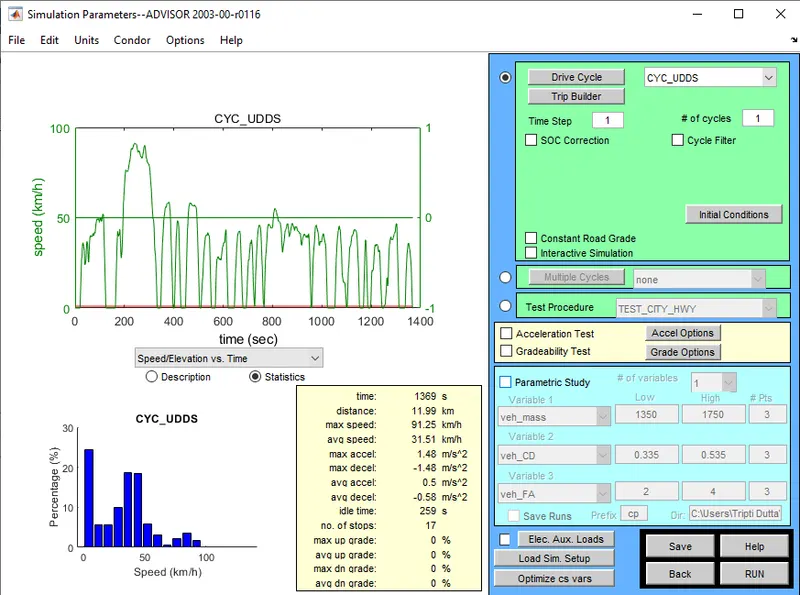
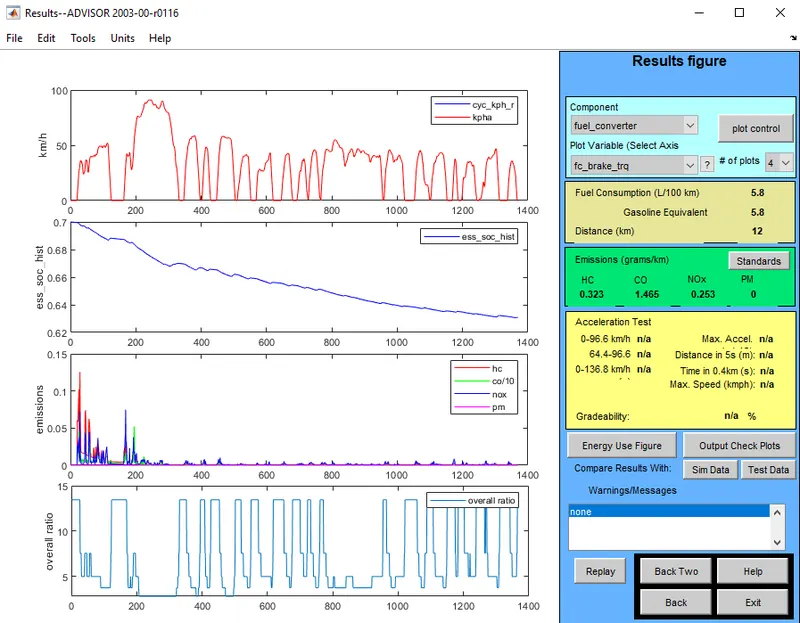
Q1. USE ADVISOR TOOL AND SIMULATE TO CONCLUDE THE OBSERVATION ON EV_DEFAULT_IN FILE, OF CARGO MASS IS 500KG WITH ALL OTHER DEFAULT CONDITIONS, TO OBSERVE WHEATHER THE VEHICLE CAN TRAVEL FOR 45KM WITH FTP DRIVE CYCLE?
SOLUTION:-
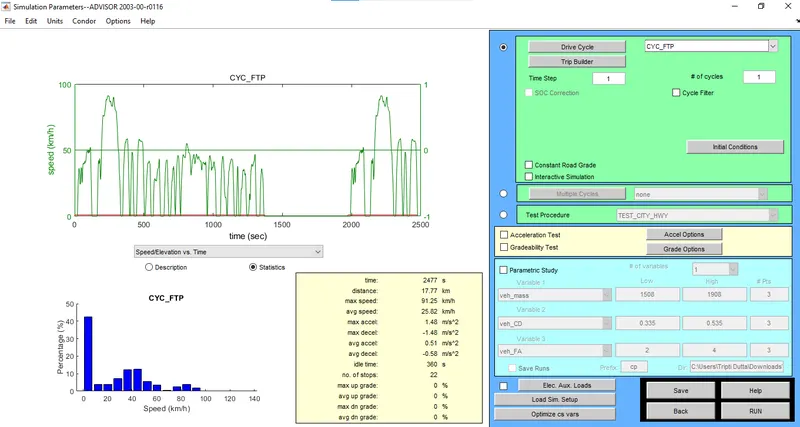
First selection of load file is changed to EV_default_in and cargo mass is changed to 500 as per given question.
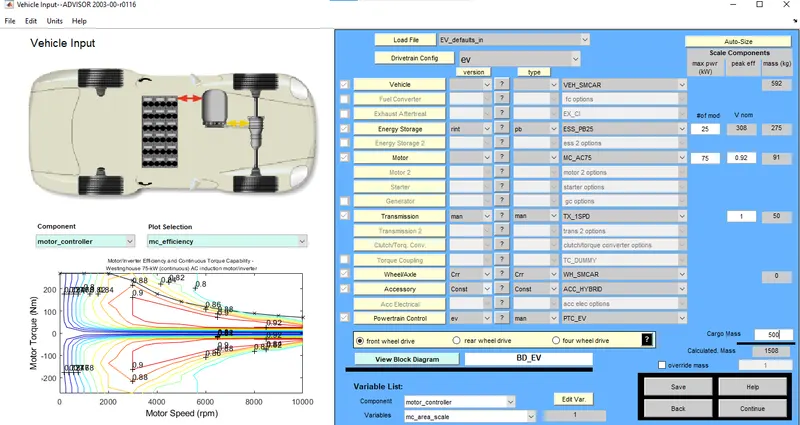
Then drive cycle is changed to CYC_FTP for 1 cycle.
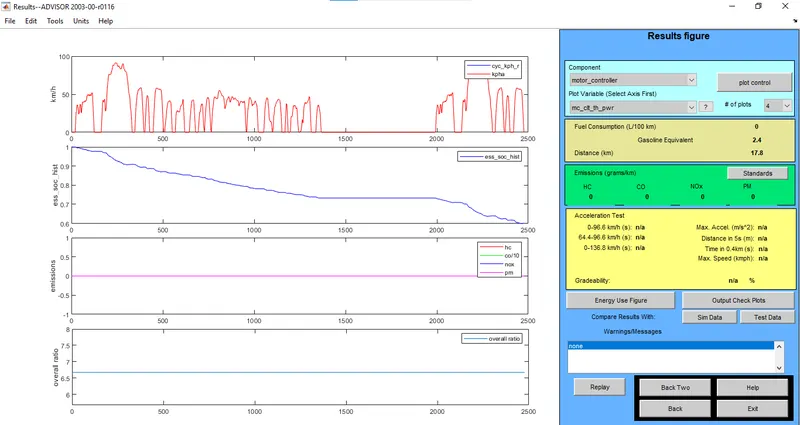
RESULTS:- In cycle 1 car travels for 17.8km with almost 40% SOC.
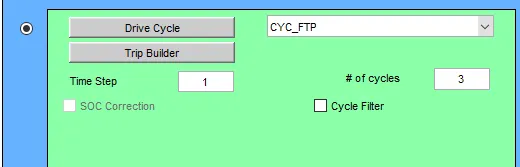
In the same way changing of drive cycle from 1 to 2 and then 2 to 3.
Found the following results:-
| Sno. | no. of drive cycles | km travelled | battery used(in%) |
| 1 | 1 | 17.8km | 40% |
| 2 | 2 | 35.5km | 81% |
| 3 | 3 | 41.4km | 100% |
Thus, its been seen that an EV_default_in with FTP drive cycle cannot travel to 45km with 500kg of cargo load on it.
Q2. IN THE ABOVE CASE TRY CHANGING THE BATTERY CAPACITY AND CHECK THE CAPABILITY
SOLUTION:-
As we saw the above system cannot be taken upto 45km but our task is to make it possible, so lets try change in battery capacity.
For changing battery capacity we need to change battery module from energy storage. And their we can clearly see the change in battery weight and voltage. Thus it also increases the total mass of the vehicle.
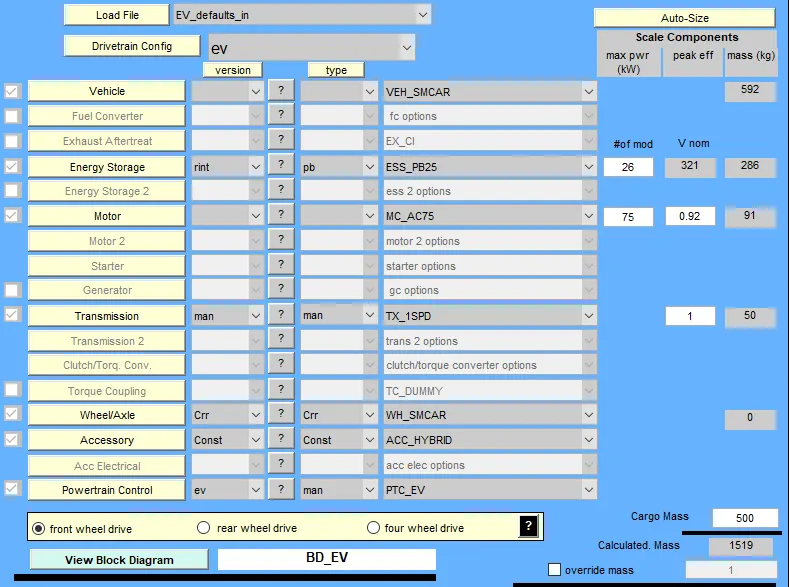
By increasing the module and with constant drive cycle of 2,
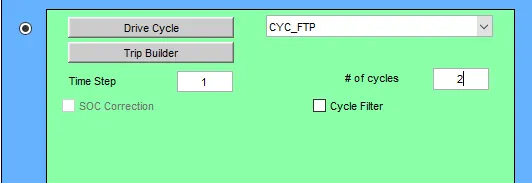
we found:-
| Sno. | module | v nom | b weight | km travelled |
| 1 | 26 | 321 | 286kg | 35.5km |
| 2 | 27 | 333 | 297kg | 35.5km |
| 3 | 28 | 345 | 308kg | 35.5km |
After the above experiments it was clear that drive cycle 2 cannot make the vehicle to travel 45km or above.
So, why not check to drive cycle 3 ,
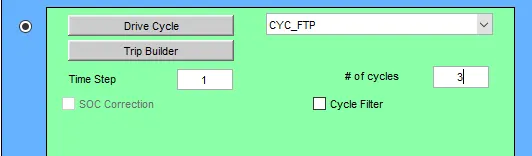
with all same reading:-
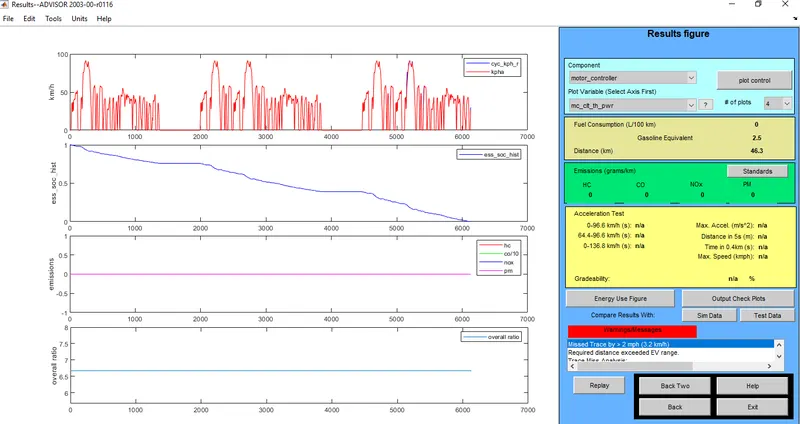
| Sno. | module | v nom | b weight | km travelled |
| 1 | 26 | 321 | 286kg | 42.7km |
| 2 | 27 | 333 | 297kg | 44.8km |
| 3 | 28 | 345 | 308kg | 46.3km |
CONCLUSION:-
Thus, it is been found that module 28 with drive cycle 3 could win the race and travel for 45km and above with 500kg of cargo load.
Q3. PERFORM GRADEABILITY TEST WITH PRIUS_Jpn_defaultsin file. COMPARE RESULTS IN TABLE AND CONCLUDE.
SOLUTION:-
THEORY:-
Gradeability is the steepest gradient a machine can climb, compared to the Operating Angle which is the steepest gradient a machine will operate on. In the world of access, gradeability specifically refers to the size of the incline that a machine has the capacity to climb up or down. This calculation is done with the machine in the stowed (lowered) position.
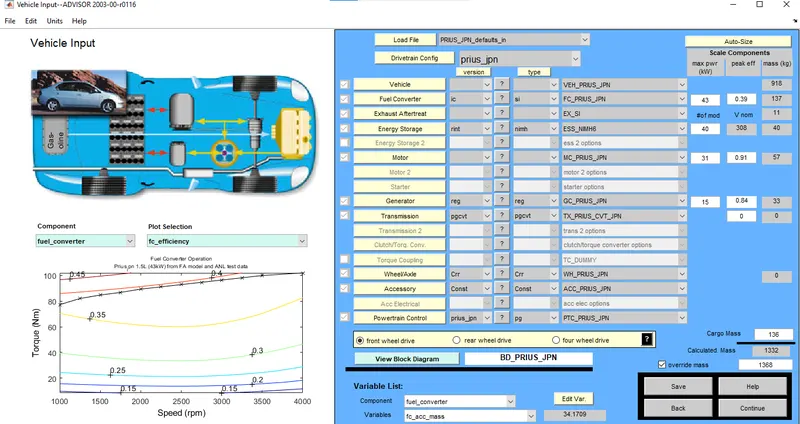
Here, we will be taking 5 different input of gredeability for 2 no. of time periods(i.e 10 and 20sec)
Taking speed=20mph or 32.2kmph for 10sec with all systems enabled:-
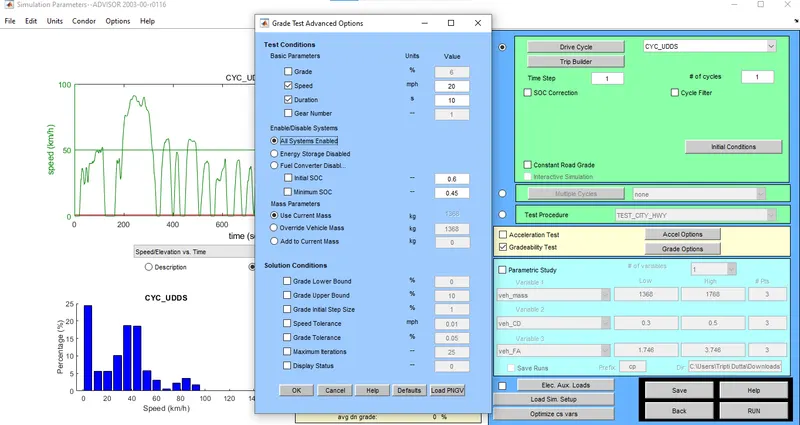
RESULT:-(Gredeability=19.8%)
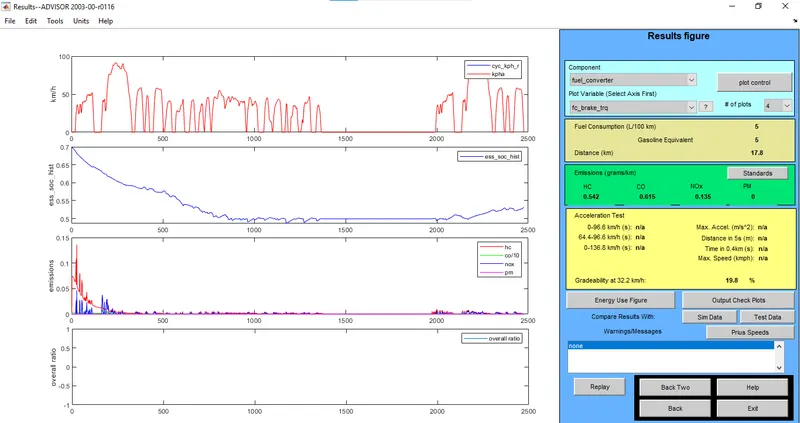
Similarly, we will increase the speed and observe the gredeability difference:-(total of 5 speed values)
| Sno. | speed | time period | gredeablity |
| 1. | 32.2kmph | 10sec | 19.8% |
| 2. | 48.3kmph | 10sec | 14.7% |
| 3. | 64.34kmph | 10sec | 11.6% |
| 4. | 80.46kmph | 10sec | 9.7% |
| 5. | 96.56kmph | 10sec | 8.1% |
Now, we will try some different values of speed for 20sec, and note the observation.
Taking speed = 10mph or 16kmph for 20 sec:-
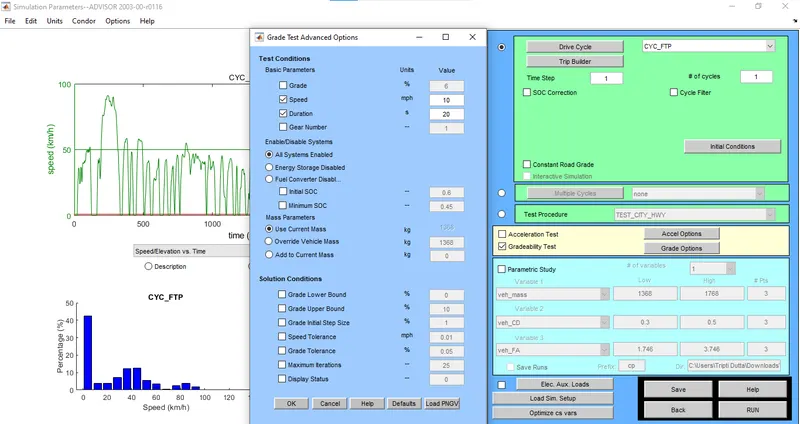
RESULT:-(Gredeability=33.7%)
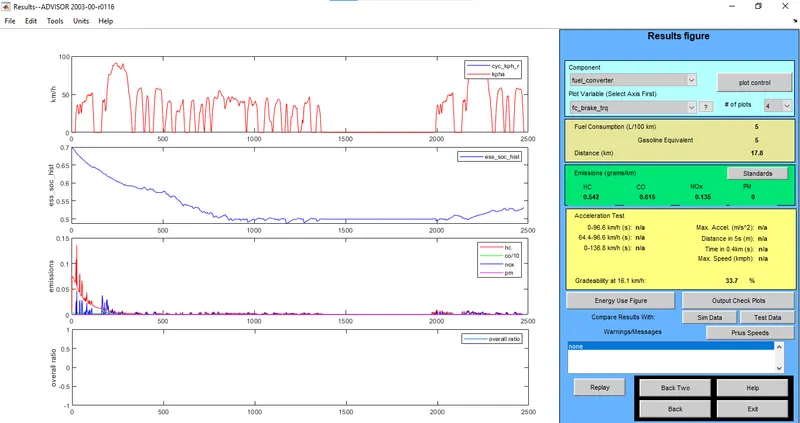
In the same way as above here too we will be taking total of 5 reading of different speed for 20sec of time period:-
| Sno. | speed | time period | gredeability |
| 1. | 16kmph | 20sec | 33.7% |
| 2. | 32.2kmph | 20sec | 22.9% |
| 3. | 48.3kmph | 20sec | 17.7% |
| 4. | 64.34kmph | 20sec | 14.6% |
| 5. | 80.46kmph | 20sec | 12.4% |
CONCLUSION:-
Thus, by the above observation it is clearly visible that speed and geadeability are inversely proportional.
This is the major reason for shifting of gear is done when speed gets low due to elevation occurance.