Week 7 State of charge estimation
Q1. SIMULATE THE 3 TEST CASES FROM HARNESS DASHBOARD AND WRITE A DETAILED REPORT ON THE RESULTS.
SOLUTION:-
THE MODEL:
can be used to mimic diverse usage cycles and environmental conditions to evaluate a systems response to a potentially unsafe condition. For instance, voltage, current, or temperature outside the recommended limits. Lets say this BMS is a part of an EV powertrain and the initial SOC is 75% with the ambient temperature being 15 degrees C. The vehicle is run for a while and then stops to charge. Once the vehicle and battery are at rest and charging, the cell balancing cycle kicks in. How do we know that during the charging stage the battery pack will remain within recommended electrical and thermal limits? What if the temperature of the pack is 40 degrees C instead of close to 15? Will an aggressive drive cycle cause an under-voltage situation when the SOC is running low? A model such as this one allows the vehicle designer to test these types of situations.
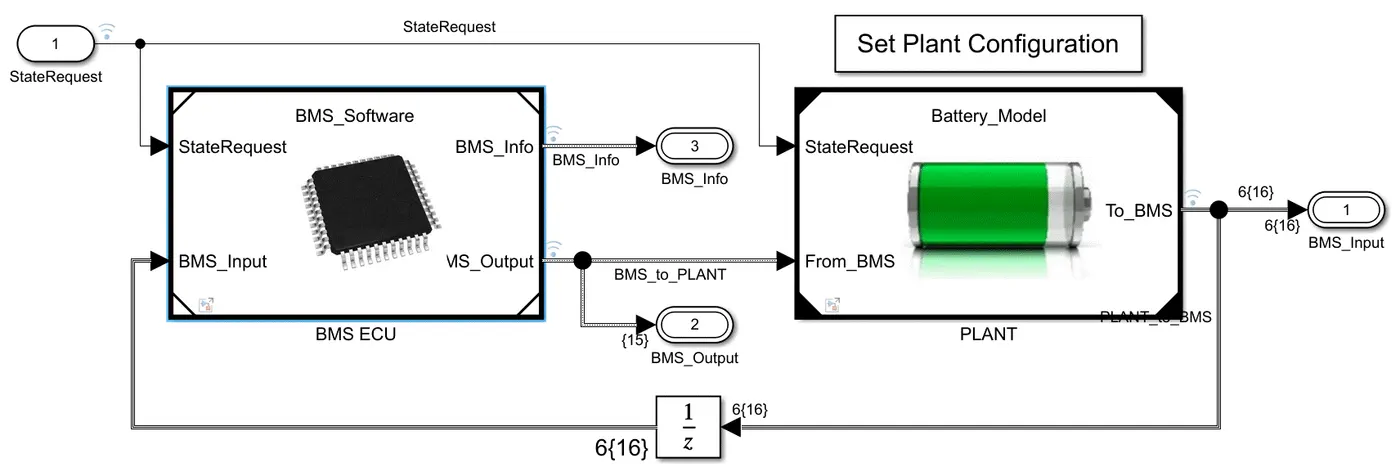
BMS ECU: represents the software and controls part of the model, showing how cell balancing is done, SOC is estimated, and response to different states (using stateflow)
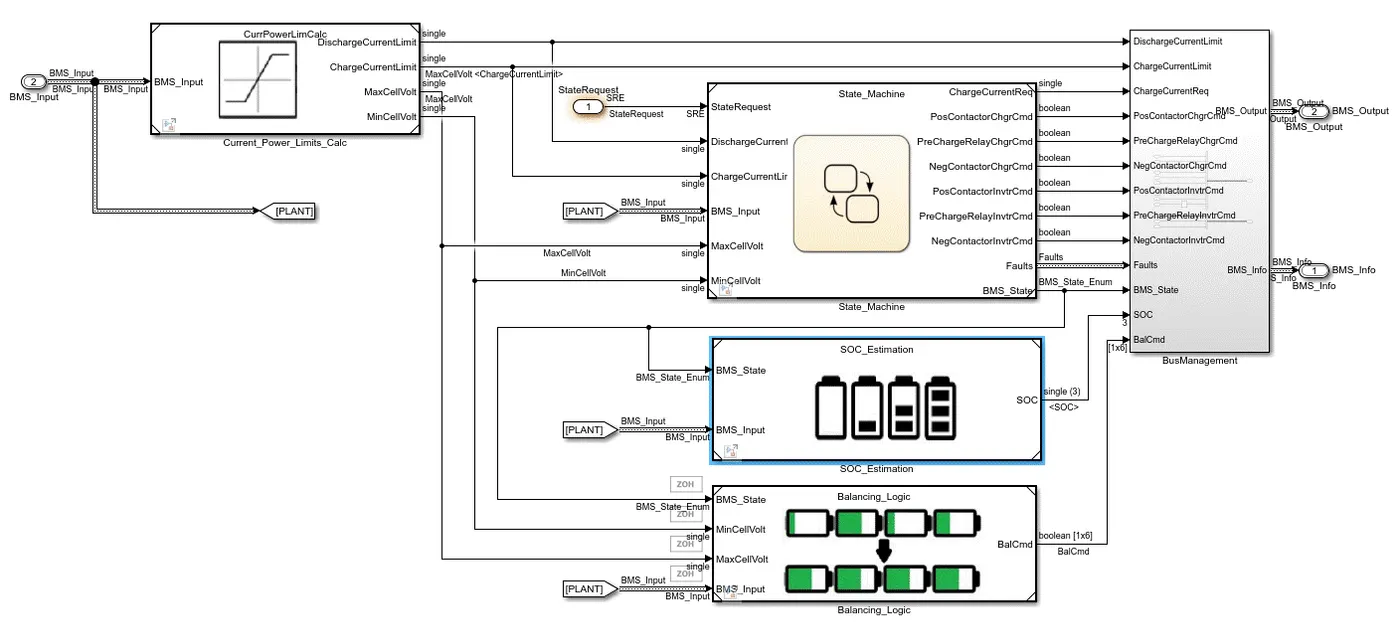
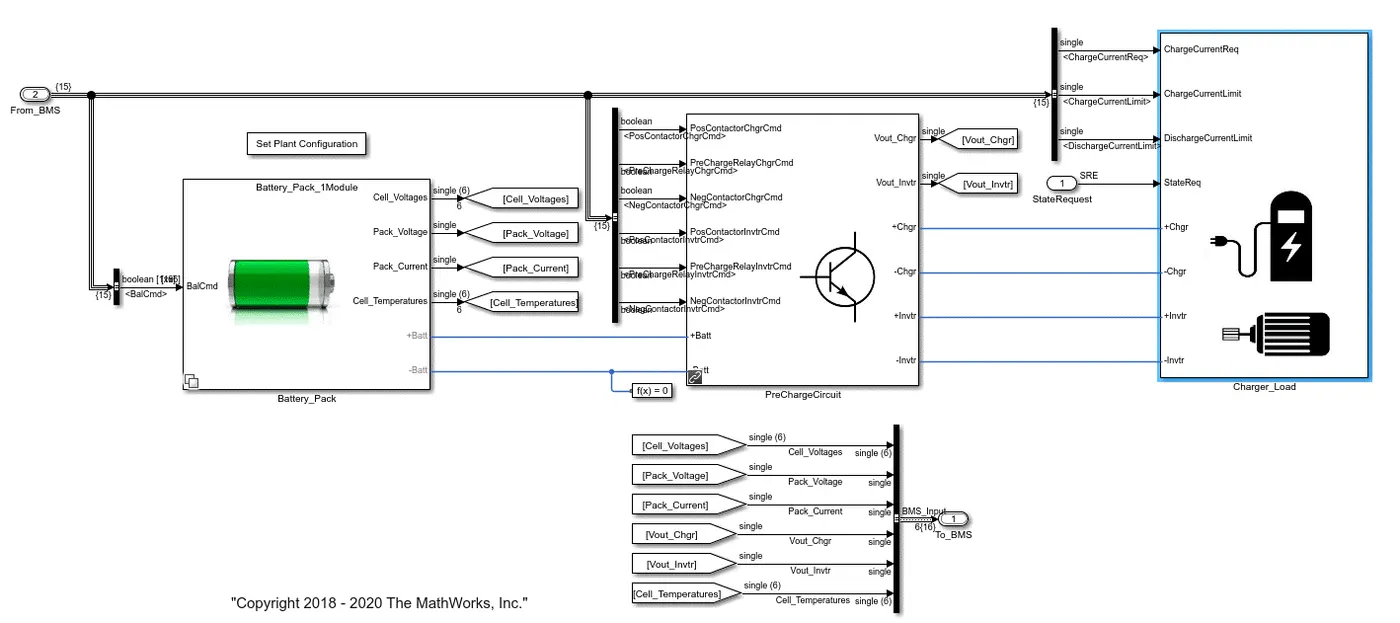
PLANT: represents the hardware part of the model, with the battery pack, precharge circuit, and charger.
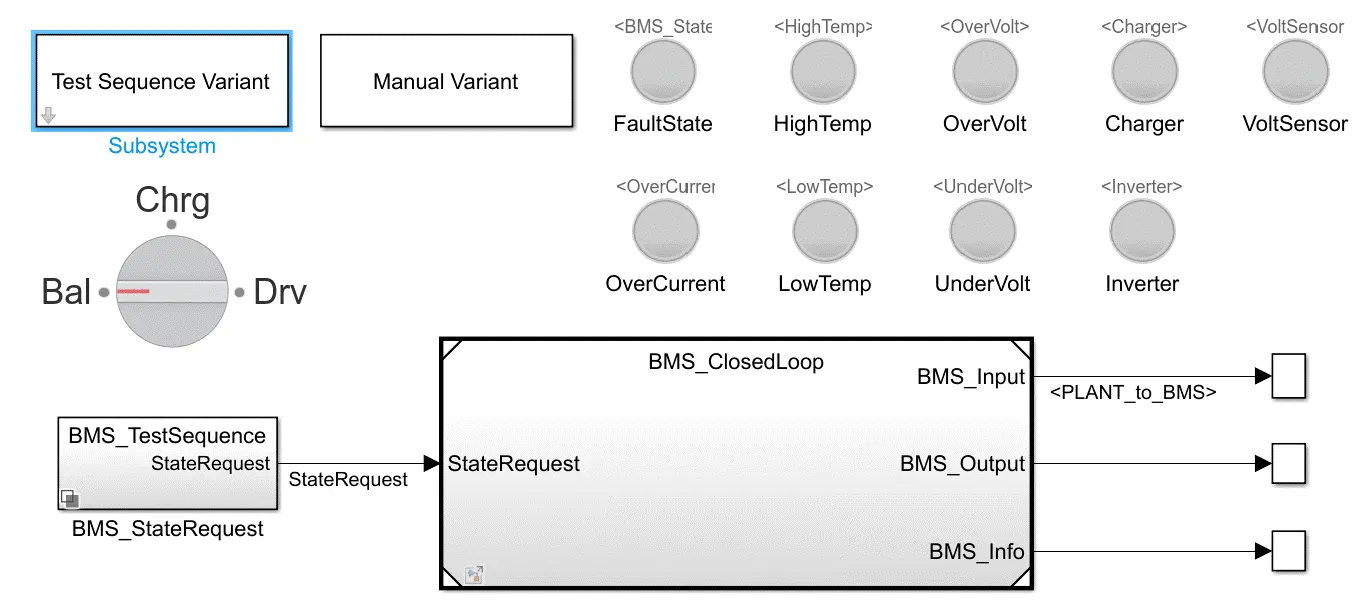
TEST HARNESS DASHBOARD: testing different scenarios and conditions
TEST CASE 1: NO FAULT CONDITION IN THE VEHICLE
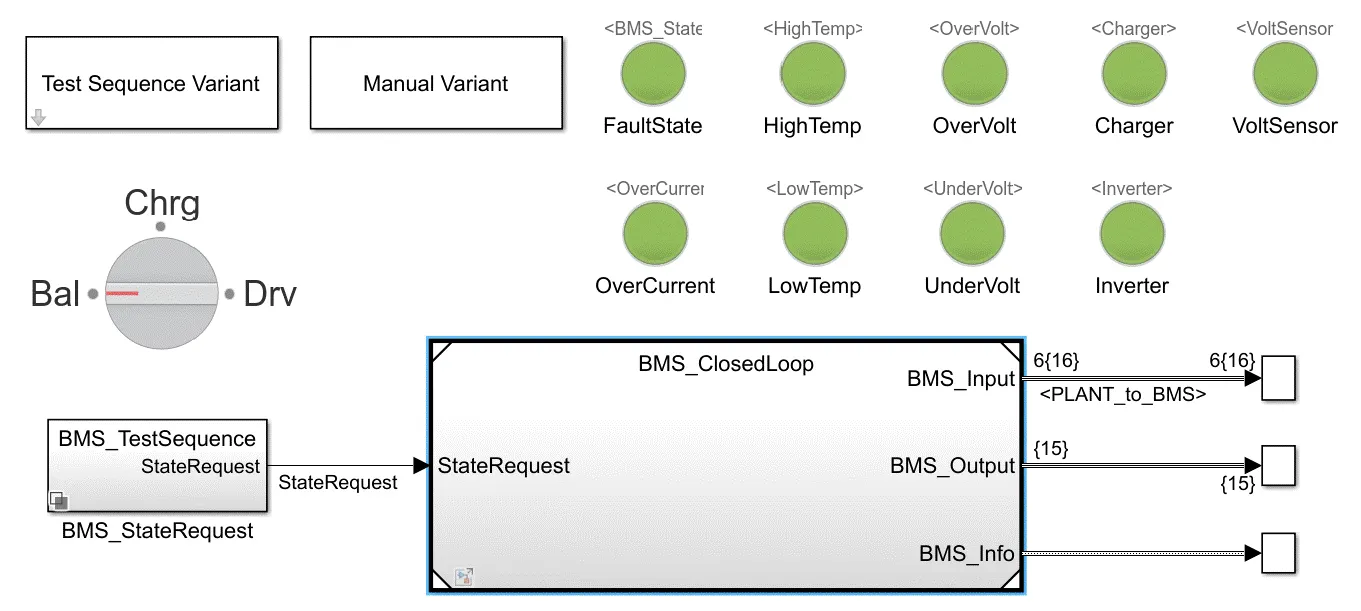

- Battery is in driving mode for first 3000 secs
- The next 1000 secs it is cell balancing as the BMS has come to a standby. This will generally only happen when the vehicle has come to a stop for a long time.
- The next 5000 seconds are for charging
- BMS continues to be in standby for the remaining 11,000 seconds
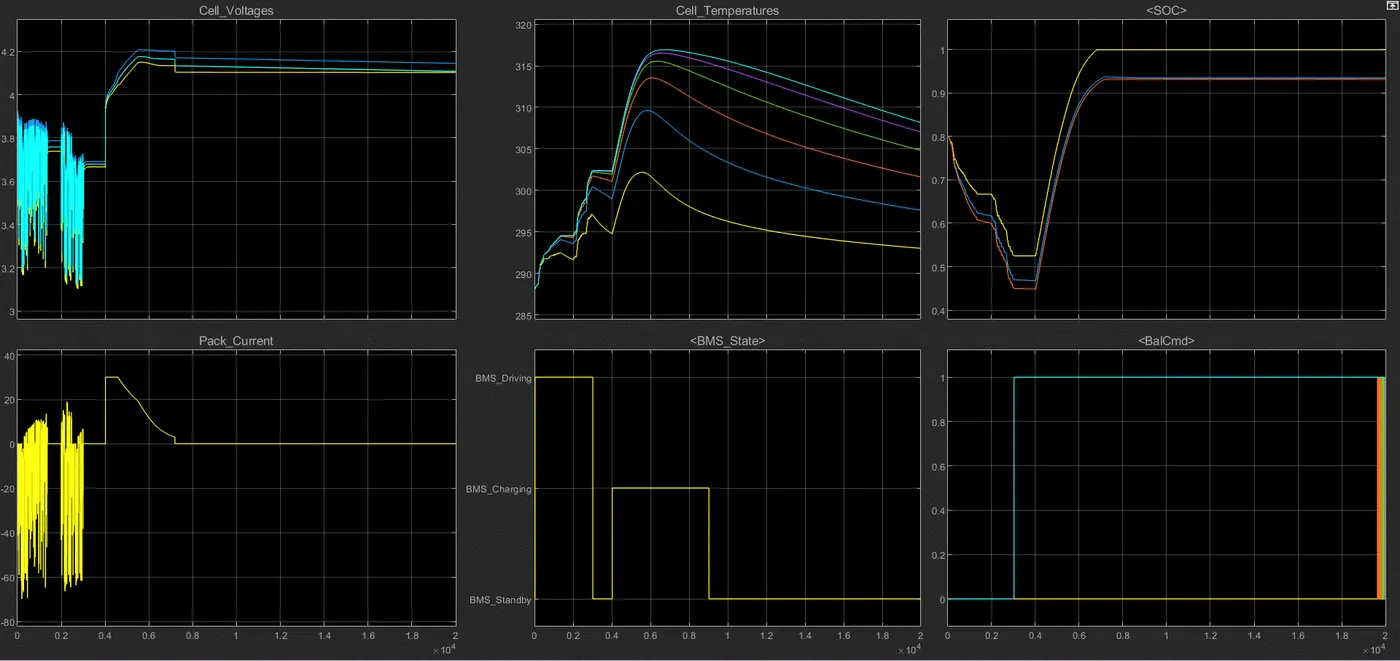
OBSERVATIONS:
- Fluctuations in cell voltages and pack current until 3000sec indicates that the vehicle was in driving mode
- Cell voltages start off differently which means there was SOC imbalancing from the beginning. However, they do start converging after 3000sec as cell balancing begins, and by the end of 20,000sec all cells stabilize around 4.1V
- Between 4000sec and 9000sec there is constant current (CC) and constant voltage (CV) charging happening: from 4000 - ≈">≈≈4600sec it is CC and then the remaining is CV. During CC the SOC increases much more quickly, and then slows down during CV as a precaution mechanism to avoid charging past the voltage limit
- There is a moderate difference in the temperatures of Cell 1 (297K) and Cell 6 (303K) when the vehicle comes to a stop at 3000sec. This is because of the way the battery pack is assembled. Cell 1 is open to the atmosphere while Cell 6 is thermally insulated on one side. The difference in their peak temperatures is 15 degrees C, and this happens during the initial charging stages. Even at the end of the simulation, when the BMS has been in standby mode for >10000sec the difference in temperature of cell 1 and cell 6 is still 15 degrees C. This really points to the importance of how vital it is to maintain a similar temperature throughout the whole pack, otherwise it will lead to difference between individual cells, such as their voltages, discharge capacities, cycle life or cell degradation, etc.
- The SOC graph shows the estimation of SOC through different methods, with yellow corresponding to coulomb counting, blue for Unscented Kalman Filter (UKF), and orange for Extended Kalman Filter (EKF). Both Kalman filter methods are evidently more accurate than coulomb counting due to their ability to account for voltage information (the difference between OCV and (sum of) voltage drops)
TEST CASE 2: CURRENTLY UNABLE TO RUN THIS TEST, POSSIBLY DUE TO A BUG
TEST CASE 3: NO FAULT CONDITION IN THE VEHICLE
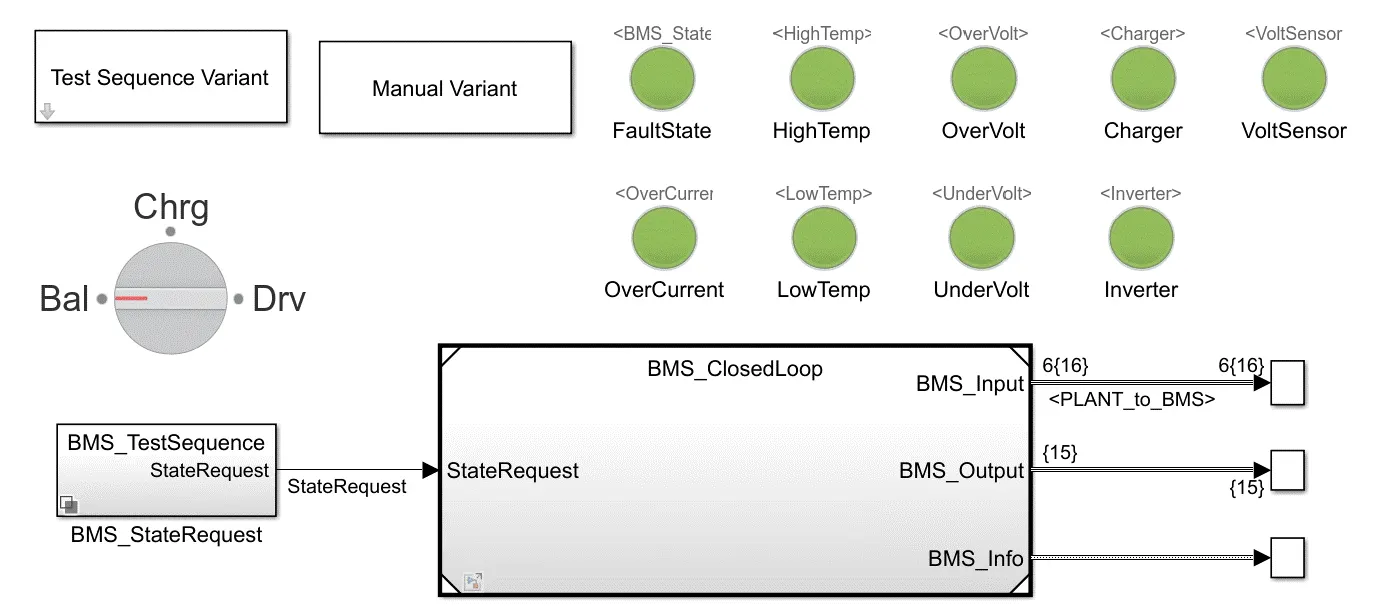

- Battery is only in charging mode
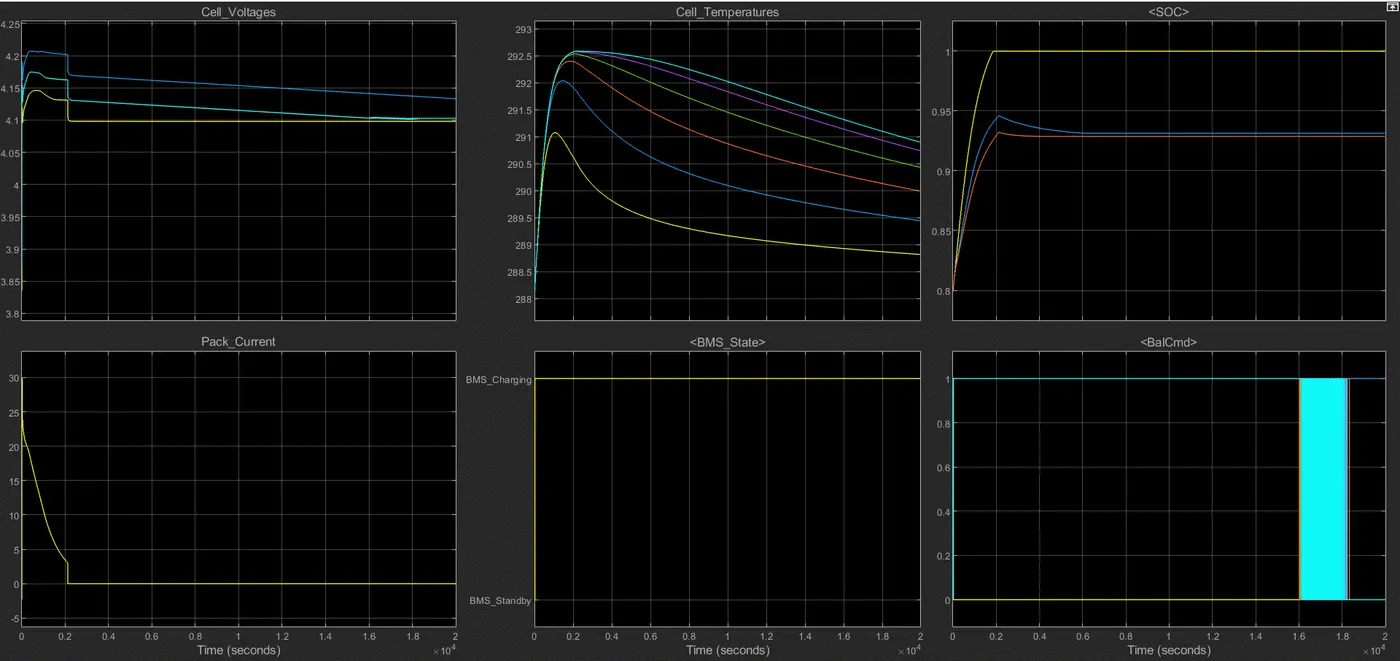
OBSERVATIONS:
- Since the battery is only in charging mode, the sudden influx of current from 0 to 30A is seen within the first 5 seconds (when zoomed in). Due to the surge of electrons into the cells, this also explains the drastic rise in temperature in all cells
- Cell balancing is in process since the beginning
- EKF has outperformed UKF by a little bit again, while Coulomb counting method for SOC approximation seems the most inaccurate one. We can say this because a SOC of 100% is highly unlikely, and with Coulomb counting it might be displaying 100% because it is only pre-programmed to do so at the end of CCCV charging. EKF shows a SOC of 93% while UKF displays 94.5%, which seem more realistic and accurate.
Q2. WHAT IS COULOMB COUNTING? REFER TO THE ABOVE MODEL AND EXPLAIN HOW BMS IMPLEMENTS COULOMB COUNTING FOR SOC ESTIMATION?
SOLUTION:-
Coulomb counting
SOC is a measure of how much charge is available for use in the battery. For the application of rechargeable batteries in H/EVs, SOC is a crucial parameter and thus needs to be measured accurately though electronic and electric systems. It cannot be measured directly because it requires measuring the lithium content at both electrodes. Without accurate SOC measurement, the battery management system (BMS) would be unable to inform the user when the vehicle needs to be charged or what could be done to improve battery capacity. A few indirect methods have been discovered to measure the SOC:
- Chemical method: applicable only to cells that give open access to their electrolytes (non-sealed lead acid batteries for instance). The SOC can be measured from the specific gravity (hydrometer) or the pH (pH meter) of the electrolyte
- Voltage method: measures the present voltage of the battery to find its SOC using the discharge characteristics of the voltage vs SOC. Not a preferred method because temperature variations are not accounted for in this method which can cause the terminal voltage of a cell to vary from its OCV
- Current integration method (also known as Coulomb counting): involves measuring the amount of current entering and leaving the battery, integrated over time. A device called a coulomb counter will measure the current supplied or removed over a period of time, and will compare it to the pre-programmed capacity of the battery, hence determining the current SOC.
The figure below shows how SOC is modeled. The amount of current entering/leaving the battery is integrated over time and the effect of temperature on capacity is also accounted for by using a 1-D lookup table.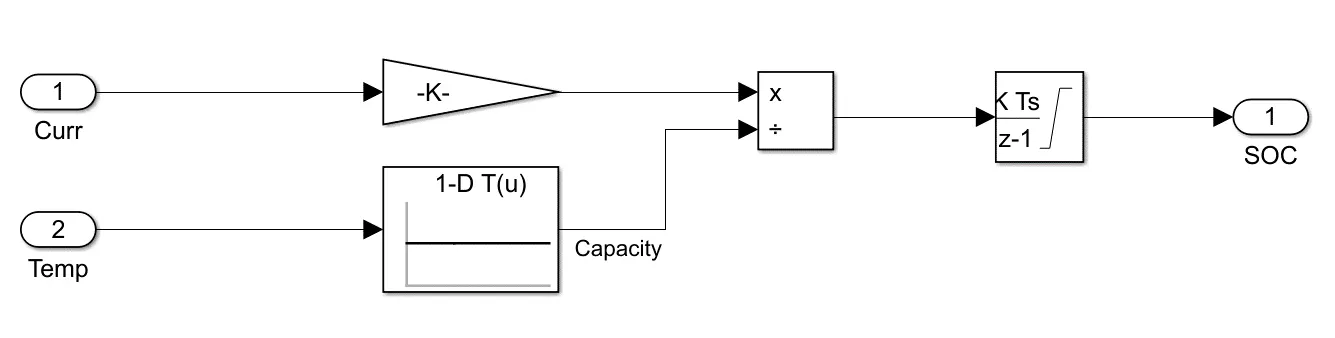
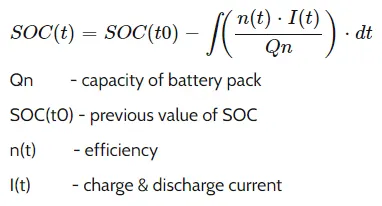
Although this is one of the most common ways of measuring SOC, it still suffers from a lack of reference point. The SOC needs to be recalibrated regularly back to 100% everytime a battery is fully charged, and this is dependent on how accurately the sensor determines a fully charged cell. This method also does not consider the changing efficiency of the cell, which is dependent on how much is the charging and discharging current. With greater charge/discharge current, the temperature of the cell increases, which affects efficiency. In addition, over time, the pre-declared capacity (Q) and efficiency of a cell reduces, so reduction in cycle life also affects the SOC measurement.
Steps for coulomb counting in BMS implementation.
- Develop the algorithm for the coulomb counting method
- Transfer the algorithm to the BMS (microprocessor)
The BMS is the hardware in PCB consisting of a processor, many sensors, connectors, indication lights, etc. Actually, BMS has many responsibilities like battery balancing, SOC, SOH, DOD estimation, under & over-voltage protection, thermal protection, providing battery pack cooling, calculating duty cycle, etc.
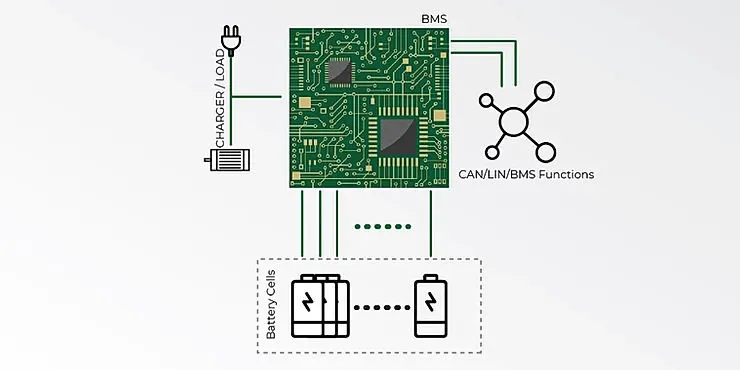
Here our only aim is to implement the coulomb counting method in BMS. so develop the algorithm according to the battery voltage, capacity.
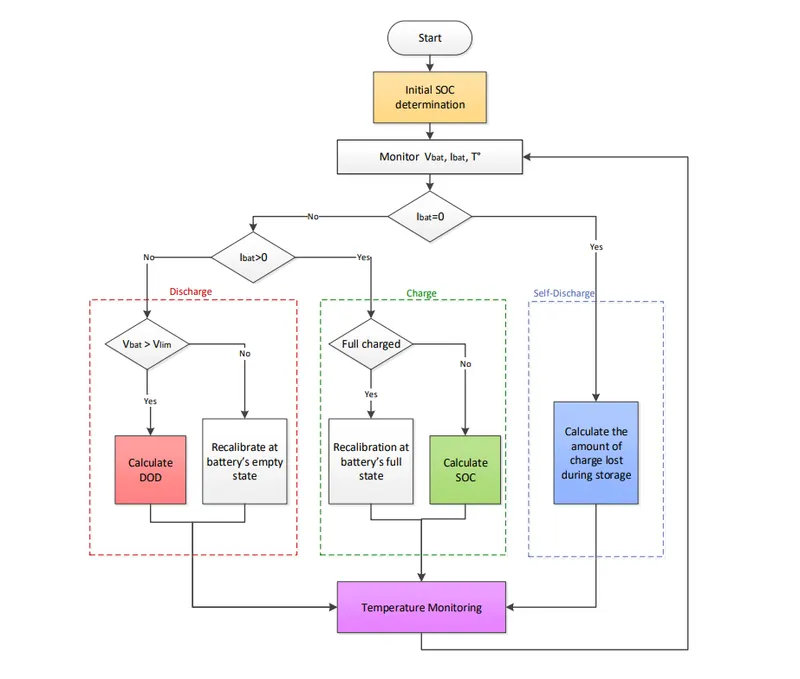
The initial value of SOC is mainly by the OCV method. Then based on the voltage level and charging mode the algorithm will execute.
So in our case of soc estimation, there will be a separate unit in the BMS for the estimation. Implement the algorithm in the hardware(processor), make the necessary connection to batteries and sensors, and analyze the result for charging and discharging.
CONCLUSION:-
While completing this challenge we learnt about SOC test for BMC and run it with three stages of simulation from harness dashboard. And later we learnt about coulumb counting, and how BMS implements coulomb counting for SOC estimation.