Week-4 Challenge WOT Condition Part-2
Q1. WHAT IS THE DIFFERENCE BETWEEN MAPPED AND DYNAMIC MODEL OF ENGINE,MOTOR AND GENERATOR? HOW CAN YOU CHANGE MODEL TYPE?
SOLUTION:-
Powertrain Blockset provides two types of combustion engine models:-
Mapped and Dynamic.
Mapped Model:
- In the mapped models the data is taken from a lookup table characterises the Engine/Motor/Generator performance under certain parameters.
- Mapped engines represent macro engine behavior as a set of lookup tables (brake torque, fuel flow, air mass flow, exhaust temperature, efficiency, and emissions) as functions of commanded load and measured engine speed.
- Mapped engine models are suitable for analysis and design activities that do not require engine subsystem dynamic characteristics, for example, in engine and transmission powertrain matching analysis for fuel economy, emissions, and performance tradeoffs.
- This model leads to faster solving times.
Dynamic Model:
- It combines the results of different componenets to get the dynamic effect.
- Dynamic models are used to if you need a more detailed and component level data and to analyse the impact of individual engine/Motor/Generator components on he overall performance.
- Dynamic engine models are suitable for designing control, estimator, and diagnostic algorithms that depend on dynamic subsystem states, for example, in closed-loop AFR control algorithm development.
- Dynamic engines decompose engine behavior into individual component models that account for engine dynamics, most notably intake airflow and turbocharger dynamics.
- Both the SI and CI engine models run in real time for hardware-in-the-loop (HIL) testing.
- You can switch between engine model types based on your application.
To change Model Type:
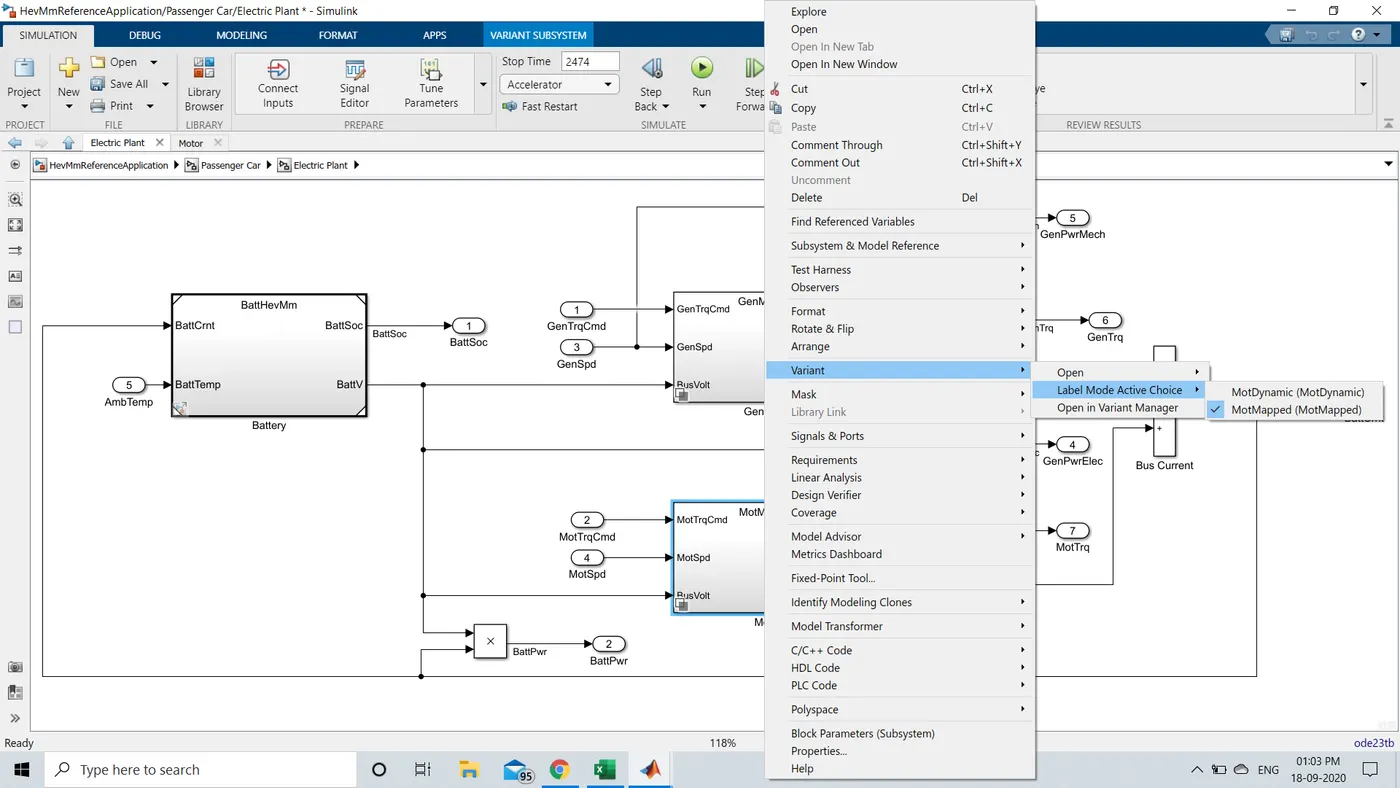
- Open the powertrain blockset for required vehicle and go to pasenger vehicle block and select the electric plant or engine plant.
- Next, Right click on the Engine/Motor/Generator based on vehicle model, select the varient and select label model active choice and choose mapped or dynamic for the required calculation.
Q2. HOW DOES THE MODEL CALCULATE MILES PER GALLON? WHICH FACTORS ARE CONSIDERED TO MODEL FUEL FLOW?
SOLUTION:-
Fuel efficiency is a form of thermal efficiency, meaning the ratio from effort to result of a process that converts chemical potential energy contained in a carrier (fuel) into kinetic energy or work. Overall fuel efficiency may vary per device, which in turn may vary per application, and this spectrum of variance is often illustrated as a continuous energy profile.
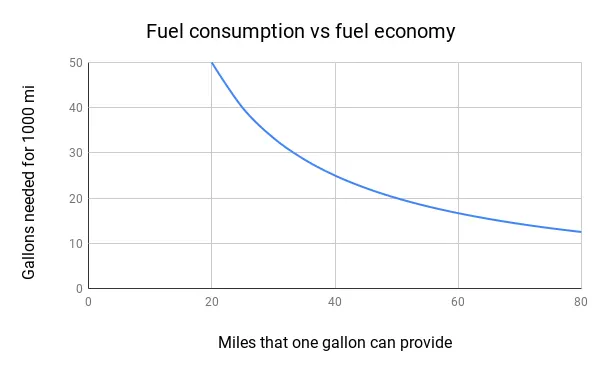
Fuel consumption is a more accurate measure of a vehicle's performance because it is a linear relationship while fuel economy leads to distortions in efficiency improvements.
Explanation:-
In this model the fuel consumption are calculated in miles per gallon through performance calculation block in visualization. That performance calculations block are shown as below-
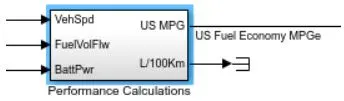
The performance calculations block calculate the mileage and consumption of fuel taken in distance. That can be calculated by three characterstics they are given below-
- Battery Power
- Fuel Volume Flow
- Vehicle speed
Battery Power:-
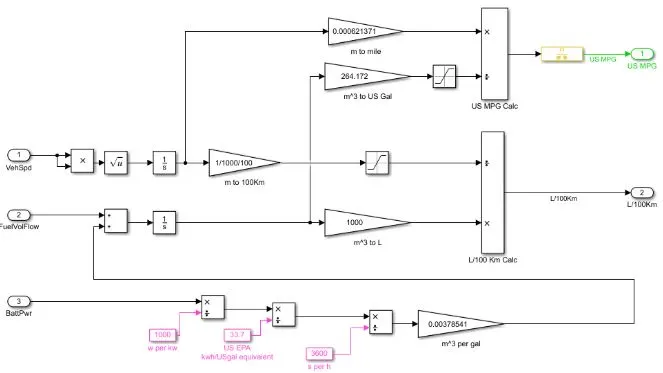
In first step the battery power unit is converted from W to KW by dividing 1000 and output values are obtained. That output of power KW is now converted into KW/h to US EPA(standard) by dividing with the value of 33.7. The output values from the KW/h is coverted into second by dividing the value with 3600.
Therefore output value are obtained as kws/USgal. And that value is converted for volume of fuel flow so that output is multiplied by 0.00378541 as the result of m^3 per gal is obtained.
Fuel Volume Flow:-
By adding the two inputs of 0.00378541 and the value of fuel volume flow the output is obtained. And that output is integrated through integration block for getting an m^3. The ouput is now converted into Litre for calculate the fuel consumption of vehicle.
Vehicle Speed:-
Vehicle acceleration speed is also depends the fuel consumption and to calculate mileage per distance . The input of vehicle speed is splited by two equvalent values and product the values and again take square root of values from the output of product that will gives the same answer. But the only way to negelecting the negative terminals this step is followed.
Now integrate that output values and results will be in meter(m). To convert the m to km for distance 100. 1/1000/100 is proceed by conversion of distance. The output values are now entered in the saturation block for intitate the lower limit value of distance during the acceleration.
The output value of fuelvol flow and vehicle speed is now multiplied and dividing in the other same block where the results gives L/100km calc.An output shows the mileage for distance of 100km.
Conversion In Miles Per Gallon:-
The Same process is followed for the US gal also but after finding the m^3 in the fuelvolflow the m^3 will changed into US gal by product of the value 264.172 and saturation block is intitate to lower limit of distance during acceleration. In vehicle speed derivation also changed after the integration of speed as m. To convert the unit as m to mile by product the value of 0.000621371.
Then after converting the units an output value of fuelvol flow and vehicle speed is now multiplied and dividing in the other same block where the results gives US MPG CALC. That shows the vehicle miles per gallon in US standard.That flowdiagram is shown below-
Model Fuel Flow:-
Fuel flow plot is obtained from the vehicle engine system by clicking the engine setup there are many flow is opened by that dialogbox and plot the graph which observation is needed.
In this flow the fuel mass flow is intiated with the form of lookup table , Engine speed (RPM) and Torque (Nm) is noticed during the flow of fuel that will accelerates the vehicle.
Here the engine speed is rasied by the flow of fuel it will also increased the torque so that distance travel of vehicle is raised during the fuel flow. The velocity of vehicle is increased or decreased by the accleration of vehicle.
Battery Flow:-
Battery flow represents the power transmission from the battery to motor and that flow of power will increase the vehicle speed and distance travel of vehicle. Certain amount of cell is filled in battery that will based on the capacity of battery power.
It will transmit the power upto the capacity of battery and it will drained after energy level of battery. Recharging conditions are done during the deacceleration of vehicle.
Factors that effects the fuel Economy:
- Excessive Short Trips
- Frequent Cold Weather Travel
- Heavy Braking or Acceleration
- High Vehicle Weight or Towing Weight
- Speeding.
Q3.RUN THE HEV REFERENCE APPLICATION WITH WOT DRIVE CYCLE. CHANGE THE GRADE AND WIND VELOCITY IN THE ENVIRONMENT BLOCK.COMMENT ON RESULTS.
SOLUTION:-
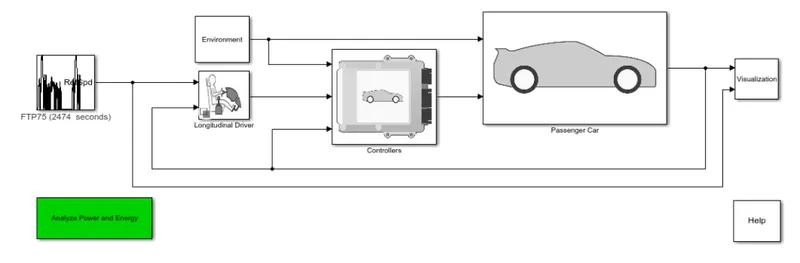
The above is the HEV design with WOT.
Now we will exlpore the multimode reference application.
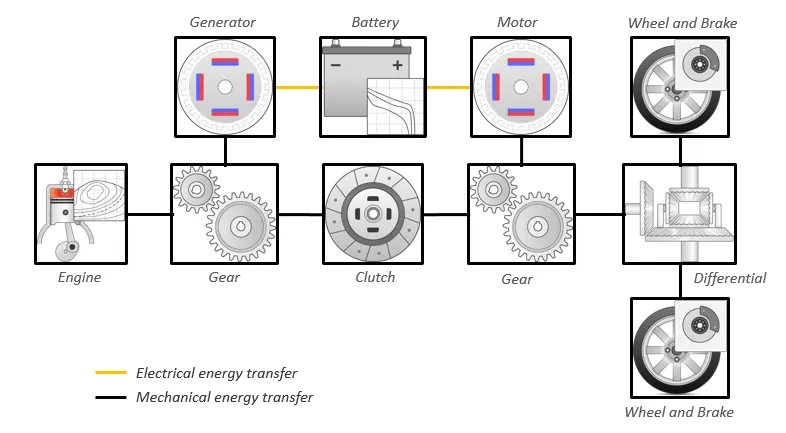
By default, the HEV multimode reference application is configured with:
-
Mapped motor and generator
-
1.5–L spark-ignition (SI) dynamic engine
This diagram shows the powertrain configuration.
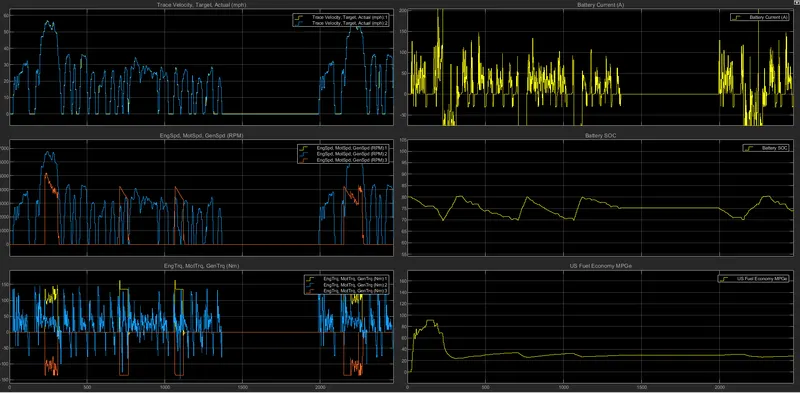
RESULTS:-(WITH NO CHANGE IN GRADE OR VELOCITY)
Now, we will try to change the grade and velocity environment block and see the results.
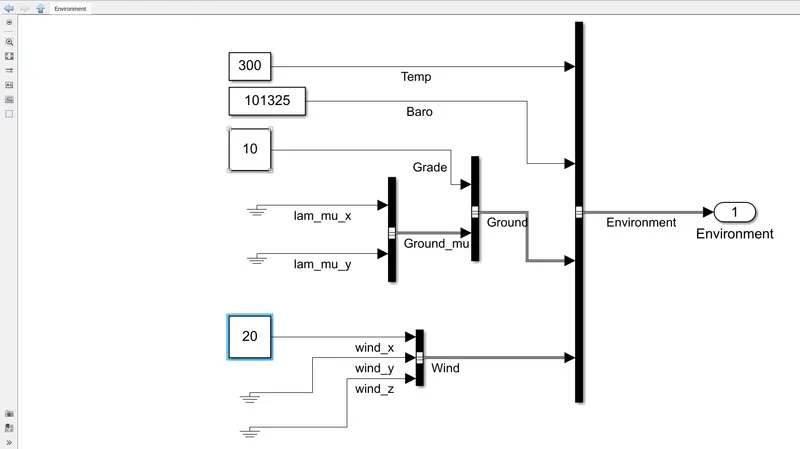
Here, we have changed the grade to 10 and velocity to 20, now lets see the results.
RESULTS:-
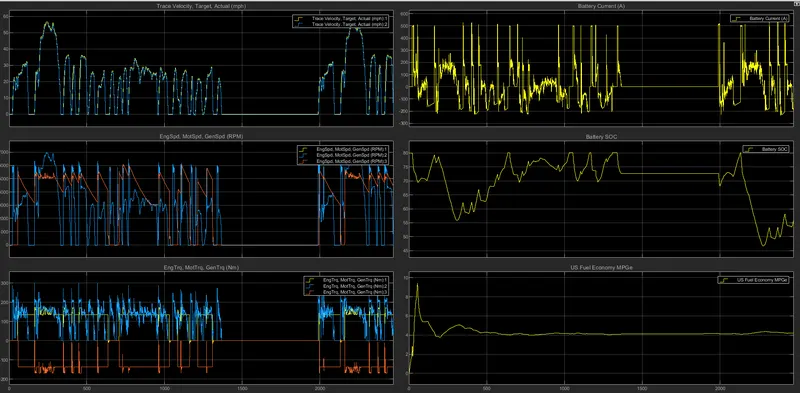
OBSERVATIONS:-
We noticed that all other grapgs are equal other that battery SOC and fuel economy, we saw drastick change in graphs of both the two.
Q4.KEEPING ALL OTHER PARAMETERS SAME, COMPARE THE SIMULATED RESULTS OF HYBRID AND PURE ELECTRIC POWERTRAINS.
SOLUTION:-
We have already seen the model and results of HEV model, here we will try to implement the same for EV.
Model:-
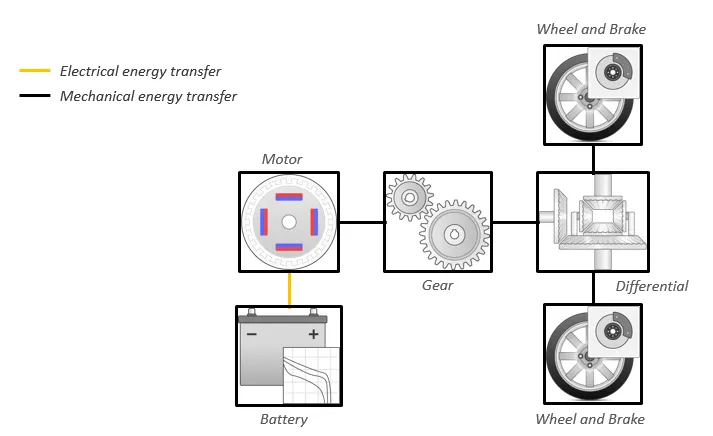
Basically, both the system has same design model.
Lets see the powertrain model:-
In the same way as above here too we will be putting same value for grade and velocity as 10 and 20.
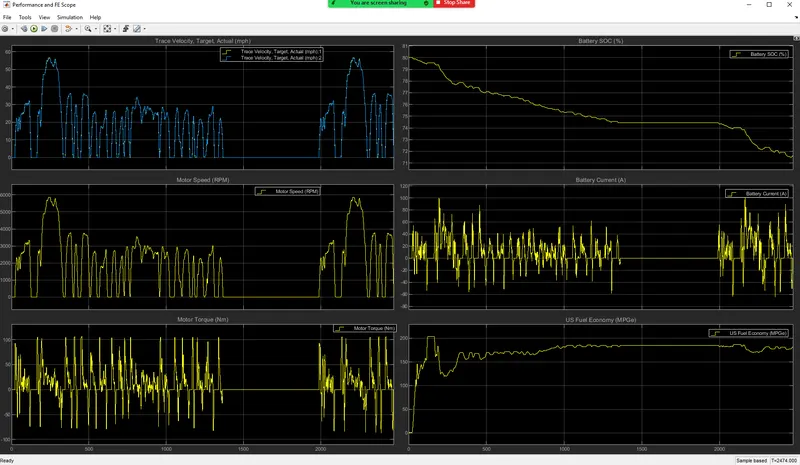
RESULT:-(WITH DEFAULT INPUT)
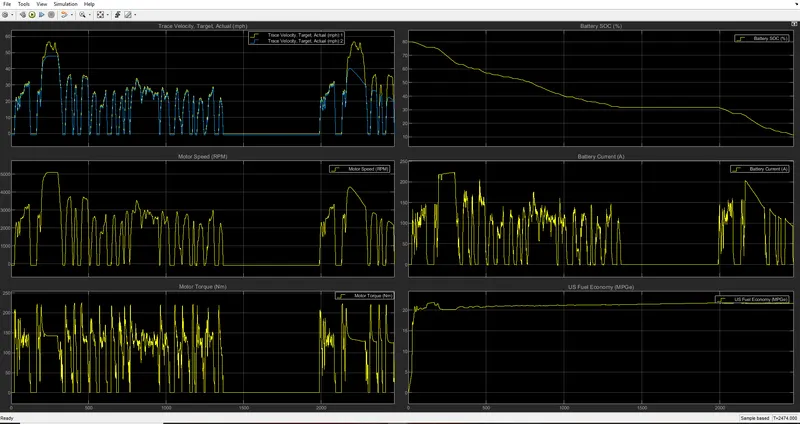
(WITH GRADE=10 AND VELOCITY=20)
OBSERVATIONS:-
- The drivetrain loss for EV vehicle is more than the HEV vehicle. Whereas the power loss in EV vehicles is less than that of HEV vehicle.
- Therefore the EV vehicle is more efficient than the HEV vehicle because an battery used for Electric vehicle is Lithium ion which has low discharge rate than the battery used for HEV Nickel-metal hybrid battery
- In hybrid vehicle the emission is obtained and the fuel consumption rate is high. whereas the Electric Vehicle release the 0% of emission this will grade as suitable for environmental condition.
- Therefore all simulations are done and models are extracted for comparing the HEV and EV.
CONCLUSION:-
Thus, we learnt about the EV and HEV modelling, their structure and also learned to put different values for
grade and velocity to see the resultant output.
We also compared EV and HEV through their ressultant output in graph by putting the same value in both the cases.