Project 2 Thermal modeling of battery pack
Q. FOR A 10 CELLS SERIES LITHIUM ION BATTERY MODEL, SIMULATE THE THERMAL EFFECTS AND COMPARE LIFE CYCLE PERFORMANCE AT VARIOUS TEMPEERRATURES, CHARGE & DISCHARGE RATES USING MATLAB.
SOLUTION:-
Theory:-
EVs, HEVs and PHEVs are powered by lithium-ion cells which are fined together in a battery pack with particular series and parallel arrangements. These amargements and the number of cells in a battery pack are designed based on the power requirement of the vehicle. During the design stage of a battery pack the cells in the pack are tested to simulate their thermal effects and life cycle performance under various conditions. These conditions are real life situations that the battery pack may operate at when in use in a vehicle by a user, and these tests are performed to observe how the cels behave. The conditions will test the battery pack at normal operating levels as well as at their extremes. For instance, the battery pack may be tested under different charging and discharging rates different temperatures etc. As per the specifications of lithium ion cells, it is very important that the application of the cells follows the charging-discharing rates as well as the temperature range. Disregarding these operating ranges will result in the accelerated degradation of the capacity and working life of the cell or worse -a thermal runaway effect. So it is very important that the manufacturers of EV, HEV and PHEVs perform the thermal modelling of a battery pack before implementing it. In this project a SIMULINK model is used to simulate different operating conditions for a battery pack and will observe the resultant effects of the temperature and chage/discharge rates on the battery pack and analyse these effects.
It has been very know that the temperature of the battery is important for their performance, efficiency, safety, and capacity. On the one side the temperature is influenced by the environmental temperature; on the other side the temperature of the battery is influenced by the charging and discharging process. As the ageing of the battery cell accelerates when the temperature of a cell is too high, battery management systems (BMS) take into account this effect using the battery temperature. Additionally, with the knowledge of the core temperature a BMS can adapt the current flow so that the efficiency of a battery is at its optimum. Due to the difficulty measuring the battery cell temperature, the temperature is often measured on or near the poles of the cell. We know that the temperature measured at the poles of a dynamically loaded battery varies to the relevant cell temperature. Hence, the accuracy of the measurement at the poles is limited. Therefore a thermal model of the battery is used in order to calculate the cell temperature.
Simulink Model:-
The model attached below has been made using the Simulink feature of MATLAB:
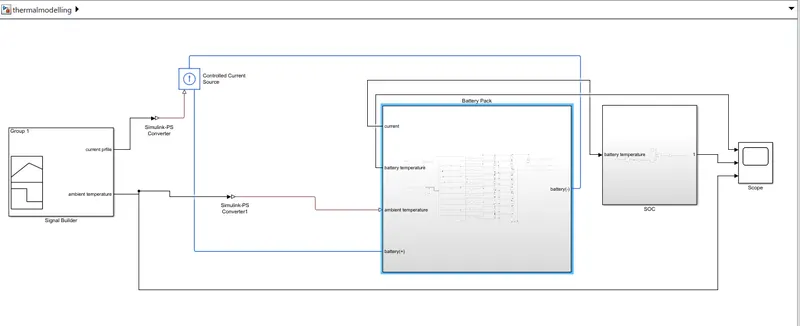
Fig.1. Upper Layer of the Simulink Model
In the model above, we are taking the current and ambient temperature profile with the help of a signal Builder. The signal bulider contains two different profiles, one of Current Vs Time and the other for Ambient Temperature Vs Time. The data is available for a time period of 18000secs(5 Hours).
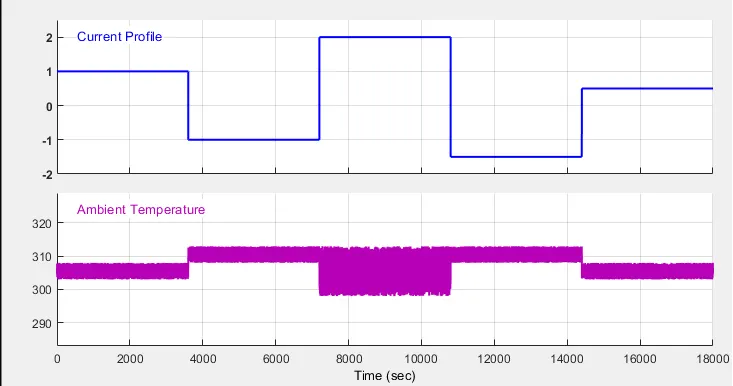
Fig.2. Current and Ambient Temperature profiles
Above are the profiles as entered into the signal builder. For this simulation, a current profile is taken, where the battery is being drained at 1A for 1 hour and then is charged at 1A for the next 1 Hour,for the next 1 hour the battery is being drained at 2A followed by a charge and discharge of 1.5A and 0.5A, this is done for a total of 18000secs. Also, the battery is tested for a range of temperature betweeen 298K and 304K, at different charge and discharge. So, can be clearly seen in the figure 2.
For charge and discharge, a controlled current source is used.
 |
The block represents an ideal current source that is powerful enough to maintain the specified current through it regardless of the voltage across it. The output current is I = Is, where Is is the numerical value presented at the physical signal port. |
This controlled current source is connected across the terminals of the battery. The model of the battery under the mask is shown below:
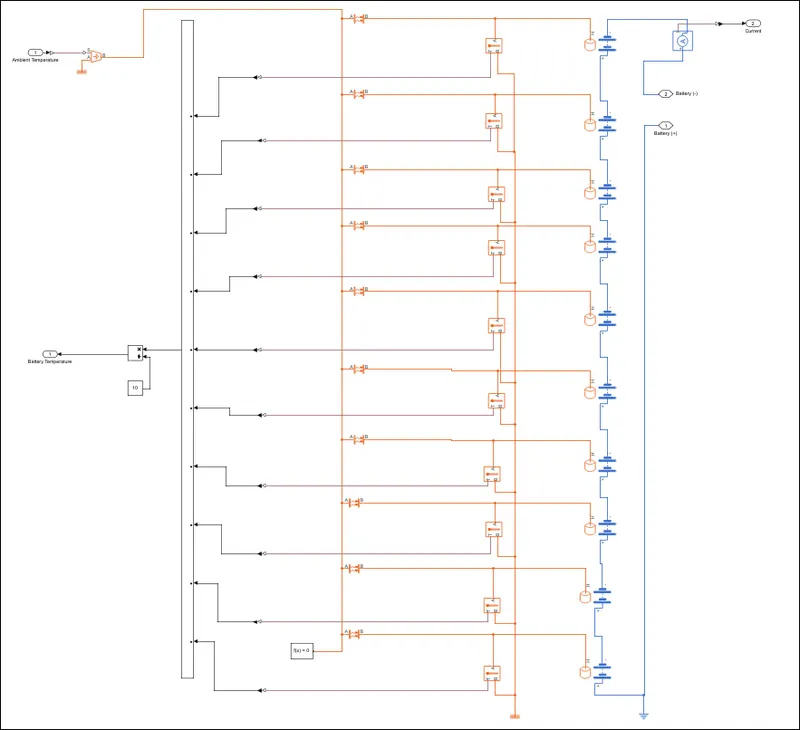
Fig. 3. Battery Model under the mask (refer fig. 1. to see the upper layer)
We have connected 10 cells in series. To model the battery pack battery cells have been used.
For making the above battery pack following blocs have been used:
|
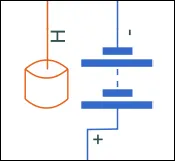
Battery:
|
This block models a battery. If you select Infinite for the Battery charge capacity parameter, the block models the battery as a series internal resistance and a constant voltage source. If you select Finite for the Battery charge capacity parameter, the block models the battery as a series internal resistance plus a charge-dependent voltage source defined by: V = Vnom*SOC/(1-beta*(1-SOC)) where SOC is the state of charge and Vnom is the nominal voltage. Coefficient beta is calculated to satisfy a user-defined data point [AH1,V1]. |
|
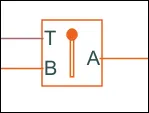
Temperature Sensor:
|
This block measures temperature in a thermal network. There is no heat flow through the sensor. The physical signal port T reports the temperature difference across the sensor. The measurement is positive when the temperature at port A is greater than the temperature at port B. |
|
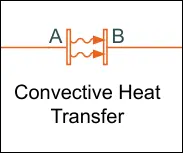
Convective Heat Transfer:
|
This block models heat transfer in a thermal network by convection due to fluid motion. The rate of heat transfer is proportional to the temperature difference, heat transfer coefficient, and surface area in contact with the fluid. |
|
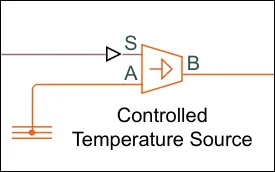
Controlled Temperature Source:
|
This block represents an ideal energy source in a thermal network that can maintain a controlled temperature difference regardless of the heat flow rate. The temperature difference is set by the physical signal port S. A positive temperature difference causes the temperature at port B to be greater than the temperature at port A. |
|
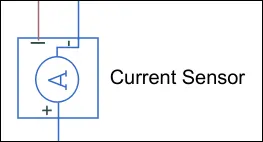
Current Sensor:
|
The block represents an ideal current sensor, that is, a device that converts current measured in any electrical branch into a physical signal proportional to the current. Connections + and - are conserving electrical ports through which the sensor is inserted into the circuit. Connection I is a physical signal port that outputs current value. |
Following are the battery parameters that are take for the simulation:
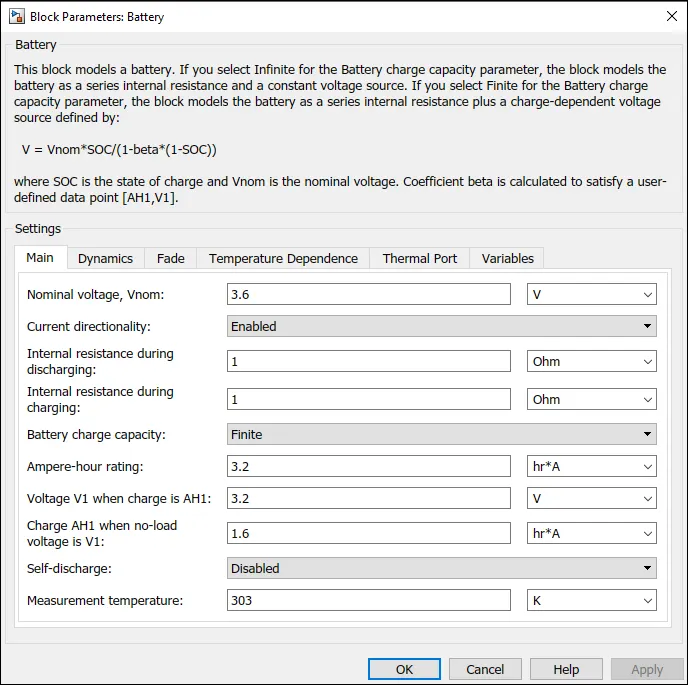
Fig. 4. Battery Parameters
In the battery model, the temperature is measured using the temperature sensor for each of the cells used. In order to calculated the temperature of the battery pack, the average of all the values of the temperature is done and then taken is the overall battery pack temperature. In the battery pack we have considered perfect insulation of each cell, i.e., there is no conduction between the cells, hence there will be no temperature rise in the battery pack due to the heat transfer between the cells. The only rise or fall in the battery pack is due to the average effect of the individual cell temperature.
Also, for the current measurement we have connected the current sensor in series with the battery pack, which will also help in estimating the SOC of the battery for the particular charge/discharge rate.
For SOC estimation, following model is implemented:
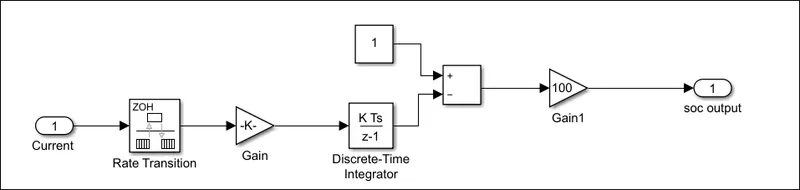
Fig. 5. SOC Estimation
Results and its Analysis:
Change in Battery pack Temperature due to the effect of Ambient Temperature:
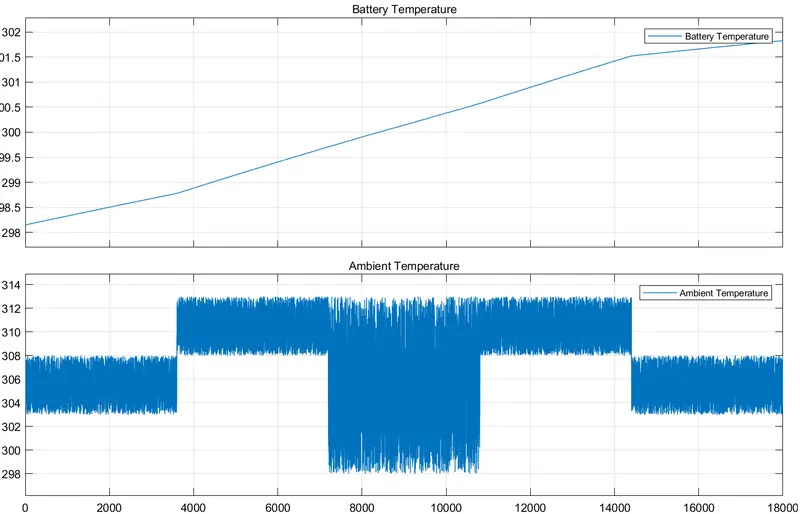
From the above figure it can be clearly seen that, the battery pack pack temperature is directly related to the ambient conditions. As the ambient temperature is increasing the battery pack temperature is also increasing. This is very evident from the first 4000 secs of the simulation. After this the ambient temperature range is constant with some variation in the range from 7200 secs and 14000 secs. In this zone from 3600 secs to 14000 secs the battery temperature increases gradually upto some value. After 14400 secs, the ambient temperature falls to the initial range, during this period the battery pack temperature is also decreasing. So, from the above variations it can be said that the ambient temperature and battery pack temperature have a direct relation.
Change in the battery State of Charge at different charge and discharge rates:
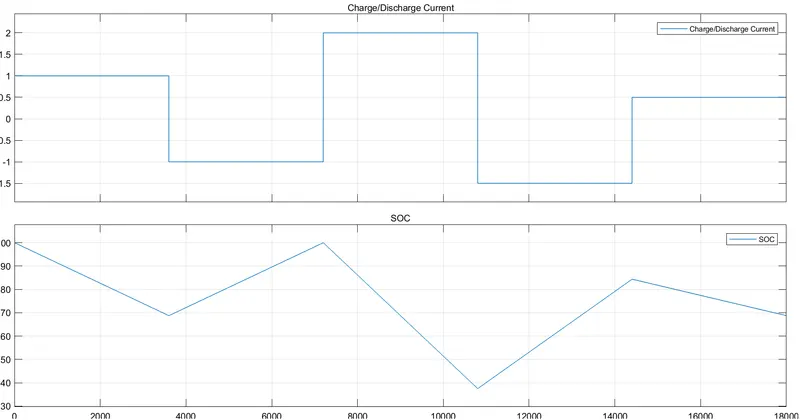
From the above battery SOC, we can comment on the effect of different charge/disharge rates on the battery SOC.
- In the above results, for the first 3600 secs of the simulation, the battery is discharged at a constant current of 1A, for this period the SOC of the battery pack falls in the range of 60% - 70%.
- After this the battery is again charged at a constant rate of 1A, at the end of this stage, i.e., at 7200 secs, the battery SOC is again 100%, because the battery is charged and discharged at the same rate for the same amount of time. Therefore, the SOCs at the start of stage 1 and at the end of stage 2 are equal.
- Now, from 7200 secs till 10800 secs, the battery is again drained at 2A (double of the previous discharge rate), in this period the battery SOC falls below 40% and is ranging between 30% - 40%. So, with the more discharge current the battery SOC is reducing at a faster rate and the decline is also more.
- After this the battery is again charged for the next 1 hour at 1.5A, but now the SOC is not 100%, this is due to the charge rate. Privously, in both the steps the charge and discharge rate is equal and the battery is charged / dischargd for eqaul amount of time, but in this case, the battery is first discharged with 2 A -thus the lower SOC- and then charged with 1.5 A but the time provided for the charge is insufficient to make it reach 100% SOC. (Here it is assumed that the rate of charge and rate of discharge are equal).
CONCLUSION:-
Thus while making this project we learnt to model a series of batteries to form a pack, we also understood the thermal effects concept related to batteriesand charging and discharging of the same.