Week 2 - Flow over a Cylinder.
Report on 2D Simulation of Flow past a Cylinder Using ANSYS Fluent
Aim:
To simulate flow past a cylinder using Ansys fluent with following conditions
- Steady-state and Unsteady state flow for Reynolds number 100
- Steady-state with Reynold Number 10^1, 10^2, 10^3, 10^4, 10^5.
Objective:
This report focuses on the effect of vortex shedding when fluid flows over a circular cylinder. The cylinder experiences the lift and drag force and a periodically oscillating wake are formed behind the cylinder due to the von Karman effect when the fluid pasts the cylinder.
With the help of ANSYS Fluent, we will create the simulation of fluid flow over a cylinder, where fluid is whose density is 1 kg/m3 and dynamic viscosity is 0.01 kg/m-s. We will simulate the different cases as discussed. The objective of this simulation is to
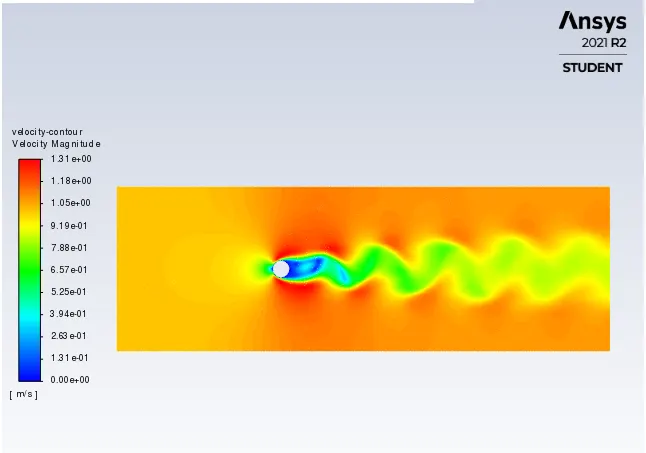
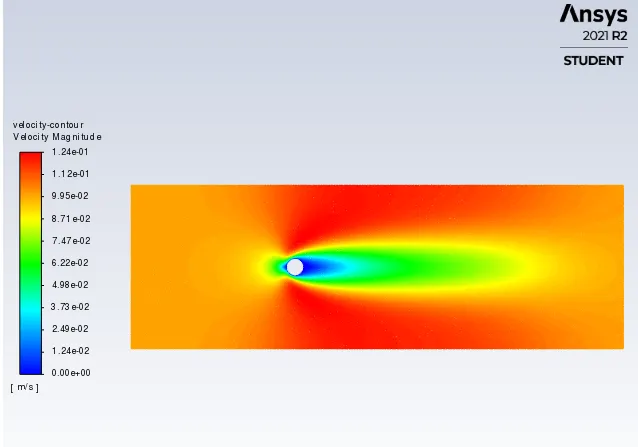
- Create a velocity contour plot to observe the nature of the wake of the cylinder.
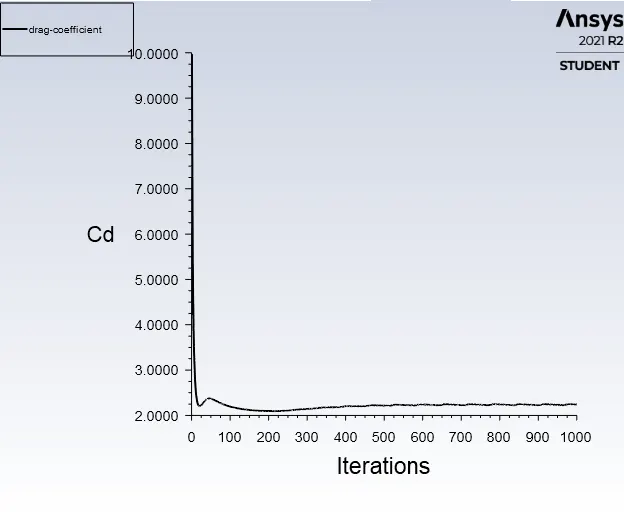
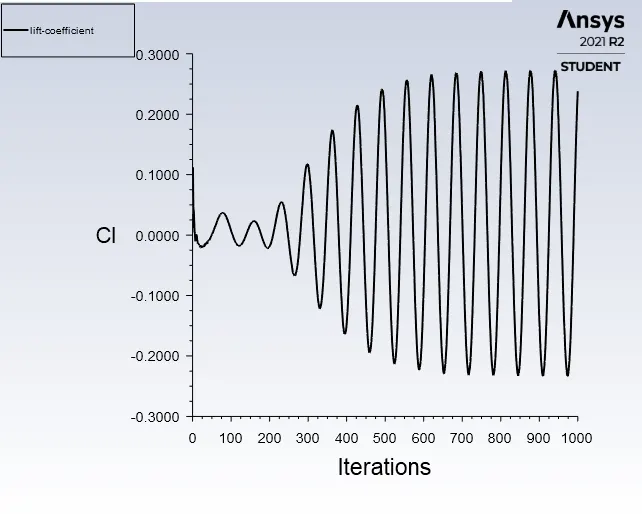
- Determine the drag and the lift coefficient over the cylinder.
- Calculate Strouhal Number for Re=100
Theory:
When a fluid flows around a blunt body like a circular cylinder, the flow separates off the surface, and vortices are formed. A characteristics street, known as von Karman street, is formed in the wake of the cylinder. Such vortices result in fluctuating flow velocity in the near wake of the cylinder, an alternating pressure field is set up. Consequently, high frequency oscillating transverse forces induce on the cylinder which excites the cylinder in the transverse direction. Force induced on the cylinder is known as vortex-induced force and the vibration induced is known as vortex-induced vibrations.
The transverse vortex-induced force oscillates at the frequency of vortex shedding. For a fixed cylinder, a linear relationship between the frequency of vortex shedding and flow velocity is found which is given as
`f = (St .U)/D`
Where f is vortex shedding frequency, U is fluid flow velocity, D is the diameter of the cylinder and St is the proportionality constant known as Strouhal Number.
As the shedding frequency approaches the natural frequency of a given cylinder, the natural vibration mode of the cylinder can take control of the vortex shedding process, forcing the shedding frequency to follow the vibration frequency around the natural frequency of the cylinder. This phenomenon is commonly called lock-in also referred to as synchronization or wake capture; the wake-oscillations are locked-in with the natural vibration of the cylinder. This leads to an increment in vibration amplitudes.
It is essential to study fluid flow over a cylinder because it helps in forming the basis for the prediction of the dynamic response of the structures to the vortex-induced vibration caused due to environmental loads by flowing fluids. Structures like tall buildings, skyscapes, chimneys, bridges; slender like electricity cables, pipelines, cables inside oceans, etc. are subjected to vortex-induced vibrations. It is important to determine such vibrations as they may lead to the failure of the structures. Failure of the Takoma Narrow bridge is an example of structural failure due to vortex-inducted vibrations.
Procedure:
Geometry
Open Space Claim and create the CAD model of a 2D rectangular domain with a circle using the following dimensions.
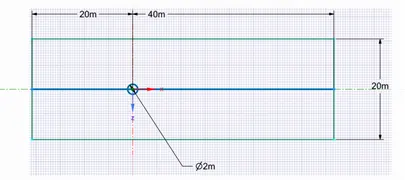
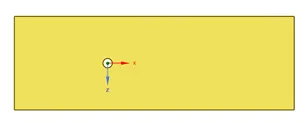
Create the surface from the above geometry with the help of the Pull option. Remove the circle in the center as the generated surface will act as the domain of fluid flow. This is the required 2D CAD model of the desired rectangular domain
Meshing
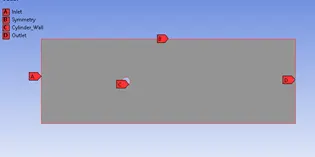
- Initially, name each section of the domain as shown below.
With the help of a meshing tool, we will create a basic mesh.
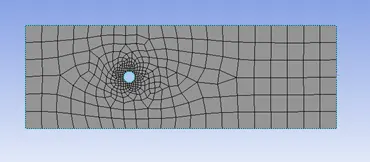
Further, we will refine the mesh using different methods for better accurate results. Insert Method option and create the mesh with triangular elements, each element of size 0.2m.
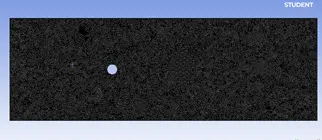
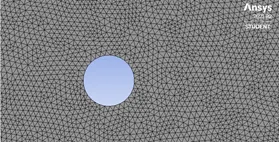
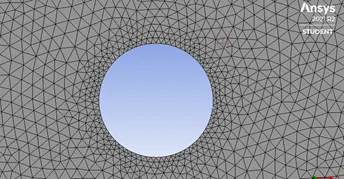
The cylinder becomes an n-sided polygon because of coarse meshing. This causes the formation of edges leads to inaccurate results. Insert edge sizing on cylinder wall with 72 divisions to make cylinder wall round enough.
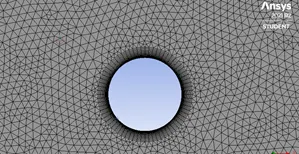
Since the von Karman effect begins near the walls of the cylinder, we need to refine the mesh near the cylinder wall. Add 20 inflation layers near the cylinder wall with a growth rate of 1.1 where the first layer height is 0.005 m.
Setup
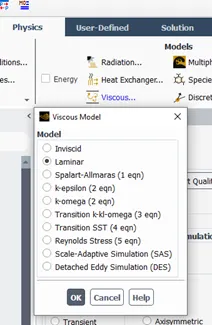
We need to set up the physics for the current simulation for a solution. Select the Laminar flow for Viscous Model as the von Karman effect is best observed in the laminar flow.
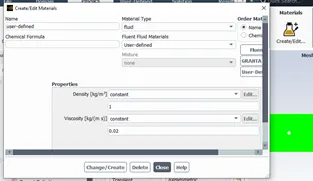
For the sake of simplicity, create a user-defined material whose density is 1 kg/m3 and viscosity is 0.01 and select this material for the flow simulation.
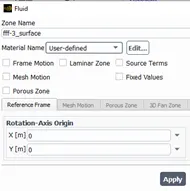
By varying the Inlet velocity condition, we will manipulate the Reynold Number for the fluid flow simulation using the relation
`Re = (rho*U)/(mu)`
Where Re is Reynolds number
Rho is density
U is free stream velocity
To understand the effect of vortex shedding on the cylinder and the stream of the fluid past the cylinder we need to measure the change in the parameters like velocity, drag coefficient, lift coefficient to the iterations/time step.
Creating plot for
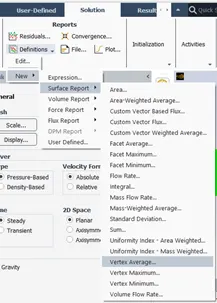
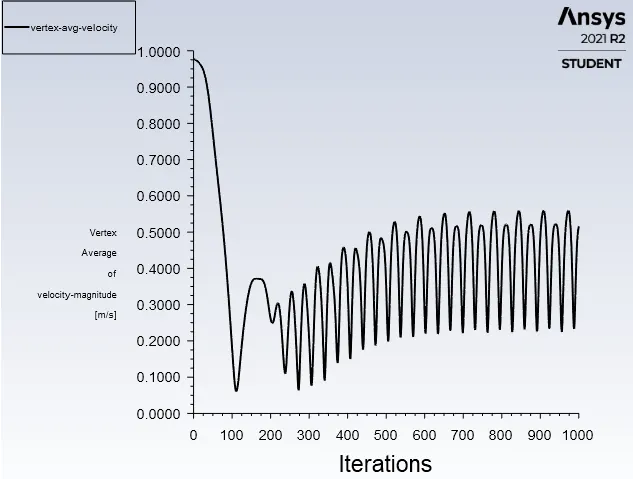
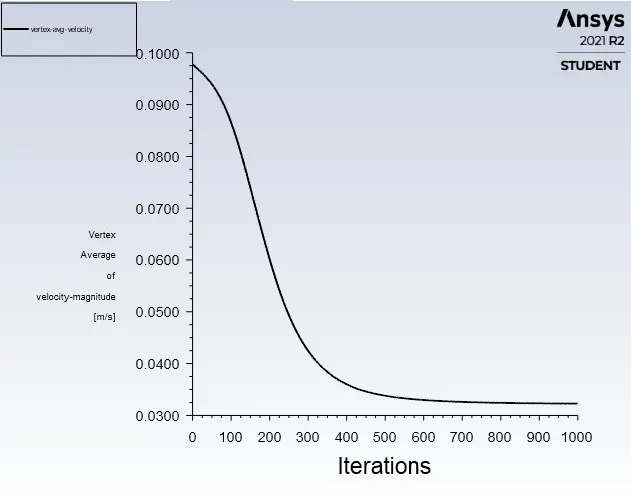
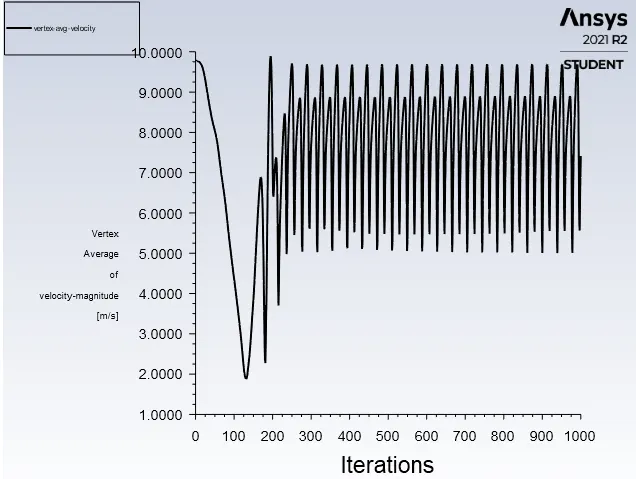
- Average Velocity at the vertex 6m from the center of the circle. (This plot helps to determine vortex shedding behind the cylinder)
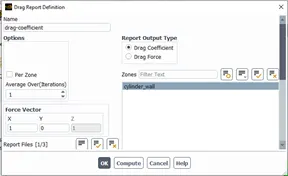
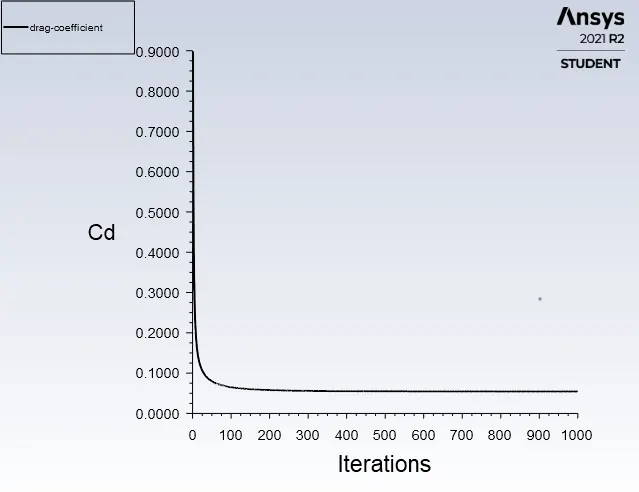
- Drag coefficient over the cylinder wall.
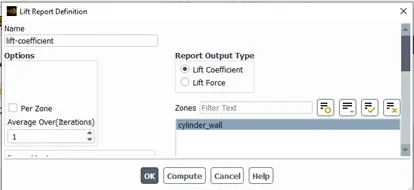
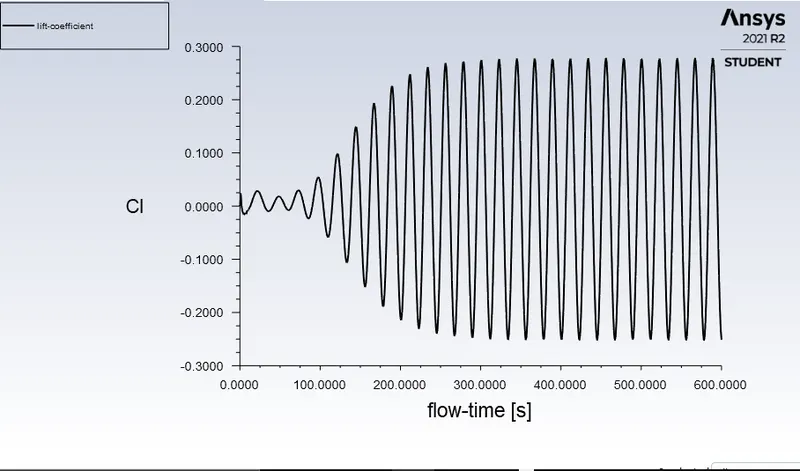
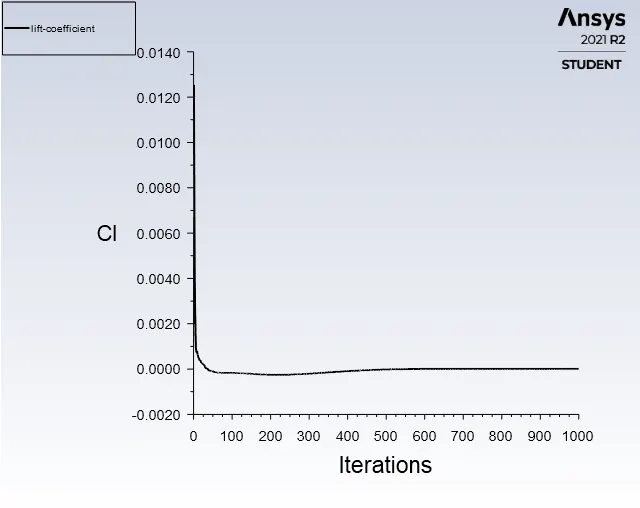
- Lift coefficient over the cylinder wall.
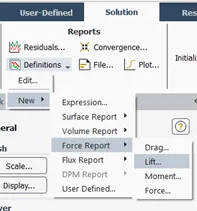
Follow the below image to create plot for i) Average Velocity
ii) For Drag and Lift
Results:
Part 1: Steady vs Unsteady State Simulation for Re=100
Since the viscosity and the density of the fluid is constant, the velocity of the fluid is 1 m/s such that the Reynolds Number is 100
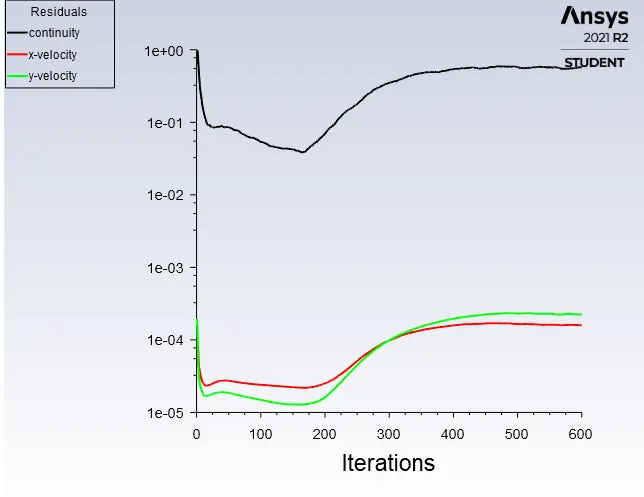
For Steady-State Flow
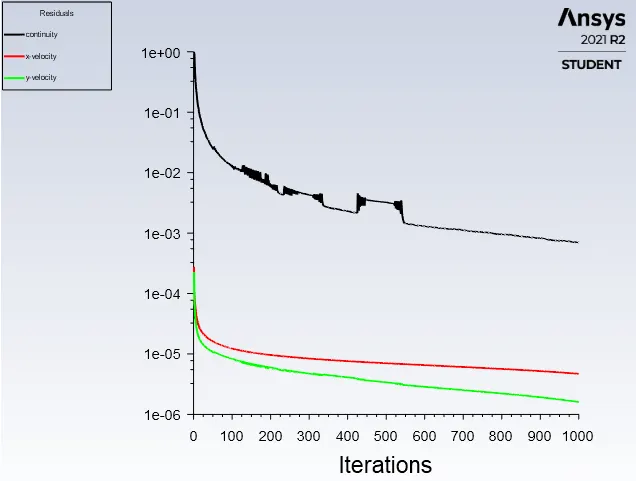
Convergence Plot
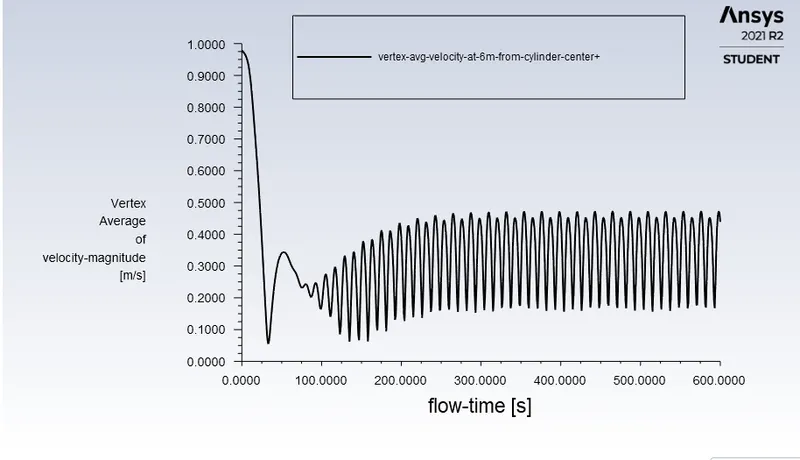
Average Velocity at the vertex (6 m from the center)
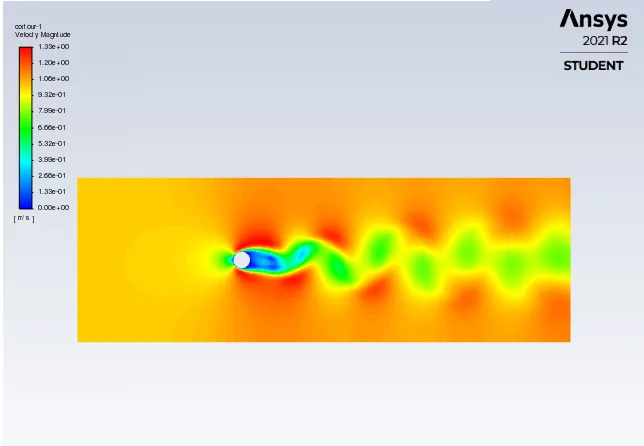
Velocity Contour Plot
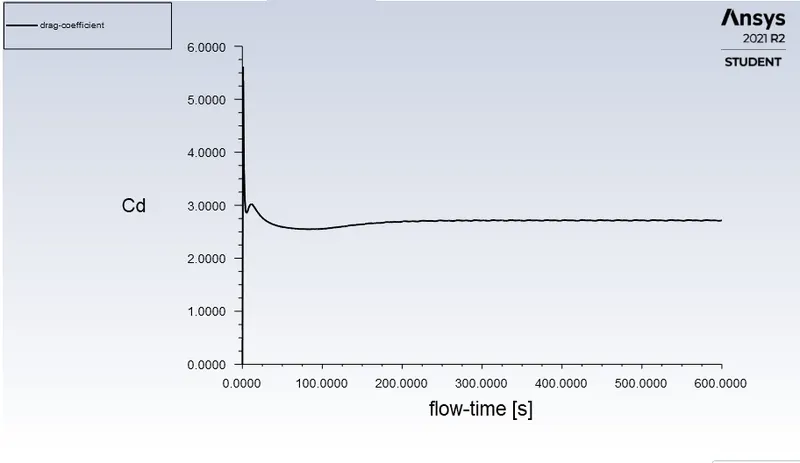
Plot of Drag Coefficient and Lift coefficient
For Unsteady-State Flow
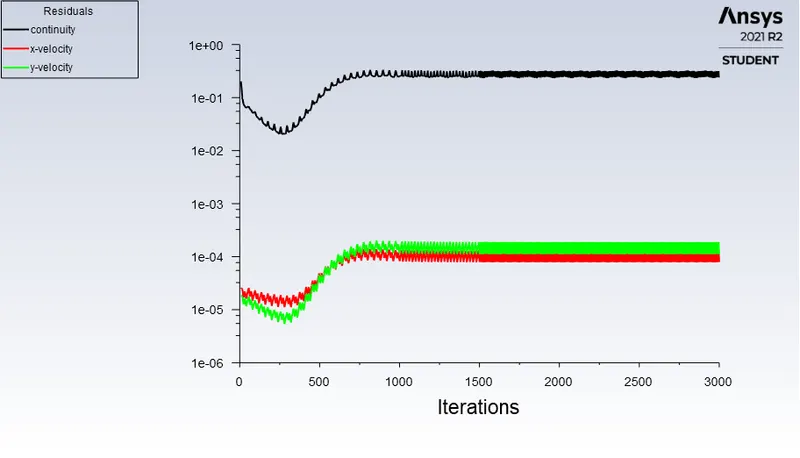
Convergence Plot
Average Velocity at the vertex (6 m from the center)
Velocity Contour Plot
Plot of Drag Coefficient and Lift coefficient
Part 2: Steady-State flow over a cylinder with
a. Re=10
Convergence Plot
Average Velocity at the vertex (6 m from the center)
Velocity Contour Plot
Plot of Drag Coefficient and Lift coefficient
b. Re=100
Convergence Plot
Average Velocity at the vertex (6 m from the center)
Velocity Contour Plot
Plot of Drag Coefficient and Lift coefficient
c. Re=1000
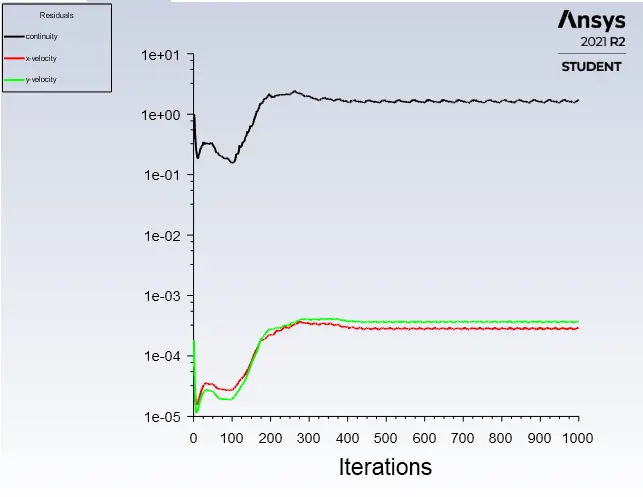
Convergence Plot
Average Velocity at the vertex (6 m from the center)
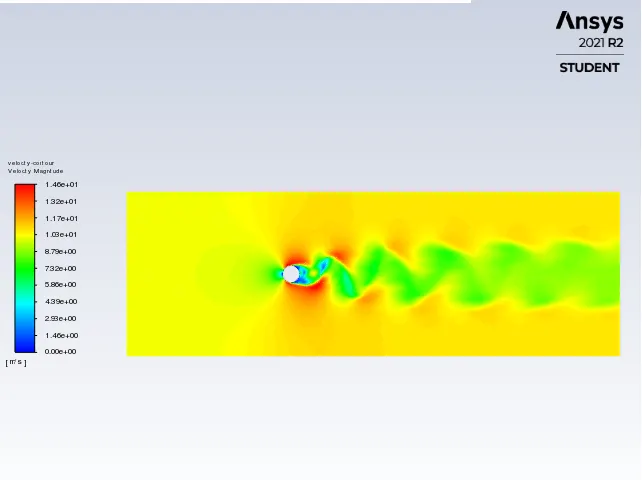
Velocity Contour Plot
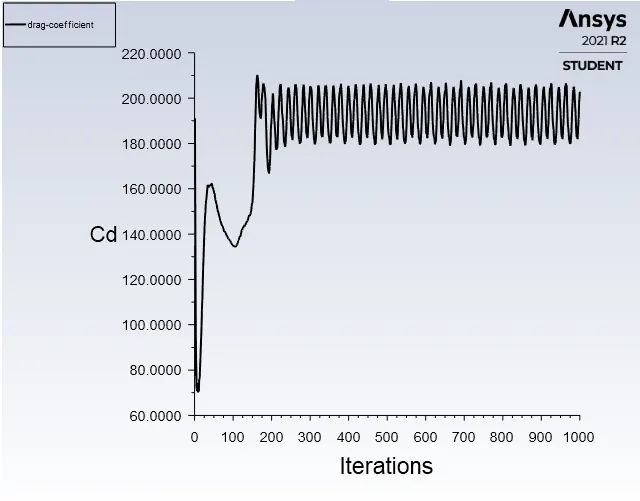
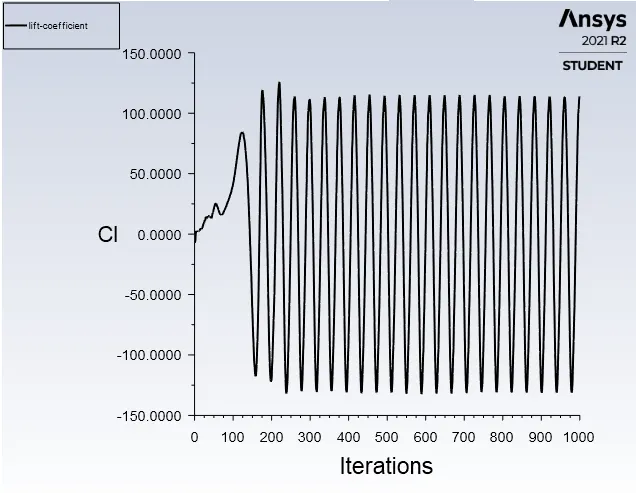
Plot of Drag Coefficient and Lift coefficient
d. Re=10000
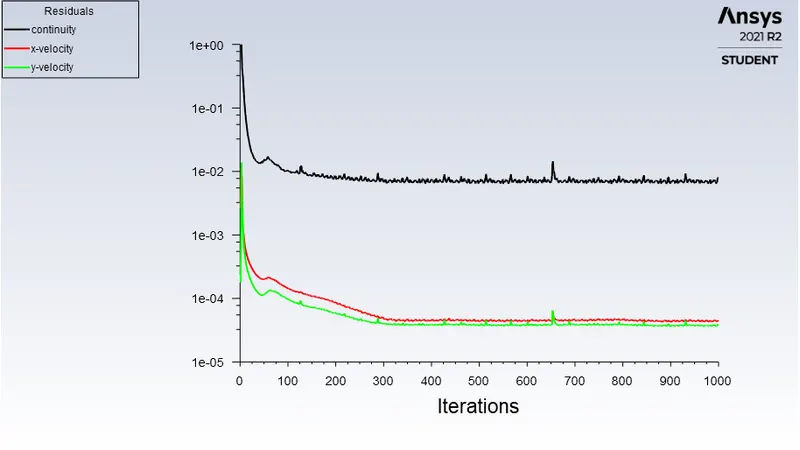
Convergence Plot
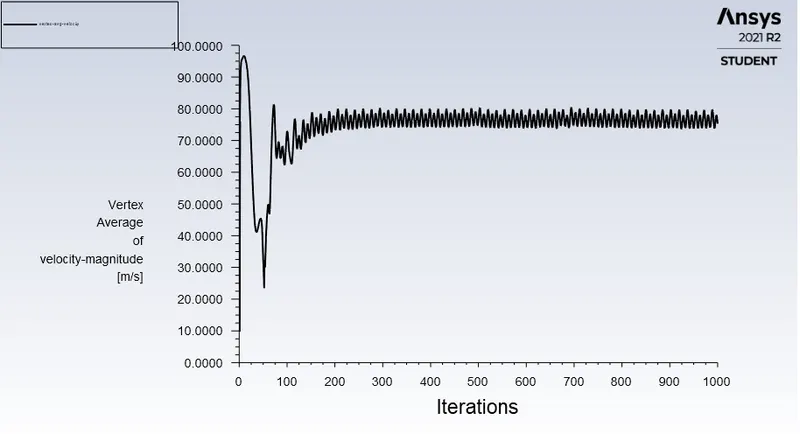
Average Velocity at the vertex (6 m from the center)
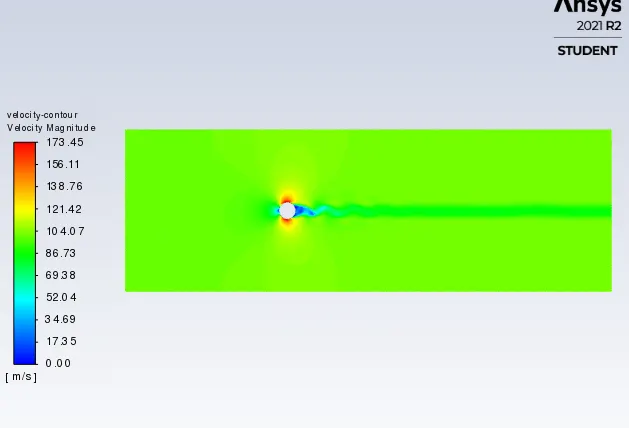
Velocity Contour Plot
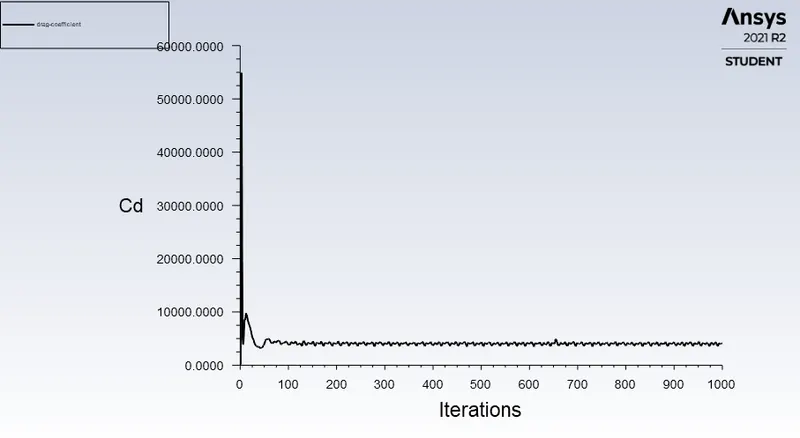
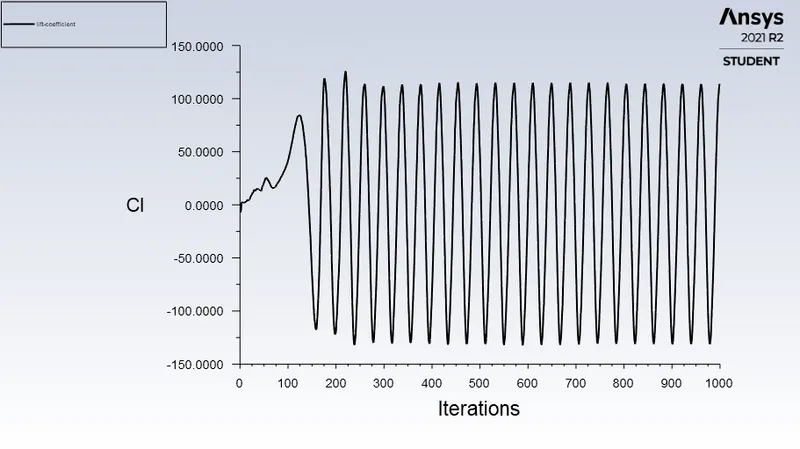
Plot of Drag Coefficient and Lift coefficient
e. Re=100000
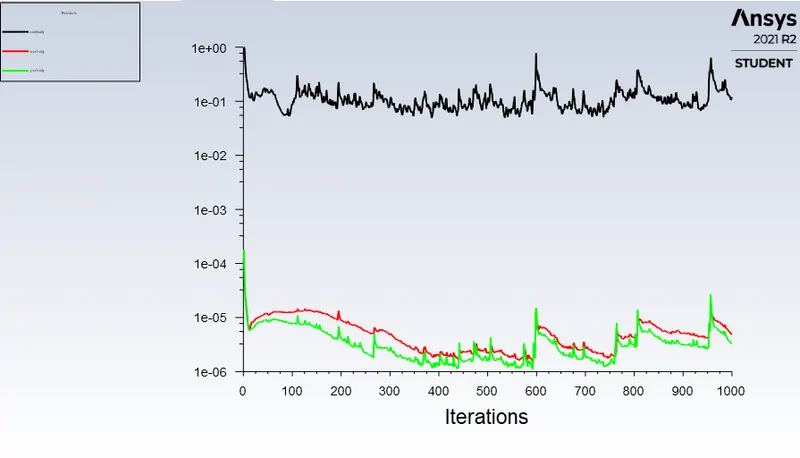
Convergence Plot
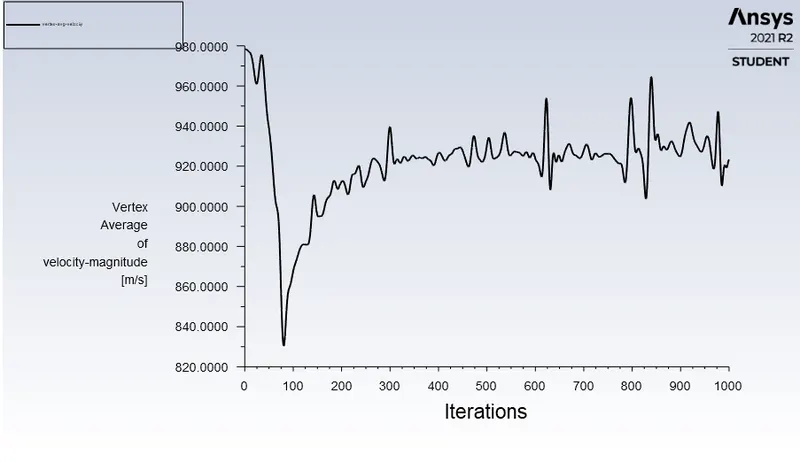
Average Velocity at the vertex (6 m from the center)
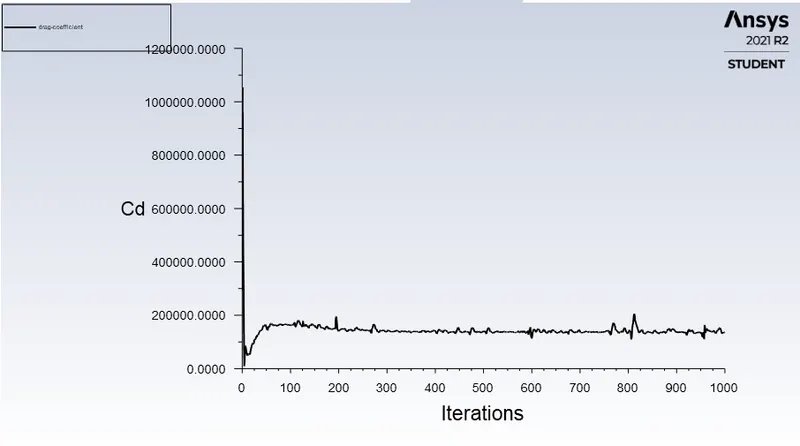
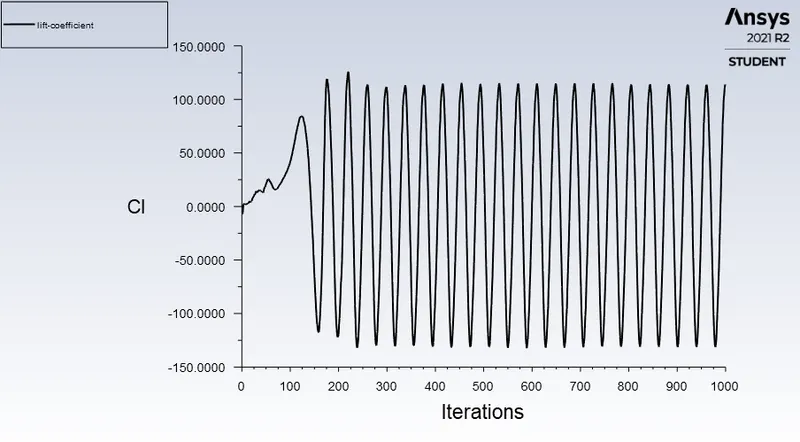
Plot of Drag Coefficient and Lift coefficient
Conclusion
Since the density and the dynamic viscosity of the flowing fluid is constant in this simulation, the Reynolds number of the fluid is changed by changing the fluid velocity.
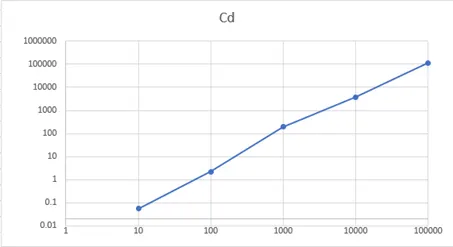
From the below data it can be concluded that Reynolds Number and Coefficient of Drag are linearly proportional to each other.
|
Re |
Cd |
|
10 |
0.054615673 |
|
100 |
2.2409121 |
|
1000 |
189.91486 |
|
10000 |
3812.016 |
|
100000 |
114554.07 |
Log plot for Re vs Cd
Strohaul Number for Unsteady State Flow with Reynolds Number 100 is 0.25.
We know that a flow is laminar if 20 < Re < 2000 and turbulent if Re > 4000.
For Re=10, the flow is laminar. We observed boundary layer separation on the cylinder surface. We found that the flow velocity downstream the cylinder is dropped which induces a pressure drop near the boundary layer close to the rear stagnation point. We found a stable but reduced velocity flow behind the cylinder.
For Re = 100, a wavy flow in the wake of the cylinder is observed. It can be said from Re= 100, we can observe laminar vortex shedding behind the cylinder famously known as von Karman street.
For Re=1000, the flow seems to be a transition zone. We can find an alternative shedding of vortices behind the cylinder.
For Re = 10000, the flow becomes turbulent but in the wake region, we can still find ( with help of the average vertex velocity plot) that the vortex shedding is still periodic with stable oscillating vortices.
For Re = 10^5, the wake region becomes narrow and unstable. Both the flow and the wake are turbulent.
There is a similarity in the flow for Re=10000 and Re=100000 like the wake is narrowed, cylinder experiences a similar amount of lift force, etc. The difference is in the wake region, where for Re=10000 wake is still laminar for Re=100000 wake is turbulent.