Week 2 - Flow over a Cylinder.
FLOW OVER A CYLINDER
AIM : To simulate the flow over a cylinder and explain the phenomenon of Karman vortex street.
PART-I
- To simulate the flow with the steady and unsteady case and calculate the Strouhal Number for Re= 100.
PART-II
- Calculating the coefficient of drag and lift over a cylinder by setting the Reynolds number to 10,100,1000,10000 & 100000. (Running with steady solver)
- To discuss the effect of Reynolds number on the coefficient of drag. [ Results should be validated with any standard literature and error should be within 5 %]
Expected results:-
- In both approaches, the convergent plot has to be shown. That is, what quantities or plots need to be looked at to determine that the flow has converged?
- Plots of the coefficient of drag and lift.
- Plots to show vortex shedding behind the cylinder.
- Mention the referred material (Reference Paper or Fluid Mechanics Textbook) at the end of the challenge submission page.
INTRODUCTION
- When fluid moves over a solid body,it exerts pressure forces normal to the surface and shear forces parallel to the surface of the body.
- Drag force is due to the combined effects of pressure and wall shear forces in the flow direction.
- Lift force is due to the combined effects of pressure and wall shear forces in the normal direction.
`C_d=F_d/(0.5*rho*v^2*A)` and `C_L=F_L/(0.5*rho*v^2*A`
- Cylinders are considered as bluff bodies because at large Reynolds number the drag is dominated by pressure loss in the wake region. As the fluid passes over the cylinder ,it experiences low pressure near the rear part of the body and high pressure at the stagnation point(at frontal part of body).
- As long as the pressure gradient is there ,there is no flow separation from the surface of cylinder. But as the fluid strikes the surface there is high pressure at the surface. Then fluid moves through the surface to the upper part of cylinder and it experience an adverse pressure gradient. So due to this the shear layer detaches from the surface.
- As the fluid pressure increase ,the potential energy of fluid increases and leading to decrease kinetic energy and fluid decelerates.The fluid may slow to zero velocity or even become reversed causing a flow separation.
- Due to flow separation, the pressure distribution modifies along the surface and hence the drag force.
- As the velocity of fluid increase (Reynolds number increase), the wake formed behind the cylinder is narrower and produces swirling motion of fluid due to vorticity and results in vortex motion which sucks the fluid particles as the pressure is lower at the center of vortex .
- The vortex created rear of the body osillates from top and bottom surface of cylinder. The shear layer from top surface has vorticity and vortex is formed as long as the shear layer from bottom surface interacts with the vortex and the vortex is shed off and next vortex is formed from lower shear layer. This process repeats itself at some specific Reynolds number.This phenomenon is termed as Von Karman vortex street.
- The engineering problems include tall buildings provided with helical structures at top of buuilding to reduce vortex shedding.
- The diameter also decreases from bottom to top of building so as to decrease the vibration and frequency .
MODELLING APPROACH
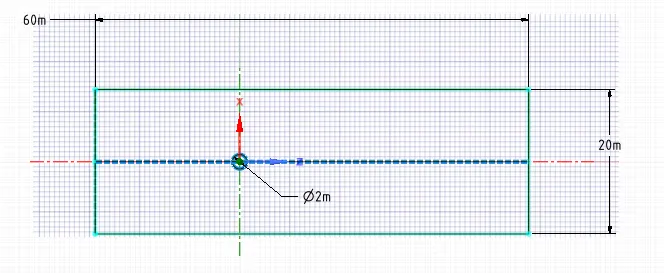
Fig. 1 Geometry preparation
- The diension of geometry is shown i.e, length is twice the width and dia. of cylinders is 2m.It is prepared in space claim .For generating surface we need to select the PULL comand and then select the face.After that we have to navigate to Structure<curve to delete the construction lines.
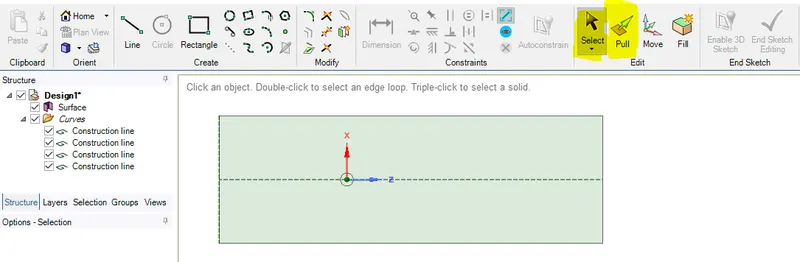
Fig. 2 surface preparation
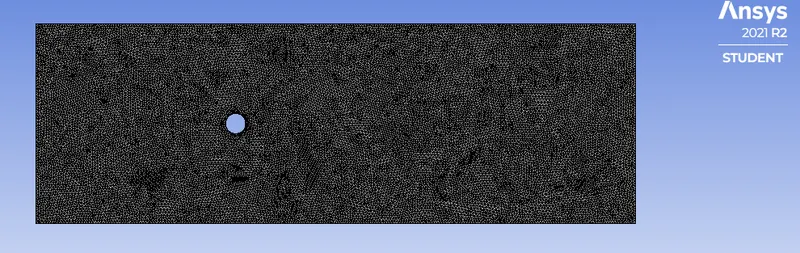
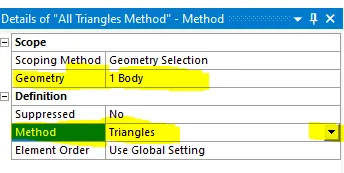
Fig. 3 triangular mesh having mesh size of 0.25m
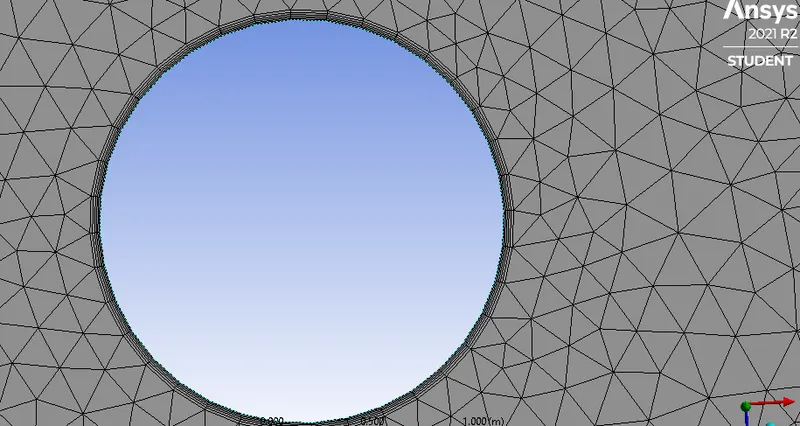
Fig. 4 Inflation layer near the circular region in order to capture the flow behaviour more accurately.
- Here the number of inflation layer is taken as 9. First of all select the surface under geometry section and then click apply.
- After that for boundary selection,select the edge of the circle.Then take the First layer thickness and 0.005 as the first layer height.
- Inflation layer helps in accurate resolution of boundary layer for achieving the desired observation.
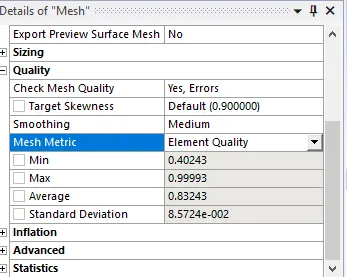
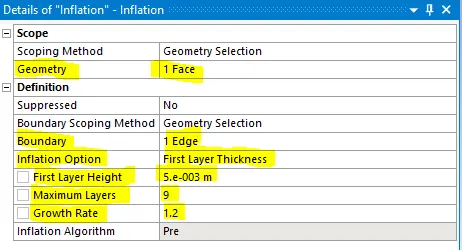
Fig. 5 Details of Mesh and Inflation layer
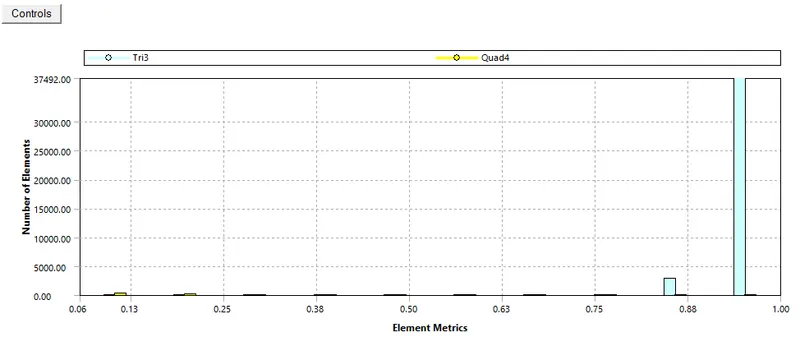
Fig. 6 Element quality of Mesh
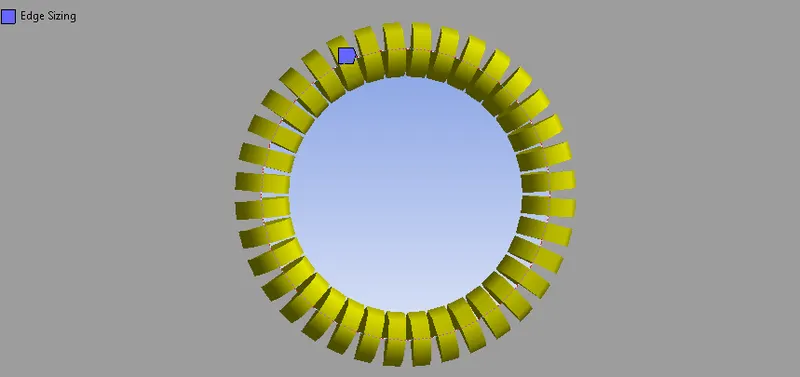
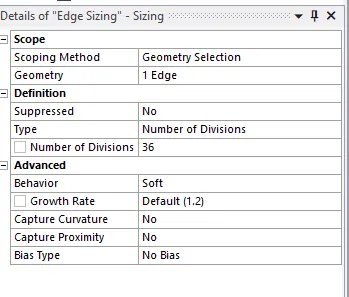
Fig. 7 Edge Sizing
- The circumference of the circle needs to be refined so as to get accurate results near the wall.For this edge sizing is done and the circumference is divided into small number of parts.Here it is taken as 36.
Preprocessor and Solver setting
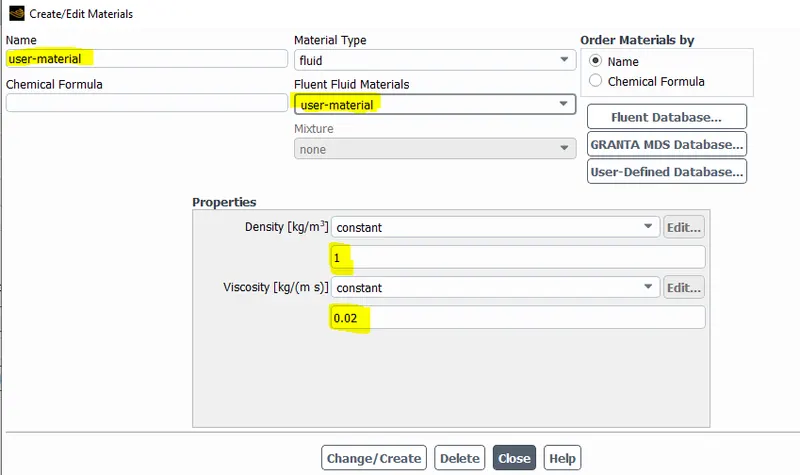
Fig. 8 Material selection
- From the fluent database we need to select air as the material and then copy air and rename as user material (customised material).
- Then go to PHYSICS<CELL ZONES< change the material as user material.
- Take the density and dynmanic viscosity as 1(kg/m^3) and 0.02(kg/m s).
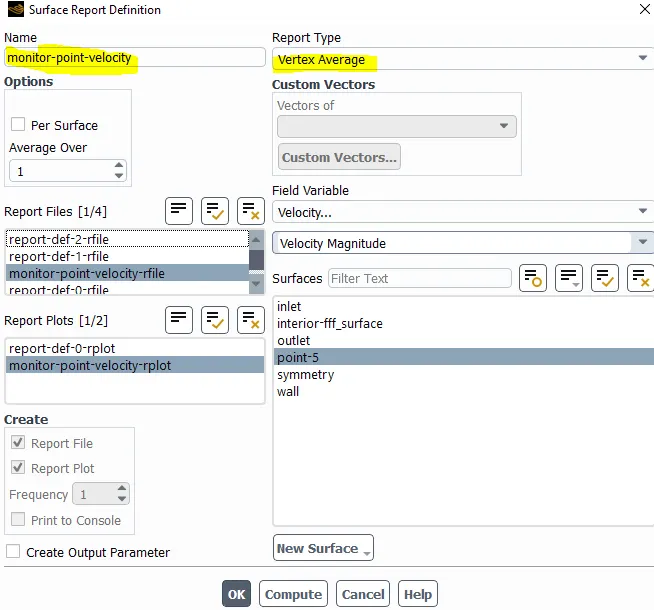
Fig. 9 surface report defination(monitor point velocity to capture vortex behind the cylinder)
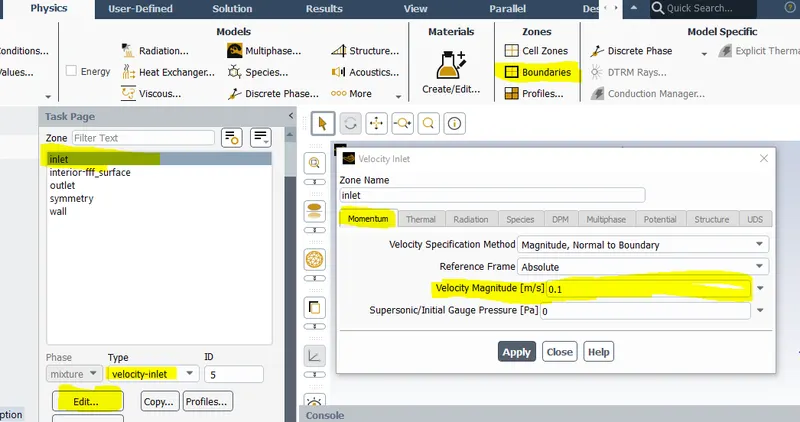
Fig. 10 Velocity input
- The velocity of fluid at inlet is varied according to the Reynolds number as the density and viscosity is set constant.
- For Reynolds number from 10 to 10^5 as given in the statement, the velocity is being calculated from Reynolds number formula
`R=(rho*Velo*dia)/(mu)` it is also defined as inertial force upon viscous force.
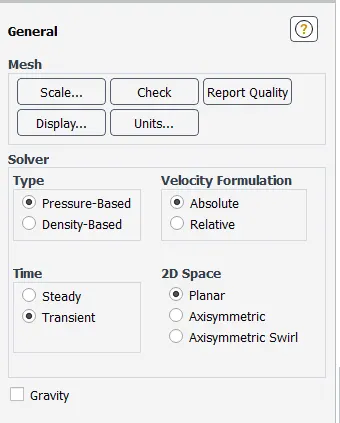
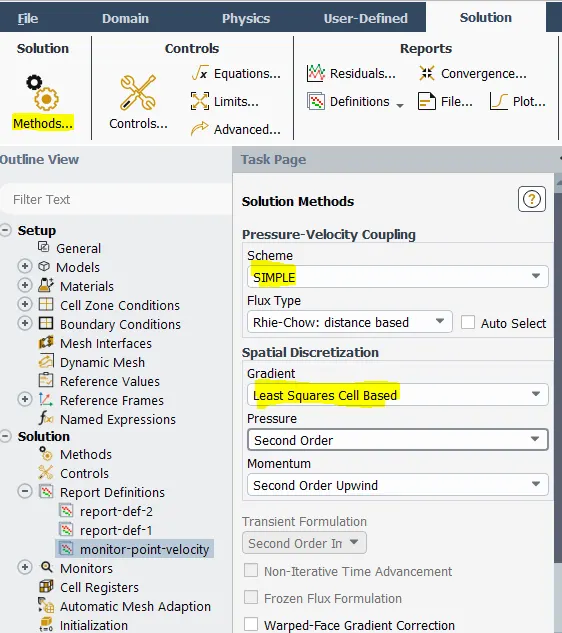
Fig. 11 Solver setting for Transient state analysis
- Here in the solution section , the solution method scheme for Pressure-velocity scheme is SIMPLE ( Semi-Implicit Method for Pressure linked equation) and pressure based solver with absolute velocity formulation.
RESULT PART -I
steady solver with Reynolds number=100 ,velocity=1 (m/s)
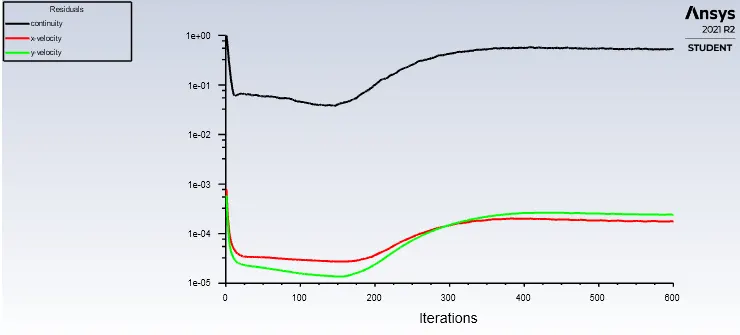
Fig. 12 Residual vs iteration (steady solver with Reynolds number 100)
- From residual plot the steady state approach is converged after 500 and 550 iterations.( continuity and velocity residuals are showing straight lines)
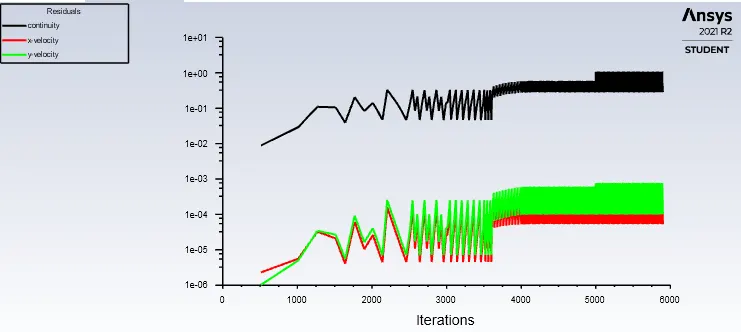
Fig. 13 Residual vs iteration (unsteady solver with Reynolds number 100)
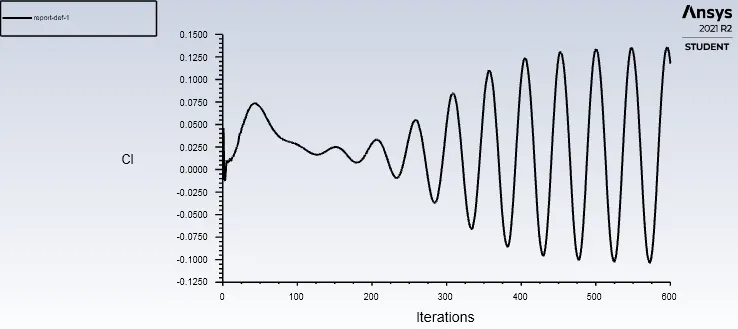
Fig. 14 Lift coefficient vs iterations (steady solver with Reynolds number 100)
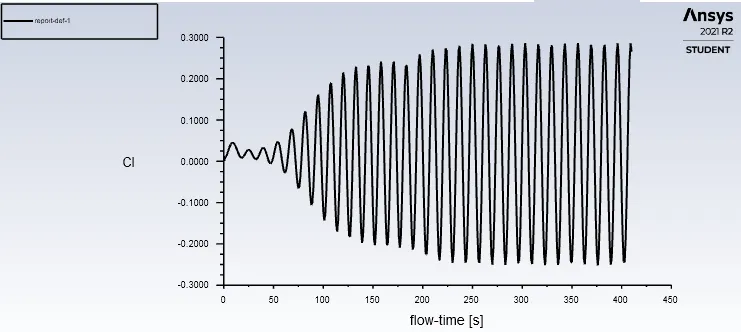
Fig. 15 lift coefficient vs flow-time(unsteady solver with Reynolds number 100)
- From the above figure the lift coefficient values show similar trend fashion after 300 flow time ( converged).
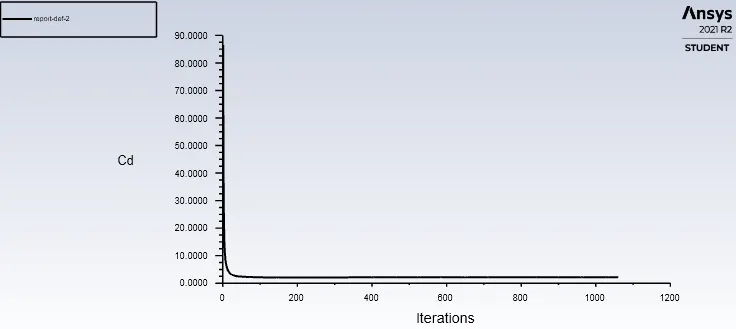
Fig. 16 drag coefficient vs iteration (steady solver with Reynolds number 100)
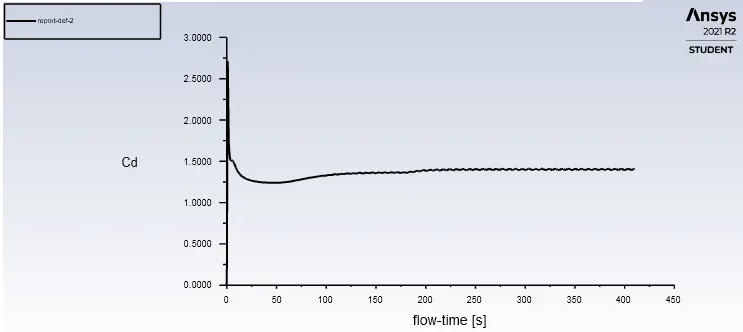
Fig. 17 drag coefficient vs flow time (unsteady solver with Reynolds number 100)
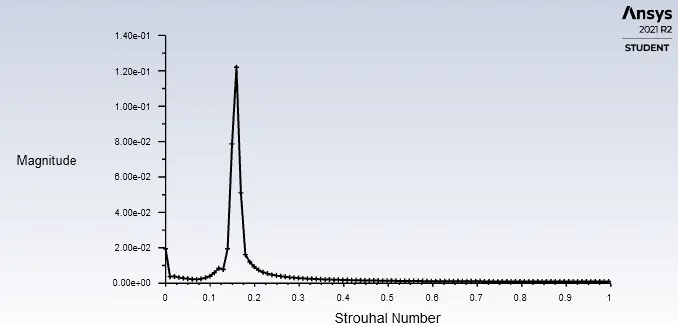
Fig. 18
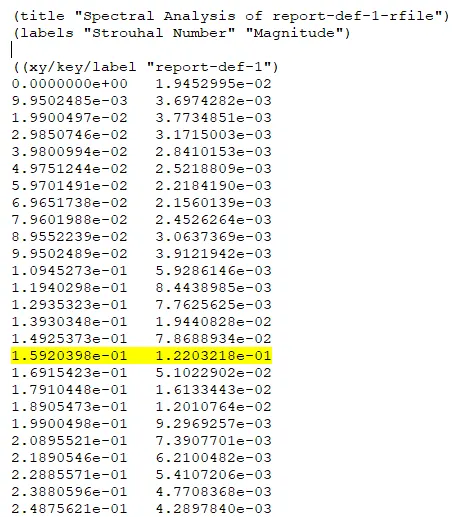
Fig. 19 The Strouhal number is 0.159 corresponds to the magnitude 0.122031
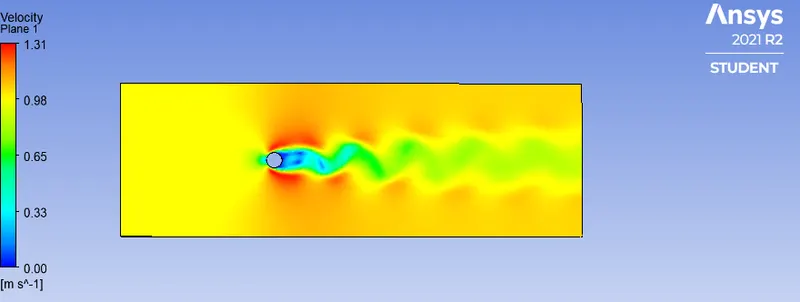
Fig. 20 Vortex shedding ( steady solver at Reynolds number 100)
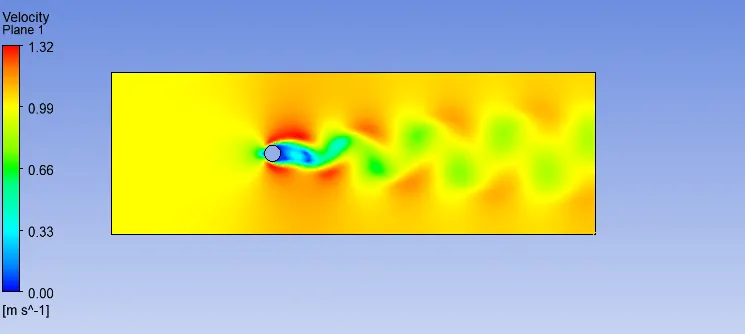
Fig. 21 Vortex shedding ( unsteady solver at Reynolds number 100)
RESULT PART -II
STEADY STATE SOLVER
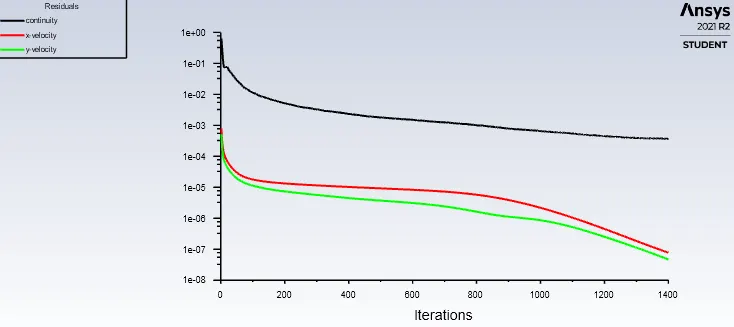
Fig.22 Residual vs iterations (Reynolds number 10)
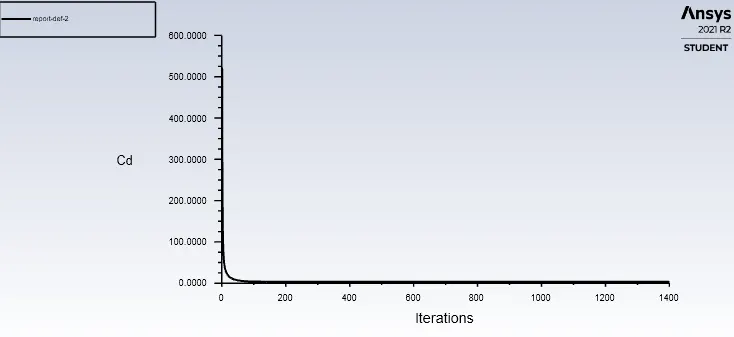
Fig.23 Drag coefficient vs iterations (Reynolds number 10)
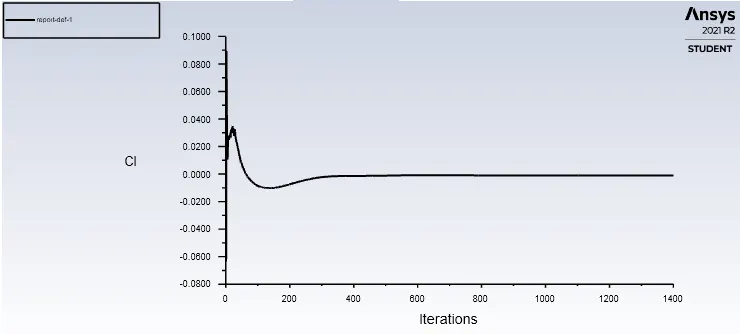
Fig.24 Lift coefficient vs iterations (Reynolds number 10)
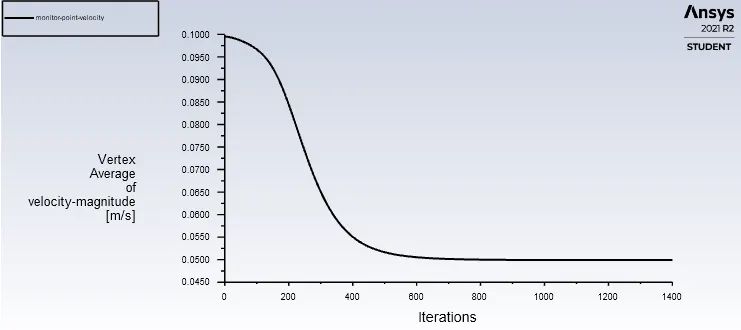
Fig.25 vertex average of velocity magnitude vs iterations (Reynolds number 10)
Fig.26 Residual vs iterations (Reynolds number 100)
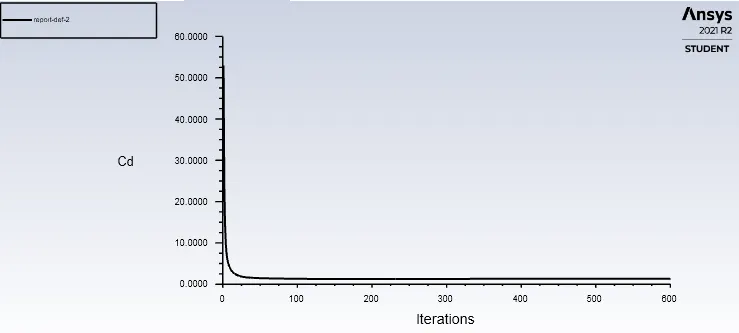
Fig.27 Drag coefficient vs iterations (Reynolds number 100)
Fig.28 Lift coefficient vs iterations (Reynolds number 100)
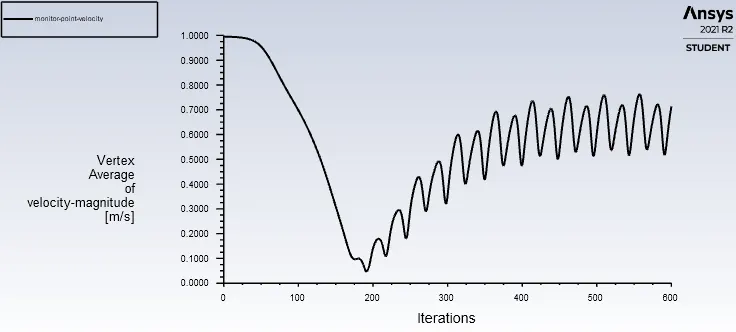
Fig.29 vertex average of velocity magnitude vs iterations (Reynolds number 100)
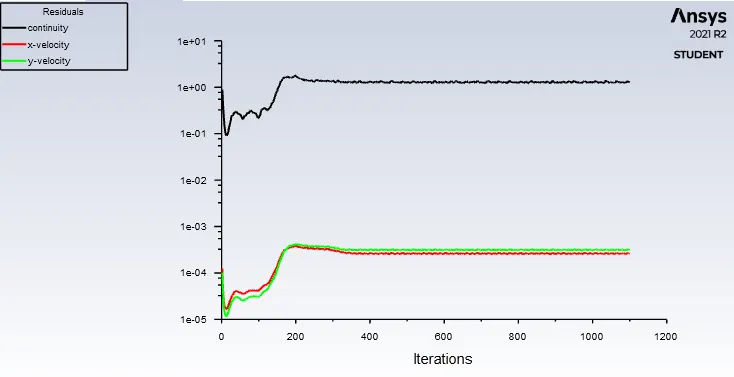
Fig.30 Residual vs iterations (Reynolds number 1000)
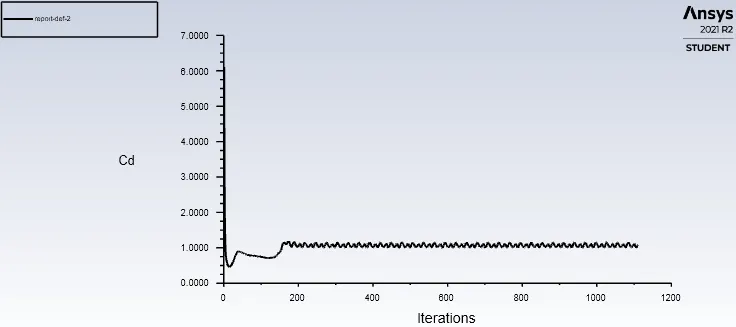
Fig.31 Drag coefficient vs iterations (Reynolds number 1000)
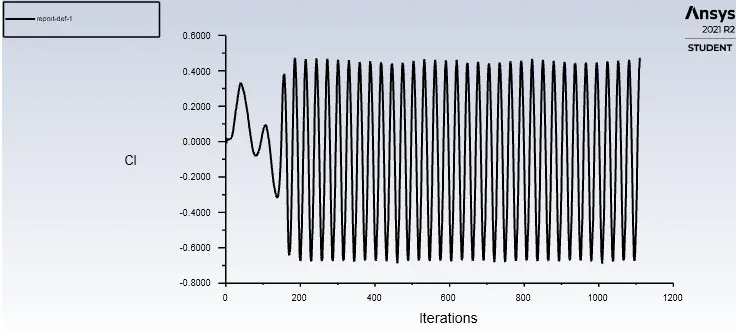
Fig.32 Lift coefficient vs iterations (Reynolds number 1000)
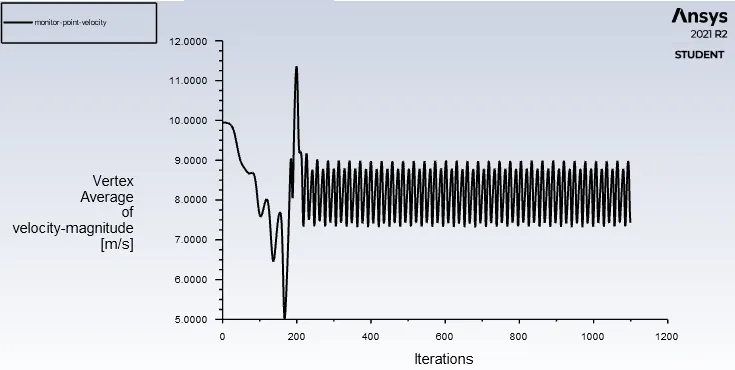
Fig.33 vertex average of velocity magnitude vs iterations (Reynolds number 1000)
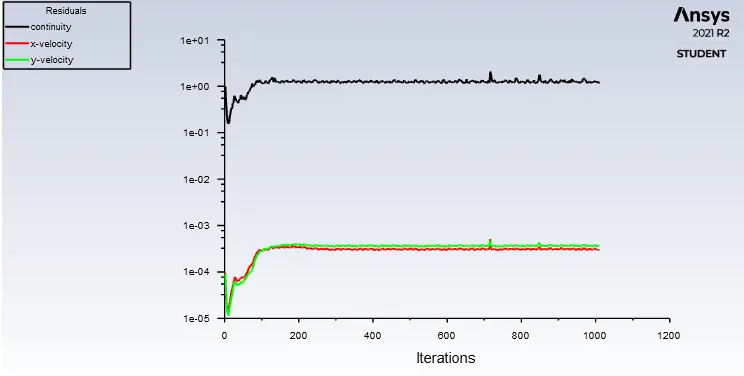
Fig.34 Residual vs iterations (Reynolds number 10000)
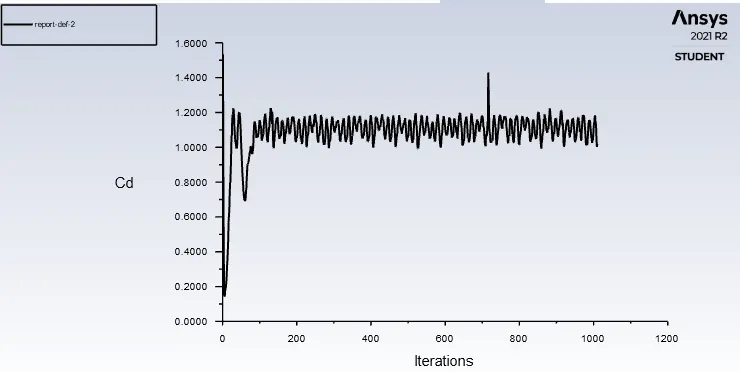
Fig.35 Drag coefficient vs iterations (Reynolds number 10000)
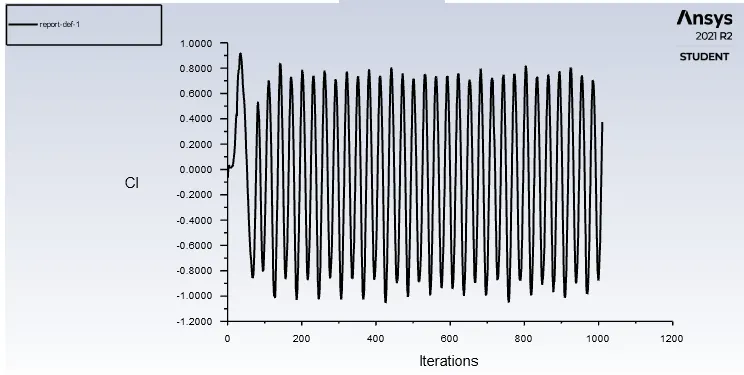
Fig.36 Lift coefficient vs iterations (Reynolds number 10000)
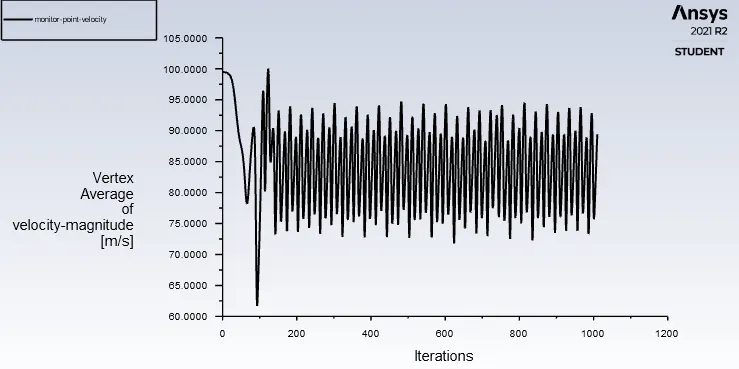
Fig.37 vertex average of velocity magnitude vs iterations (Reynolds number 10000)
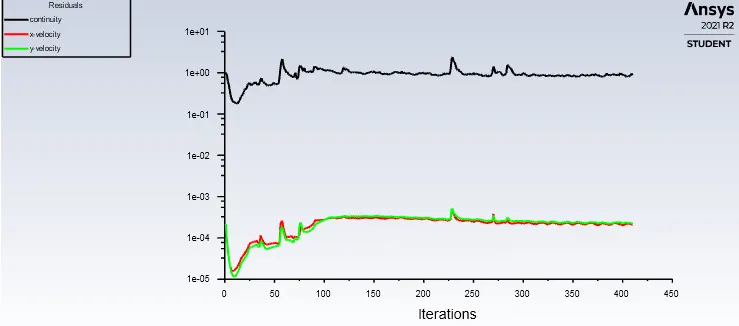
Fig38. Residual vs iterations (Reynolds number 100000)
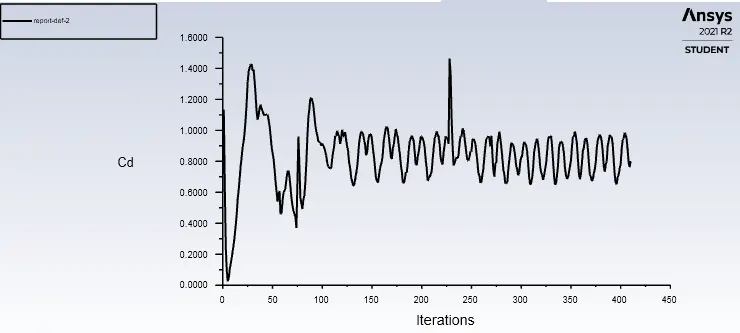
Fig.39 Drag coefficient vs iterations (Reynolds number 10000)
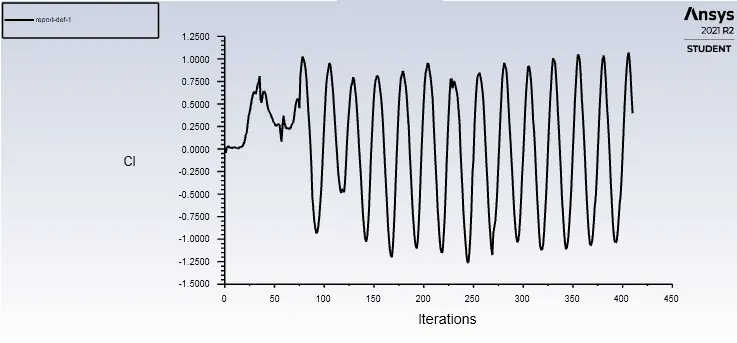
Fig.40 Lift coefficient vs iterations (Reynolds number 10000)
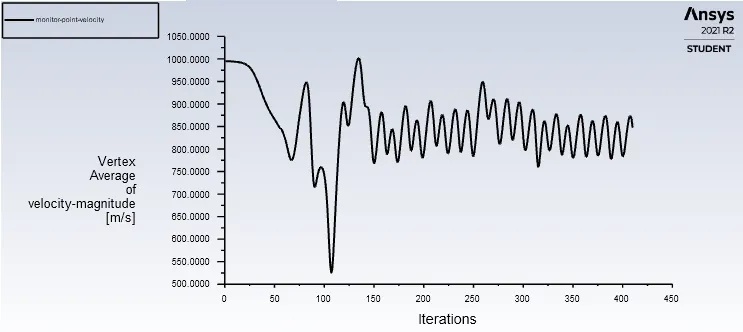
Fig.41 vertex average of velocity magnitude vs iterations (Reynolds number 100000)
Vortex Shedding Plot
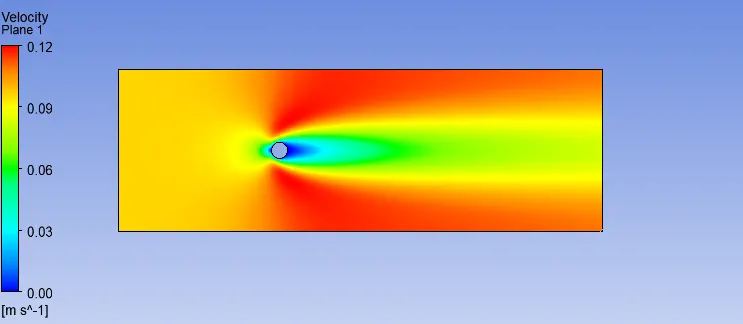
Fig.42 Vortex Shedding Plot (Reynolds number 10)
Fig.43 Vortex Shedding Plot ( Reynolds number 100)
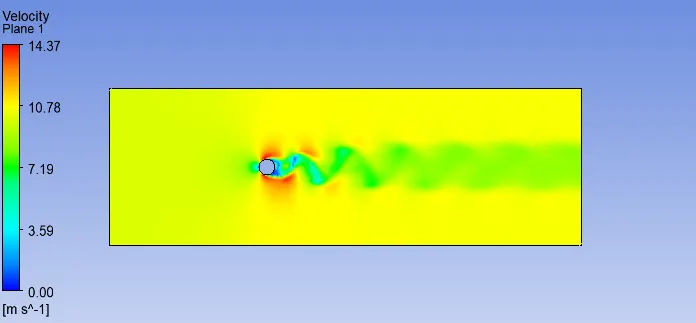
Fig.44 Vortex Shedding Plot (Reynolds number 1000)
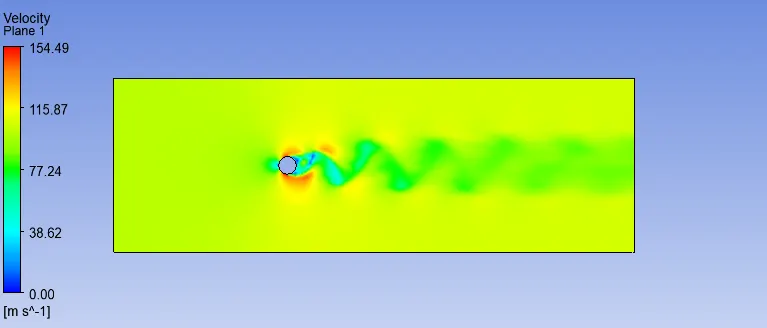
Fig.45 Vortex Shedding Plot ( Reynolds number 10000)
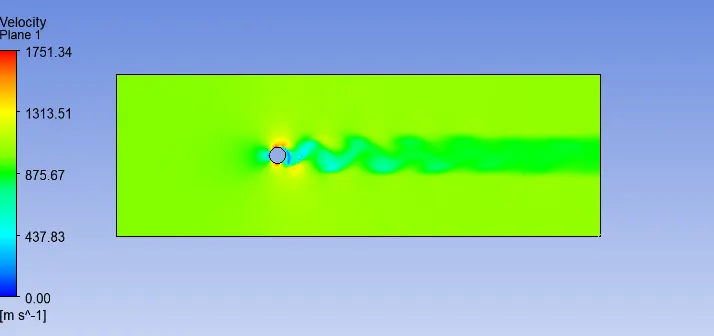
Fig.46 Vortex Shedding Plot ( Reynolds number 100000)
Effects of Reynolds number on drag coefficient
| Reynolds number | drag-coefficient | lift-coefficient | velocity(m/s) |
| 10 | 3.324 | 0.000983 | 0.1 |
| 100 | 1.329 | 0.1175 | 1 |
| 100(unsteady) | 1.359 | 0.1449 | 1 |
| 1000 | 1.0857 | 0.473 | 10 |
| 10,000 | 1.184 | 0.374 | 100 |
| 1,00,000 | 0.8011 | 0.395 | 1000 |
- At Reynolds number of 10 ,separation starts occuring on the rear of the body and a larger wake is found. Here we can see that ,there is no vortex shedding taking place. As this is fully laminar dominated regime, the flow separates in downstream and wake is formed by eddies (symmetric), the eddies grow upto to Reynolds number of 40.
- At Reynolds number above 40, the oscillation in wake region results in asymmetric eddies.
- Actually the sheared layers having vorticity from top and bottom surface interact with each other and for the vortex formation and its shedding.
- At Reynolds number 90,the eddies created due to vorticity of sheared layers are shed alternatelyi.e, oscillating from top and bottom surface of cylinder.
- In the range of `10^3<Re<`10^5`,the drag coefficient is relatively constant. The flow in the boundary layer is laminar and the flow past the cylinder is highly turbulent and the wake is wide.
- The region of separation increases with with increasing Reynolds number upto `10^3` also the drag component continues to decrease with increase of Reynolds number.
- In the range of `10^5<Re<`10^6`,the drag coefficient decreases at a faster rate as the boundary layer becoming turbulent,which moves the separation point further on the rear side of the body.
- `he results are being validated with the data prescribed in Cengel textbook as well as from research papers.
REFERENCES
- Wikipedia
- Fluid Mechanics Textbok -Cengel
- Rajani ,B.N, Kandasamy,A.,Majumdar,S.'Numerical simulation of laminar flow past a circular cylinder',Applied matheatical Modelling,'2008'.