Week 2 - Flow over a Cylinder.
Aim: To simulate the flow over a cylinder and explain the phenomenon of Karman vortex street.
Conditions:
i)To calculate the strouhal number @ reynolds number, Re=100 , in steady and unsteady case.
ii)To calculate the coefficient of drag and lift over a cylinder by setting the Reynolds number to 10,100,1000,10000 & 100000 using steady solver.
iii)To discuss the effect of Reynolds number on the coefficient of drag
Solution:
Strouhal Number: It is a dimensionless number describing oscillating flow mechanisms.
Reynolds number: A dimensionless number used in fluid mechanics to indicate whether fluid flow past a body or in a duct is steady or turbulent.
CASE-1
Strouhal number for the Steady case having conditions
density = 1
viscosity= 0.05
velocity= 1
Diameter of the cylinder = 5 m
strouhal number = 0.5 (max) @ magnitude= 0.0000071547565
Strouhal number for the Unsteady case having conditions
density = 1
viscosity= 0.05
velocity= 1
Diameter of the cylinder = 5 m
Strouhal number = 0.5(max) @ magnitude= 0.00023033109
CASE-2
Coefficient of Lift and drag for given reynolds number
| S.no | Reynolds number | Lift coefficient | Drag coefficient | Lift/Drag Ratio |
| A | 10 | 0.00027945299 | 0.18142748 | 1.5403x10^-3 |
| B | 100 | 0.10623703 | 6.2688864 | 0.01694 |
| C | 1000 | 24.302005 | 545.71896 | 0.044532 |
| D | 10000 | 58431.369 | 21443.52 | 0.36698 |
| E | 100000 | 1993156.5 | 3279770.9 | 0.60771 |
Plots for the given reynolds number
Plots for Lift coefficient
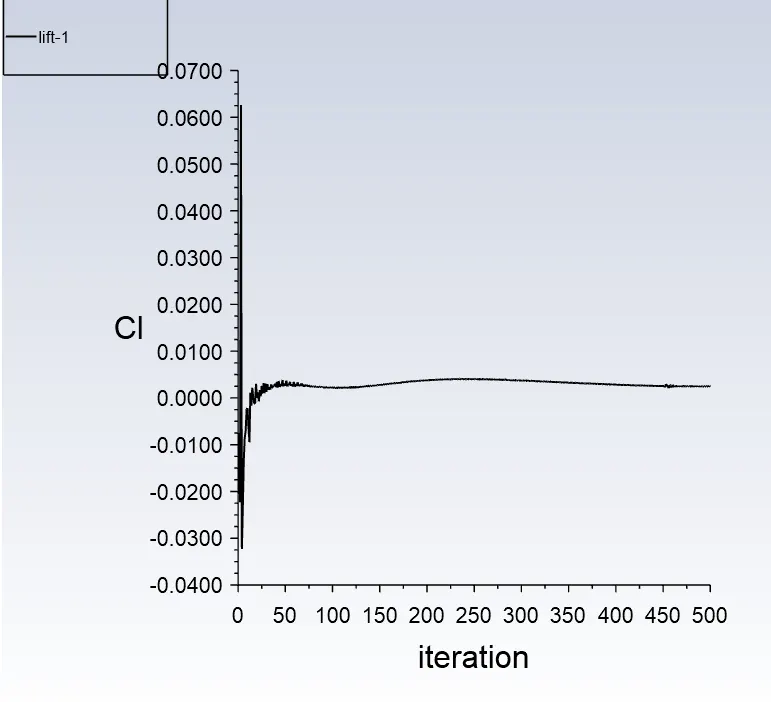 lift coefficient graph for reynolds number Re=10
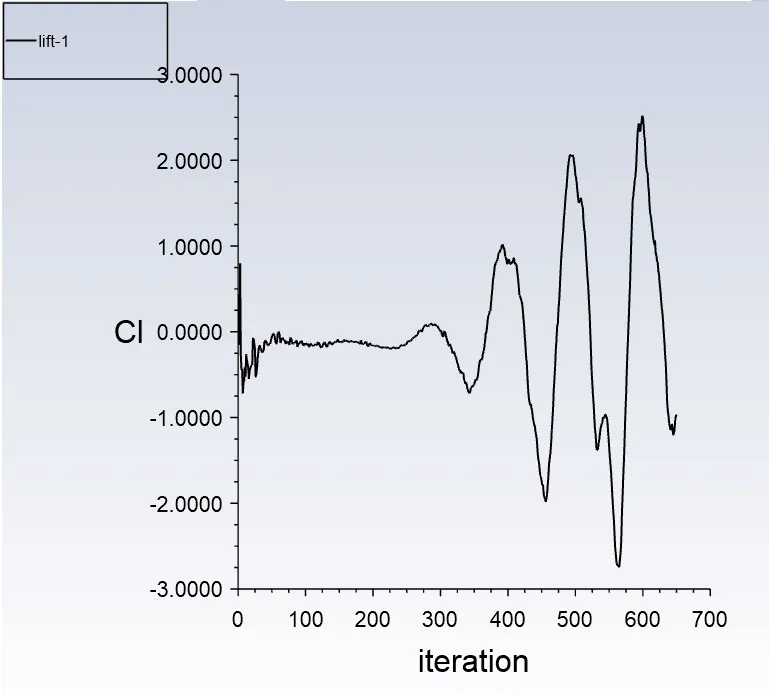 lift coefficient graph for reynold number Re=100
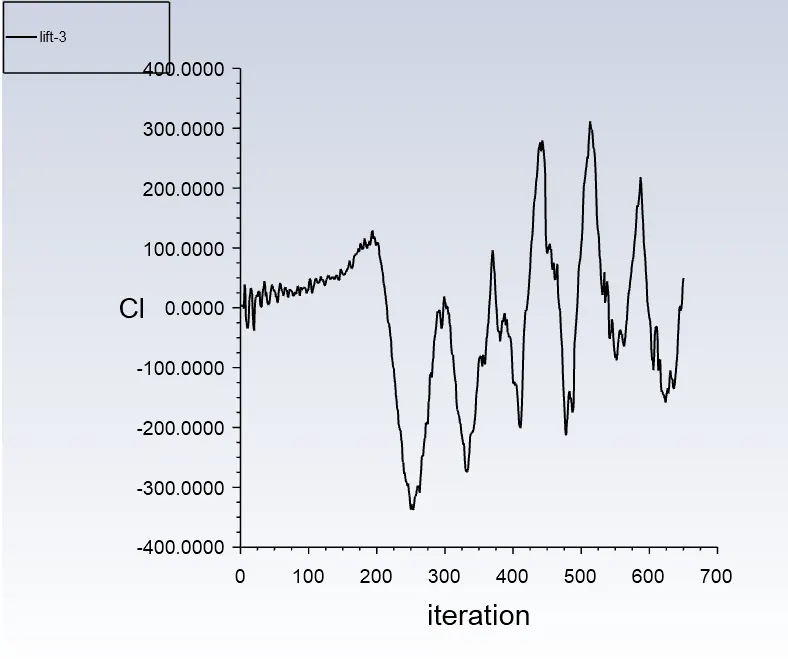 lift coefficient graph for reynolds number Re=1000
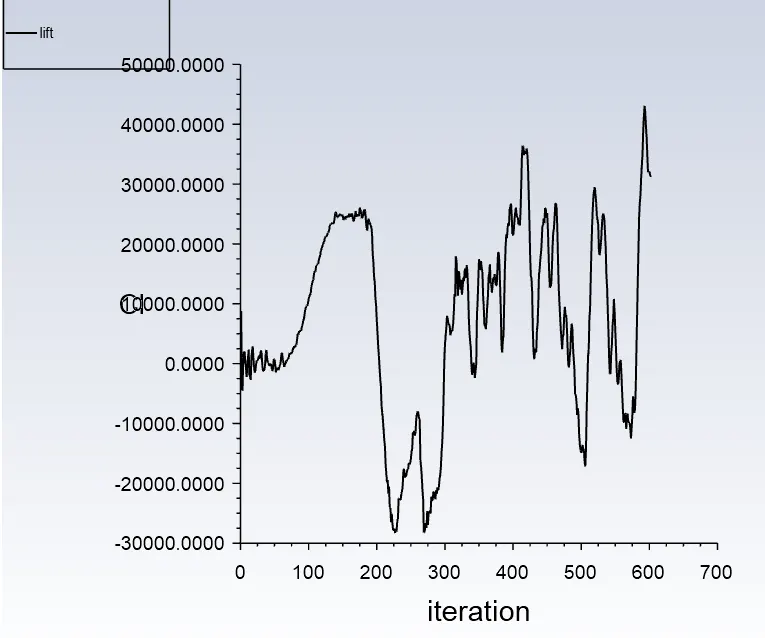 lift coefficient graph for reynolds number Re=10000
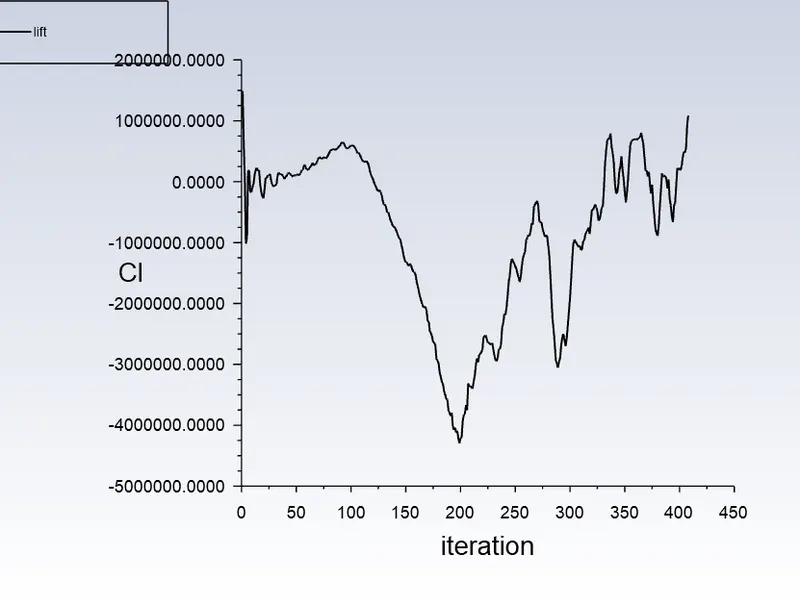 lift coefficient graph for reynolds number Re=100000
Plots for Drag coefficient
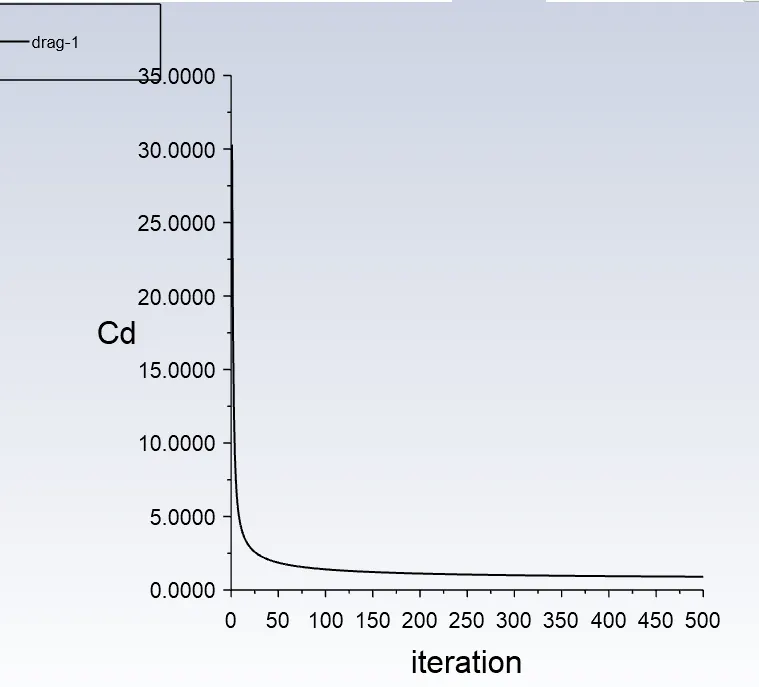 Drag coefficient graph for reynolds number Re=10
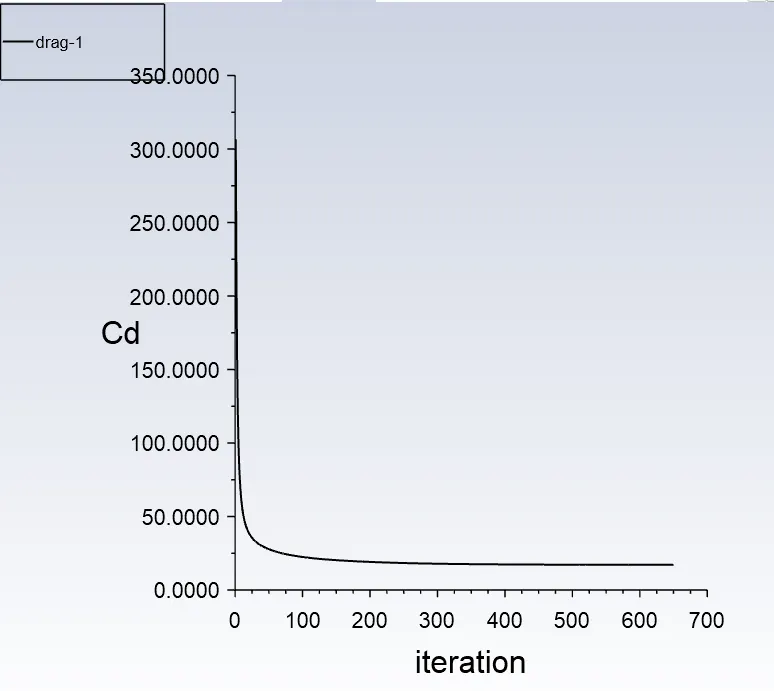 Drag coefficient graph for reynolds number Re=100
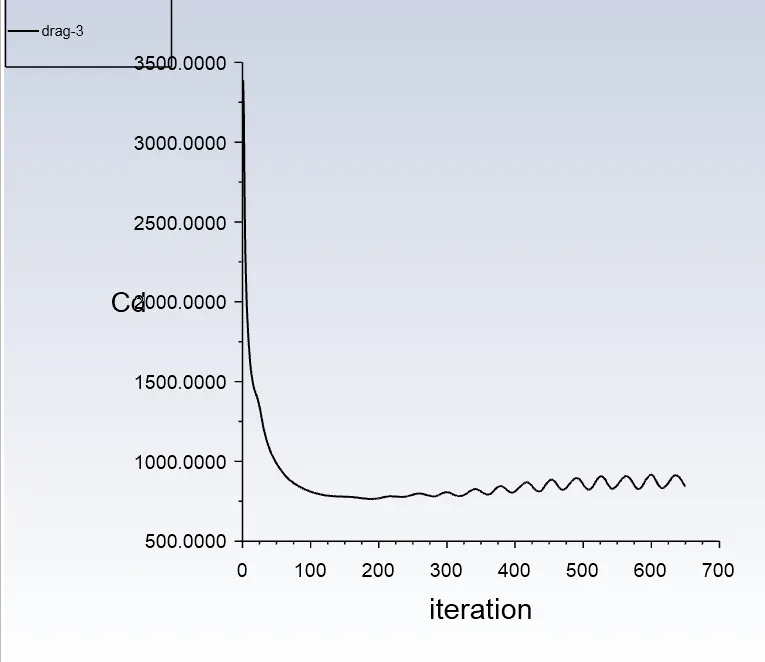 Drag coefficient graph for reynolds number Re=1000
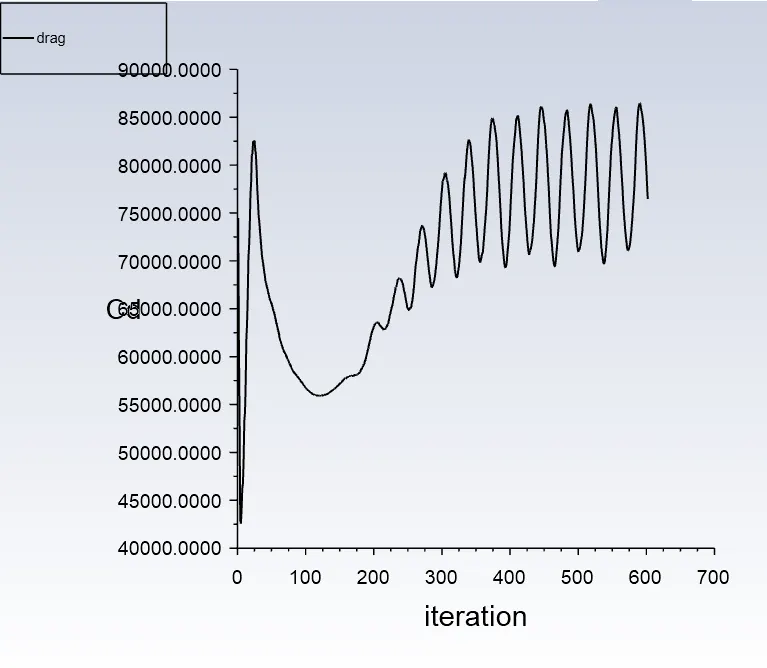 Drag coefficient graph for reynolds number Re=10000
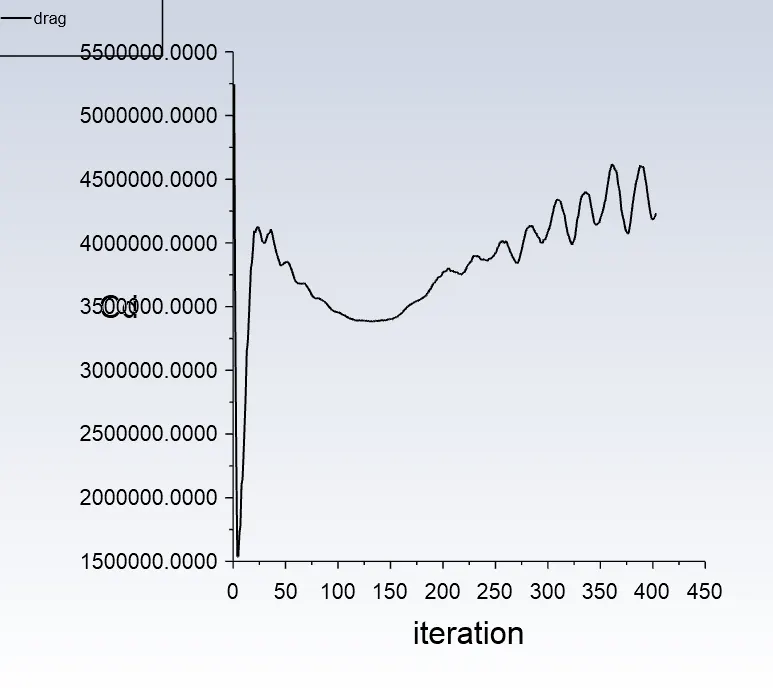 Drag coefficient graph for reynolds number Re=100000
Plots of Vertex average of Velocity
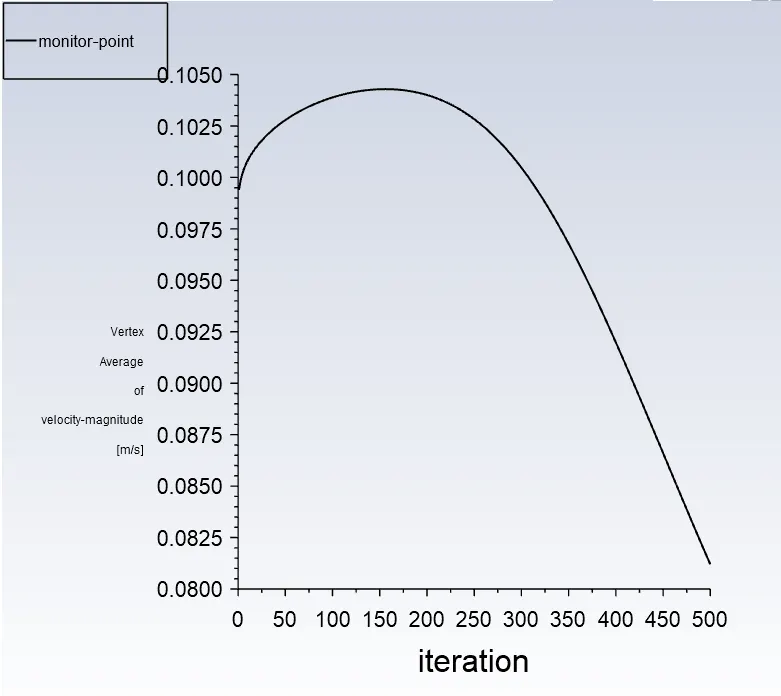 Vertex average of Velocity graph for reynolds number Re=10
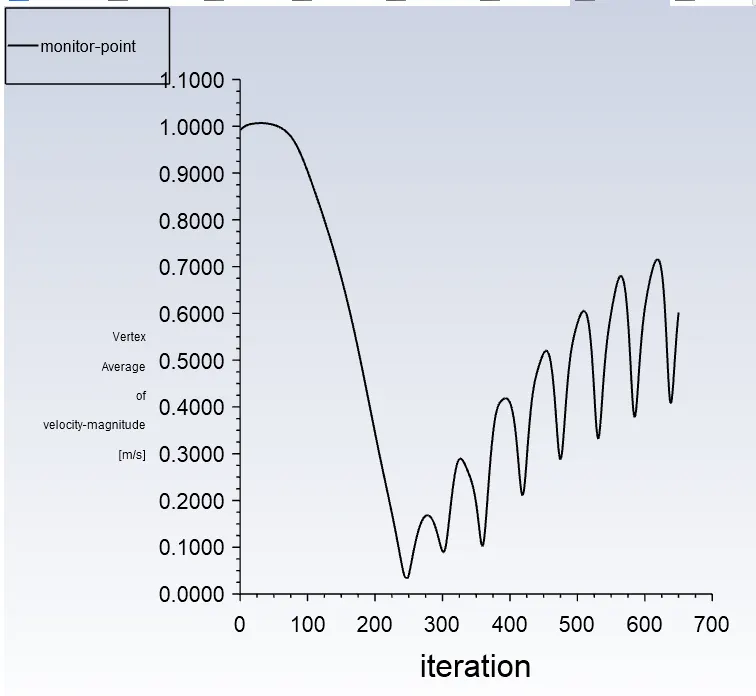 Vertex average of Velocity graph for reynolds number Re=100
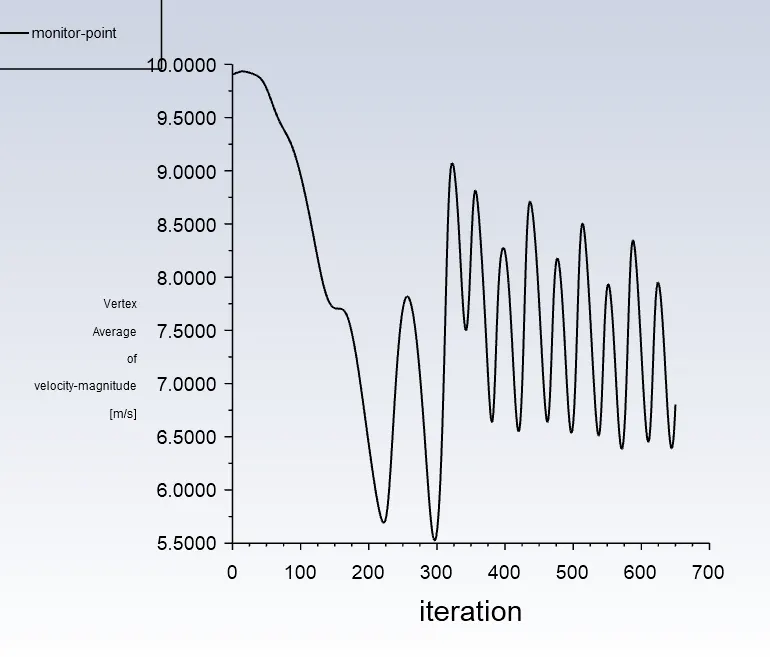 Vertex average of Velocity graph for reynolds number Re=1000
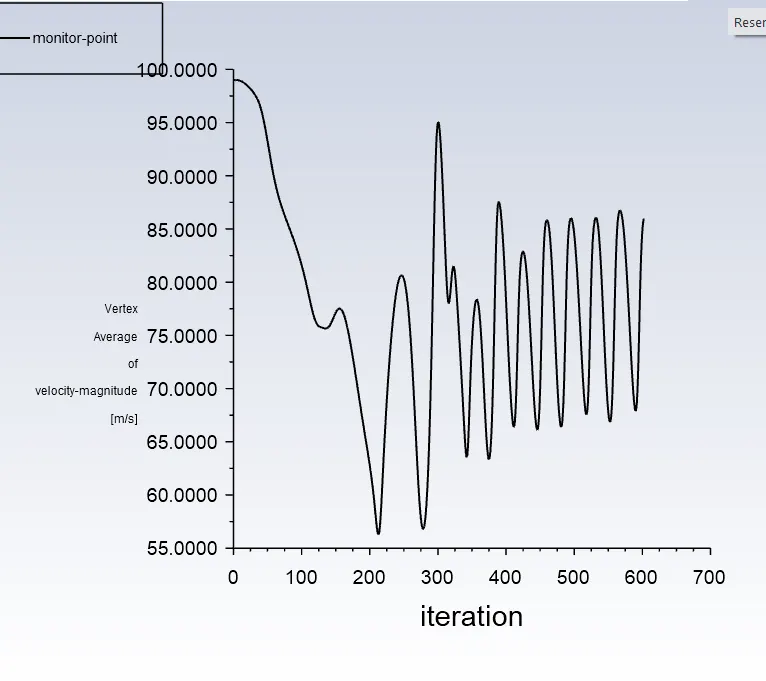 Vertex average of Velocity graph for reynolds number Re=10000
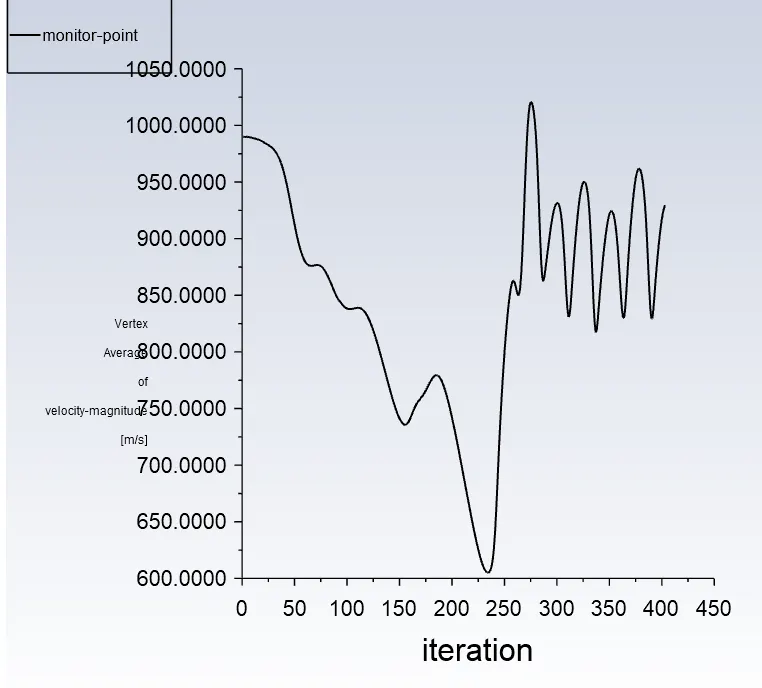 Vertex average of Velocity graph for reynolds number Re=100000
Contours
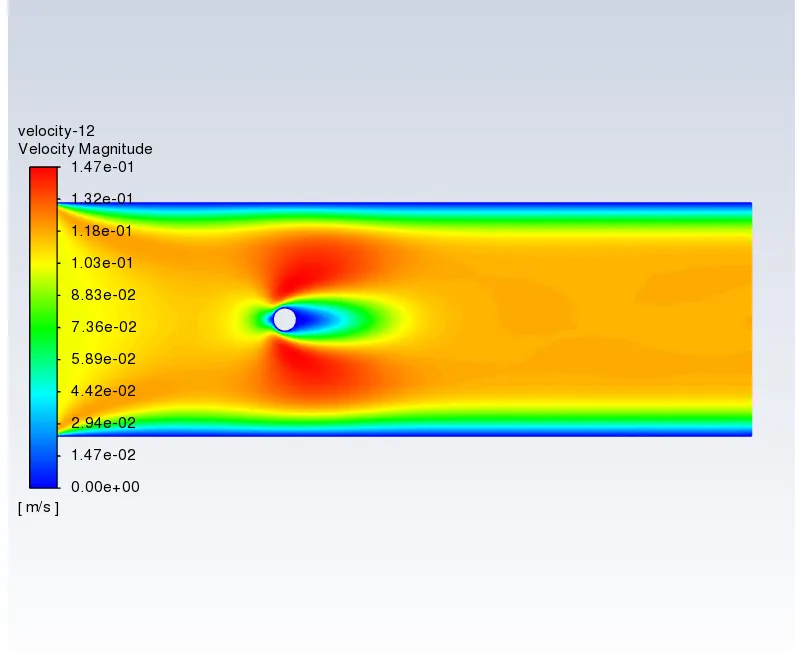 Contour for reynolds number Re=10
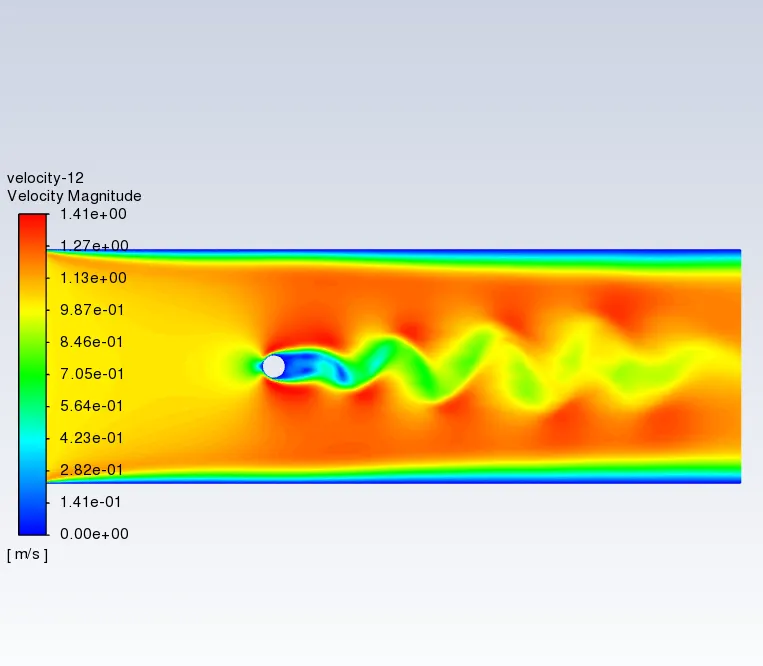 Contour for reynolds number Re=100
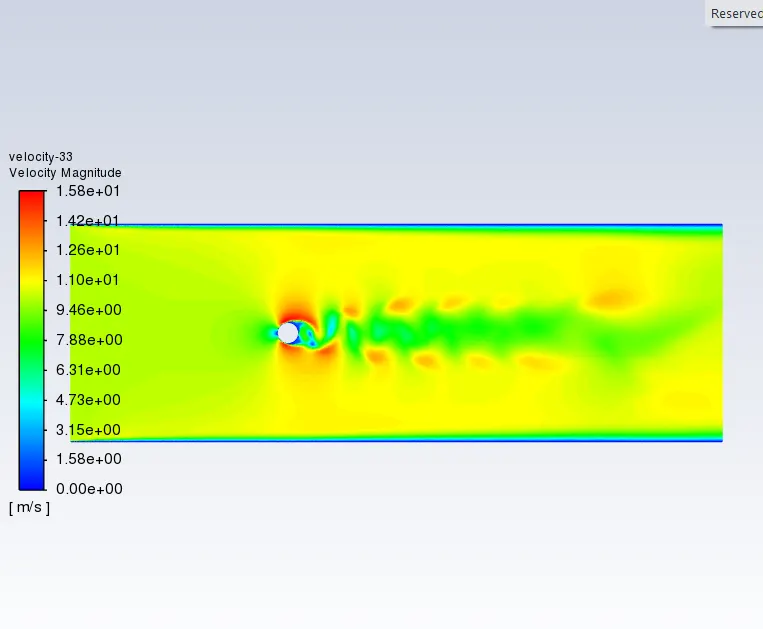 Contour for reynolds number Re=1000
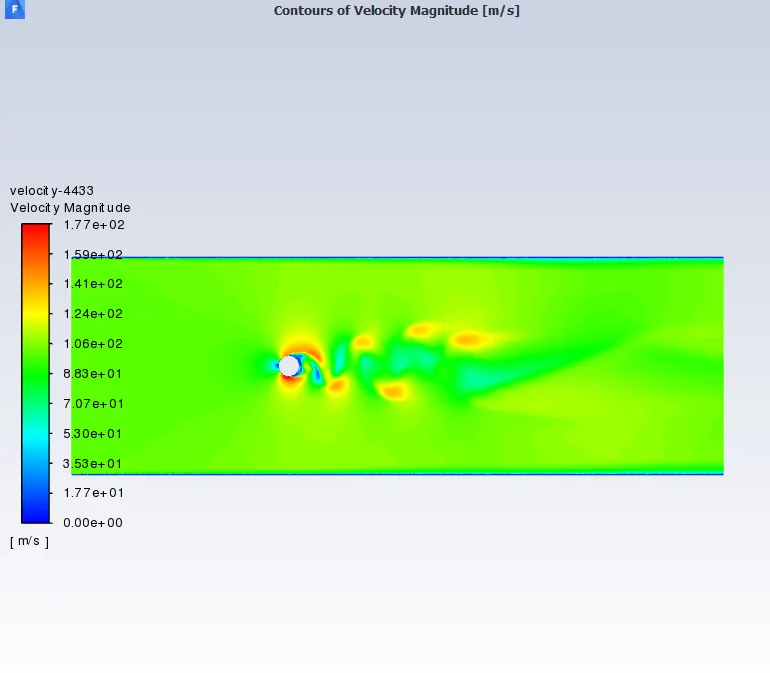 Contour for reynolds number Re=10000
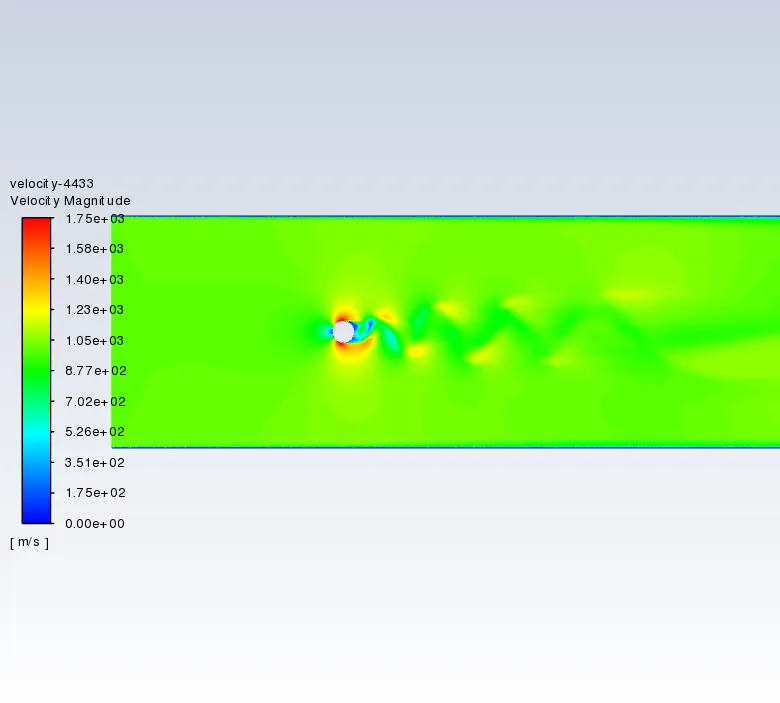 Contour for reynolds number Re=100000
Results and conclusions:
- as the reynolds number, increases the Lift/Drag ratio increases gradually.
- Drag also increases as the reynolds number is increasing.
- vortex shedding begins to happen when the reynolds number of the fluid hits 100
References:
- Hurst, E., Yang, Q., & Chung, Y. (2014). The effect of Reynolds number on turbulent drag reduction by streamwise travelling waves. Journal of Fluid Mechanics, 759, 28-55. doi:10.1017/jfm.2014.524
- B.N. Rajani, A. Kandasamy, Sekhar Majumdar,Numerical simulation of laminar flow past a circular cylinder,Applied Mathematical Modelling,Volume 33, Issue 3,2009.