Week 1- Mixing Tee
Aim: to perform steady state fluent analysis on a mixing tee pipe using the conditions given.
Conditions given:
- two mixing tees of different lenghts
- different temperatures at both inlets, 19 celsius @ cold inlet and 36 celsius @ hot inlet
- velocity of fluid @ inlet is fixed at 3m/s, velocity of fluid @ cold inlet is varied by virtue of momentum ratio
- momentum ratio is the ratio of velocity of fluid at cold inlet divided by velocity at hot inlet
- momentum ratios are 2 and 4
Modelling:
- the mixing tee CAD model is constructed using design modeler function of the ANSYS workbench
- fluid domain of the model is prepared by using 'prepare' function in the space claim function of ANSYS workbench
Pre processing:
- here, using the momentum ratio formula, the velocity of fluid at cold inlet for 2 different cases is calculated as
| Case | Momentum ratio | velocity @ hot inlet | velocity @ cold inlet |
| 1 | 2 | 3 | 6 |
| 2 | 4 | 3 | 12 |
| 3 | 2 | 3 | 6 |
| 4 | 4 | 3 | 12 |
Case 1:
- Uses K-epsilon, realizable fluid properties
- Energy equations are on
- working fluid is air
-
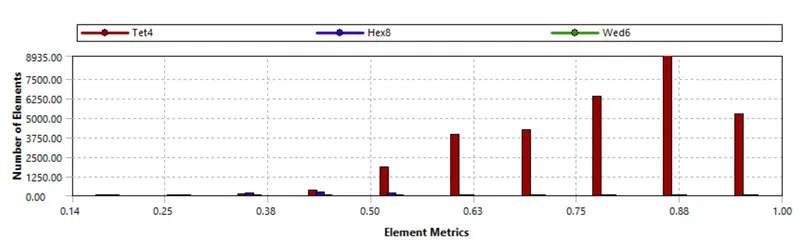
- the mesh quality of the model is not less than 5%
Case 2:
- Uses K-omega, SST fluid properties
- Energy equations are on
- working fluid is air
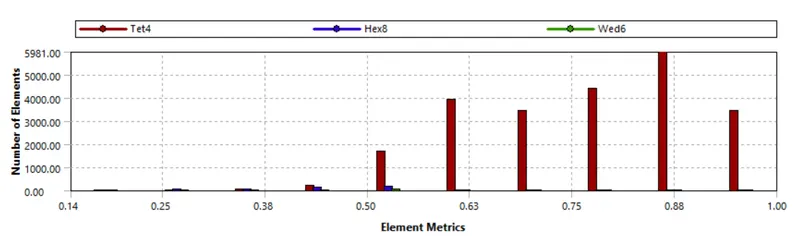
- the mesh quality is not less than 5%
Case 3:
- Uses K-epsilon, realizable fluid properties
- Energy equations are on
- working fluid is air
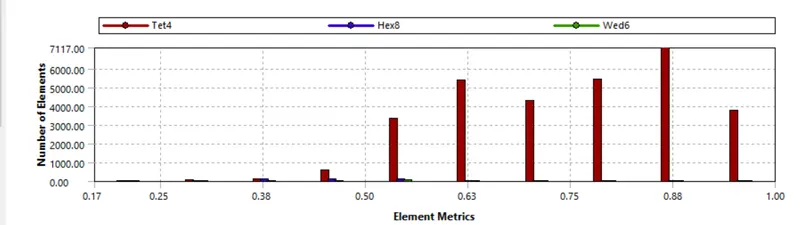
- the mesh quality is not less than 5%
Case 4:
- Uses K-epsilon, realizable fluid properties
- Energy equations are on
- working fluid is air
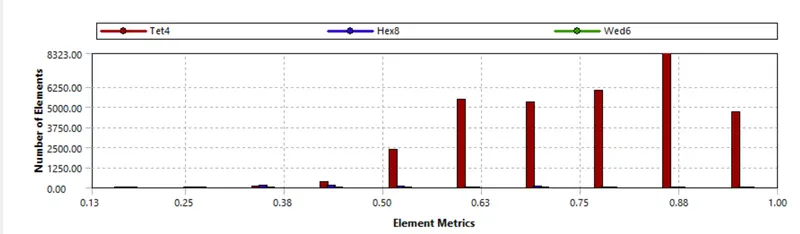
- the mesh quality is not less than 5%
K- epsilon model is used for all the cases as it is a basic flow through a mixing tee, complex calculations for temperature in complex structures, can us k- omega model.
| CASE | Node count | cell count | avg. temperature | total no of iterations |
| 1 | 8453 | 31203 | 299.356 | 200 |
| 2 | 6774 | 23514 | 298.772 | 200 |
| 3 | 8643 | 30237 | 299.347 | 200 |
| 4 | 9249 | 32814 | 298.326 | 200 |
Results:
Area weighted average graphs:
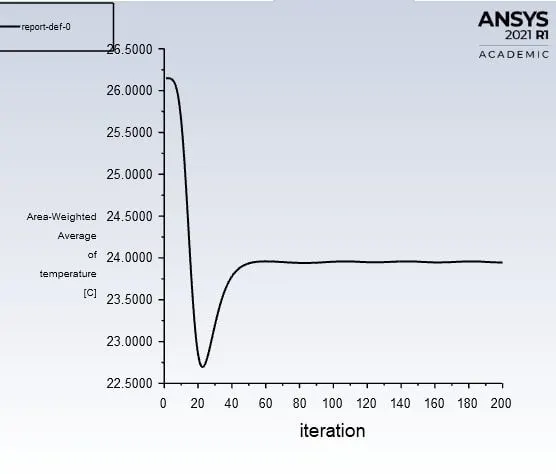 case 1
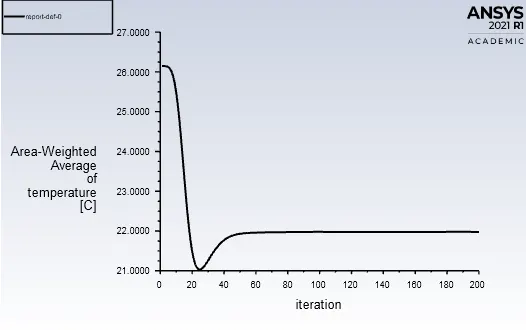 case 2
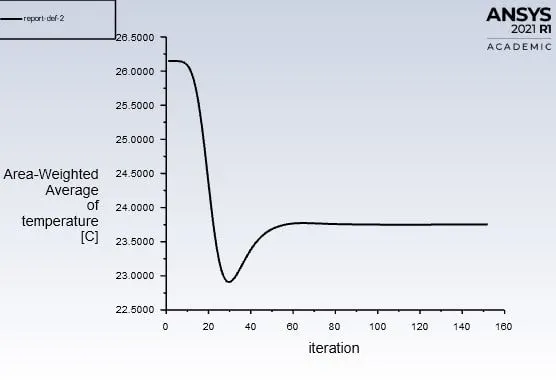 case 3
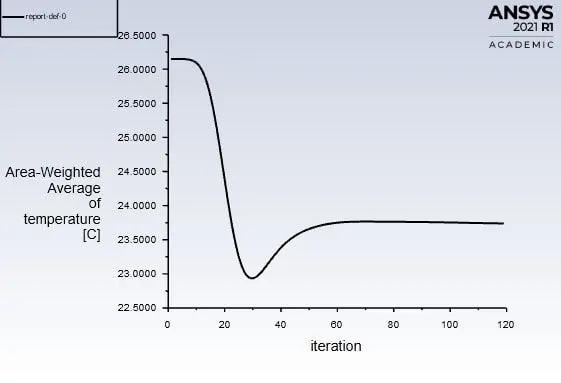 case 4
Standard deviation graphs:
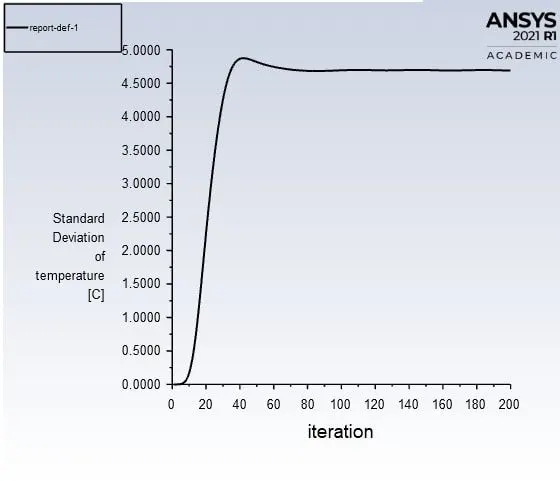 case 1
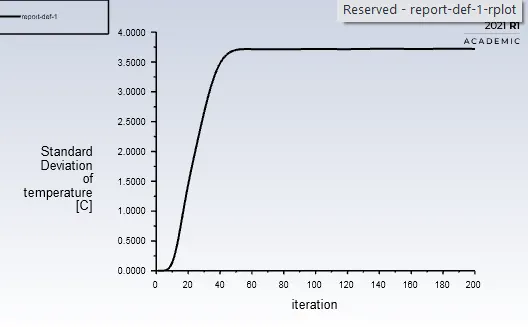 case 2
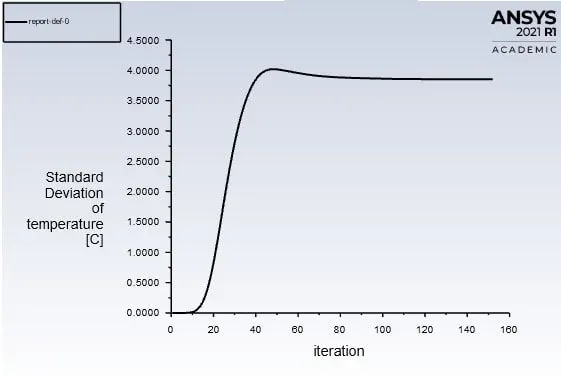 case 3
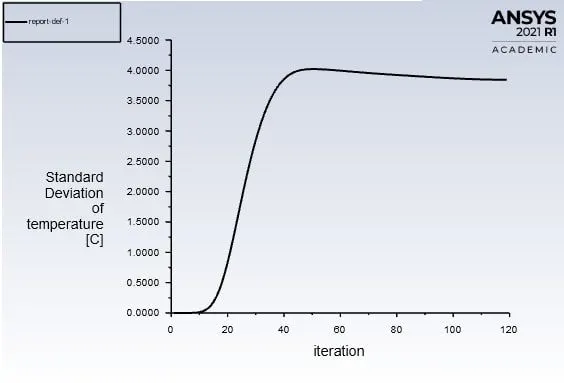 case 4
temperature vs lenght graphs:
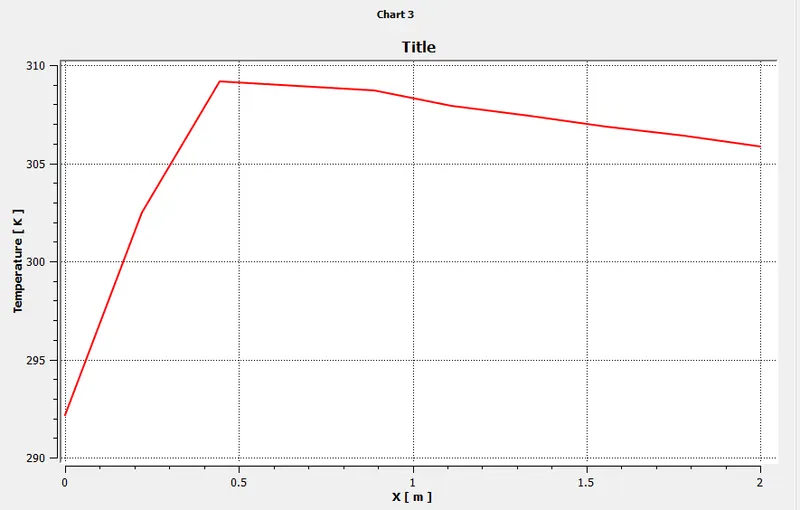 case 1
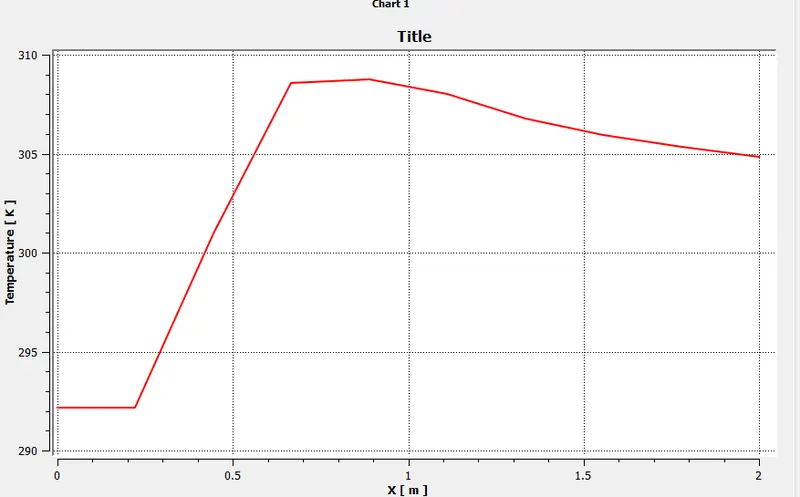 case 2
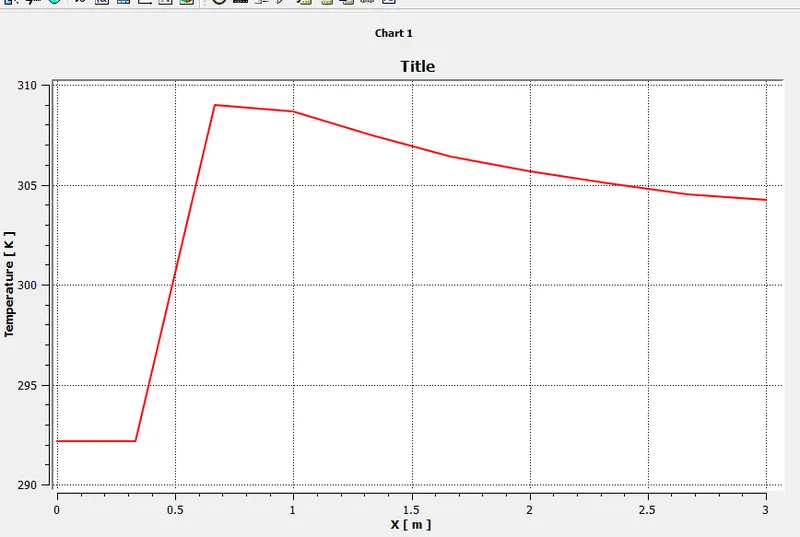 case 3
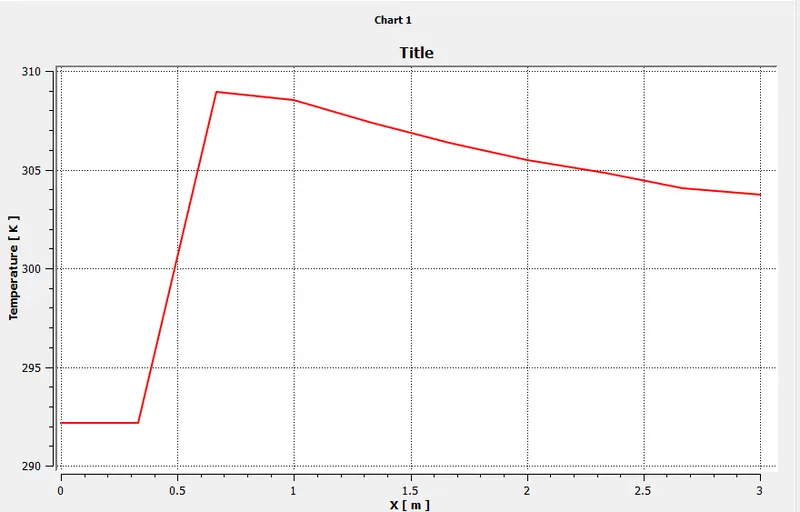 case 4
Temperature contours:
Top side:
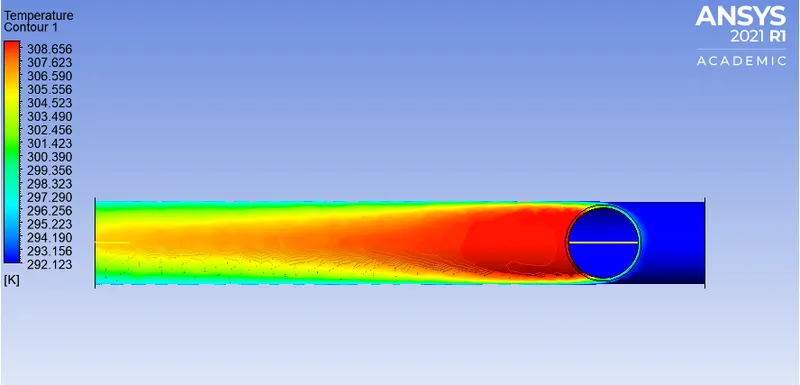 case 1
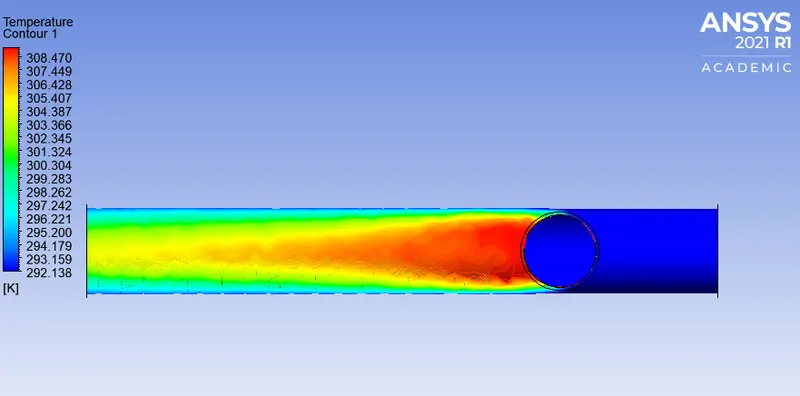 case 2
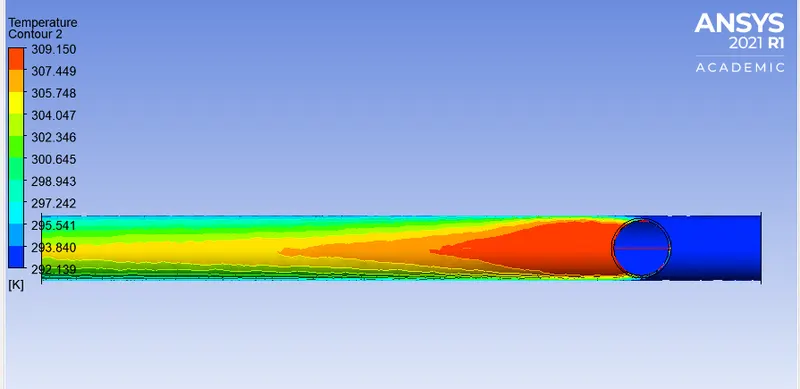 case 3
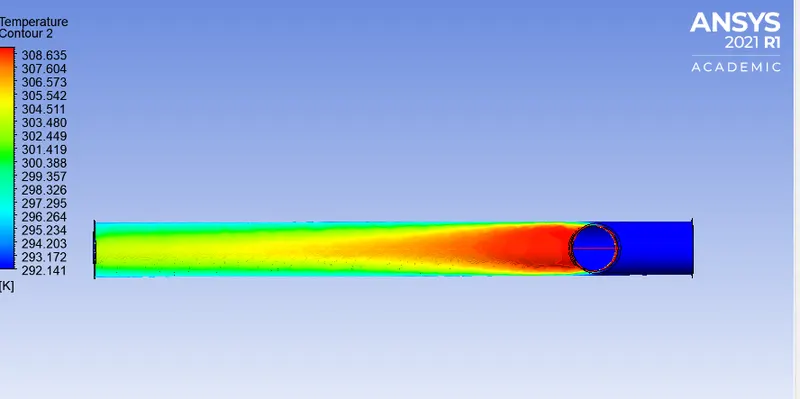 case 4
Side contours:
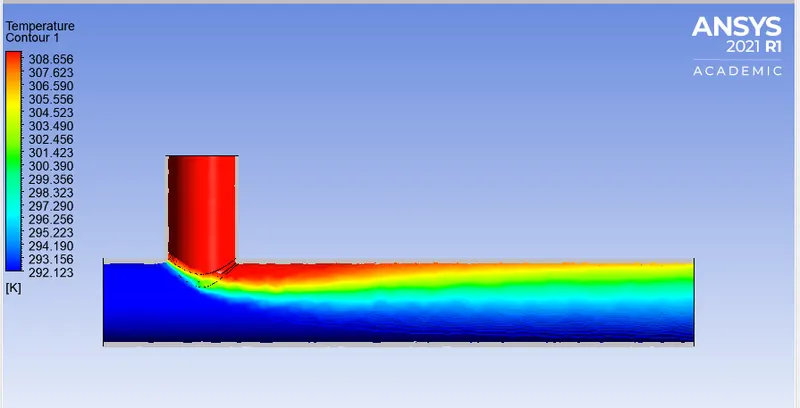 case 1
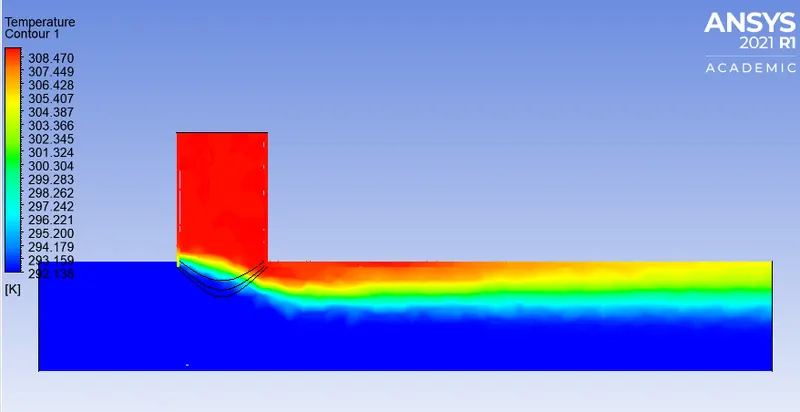 case 2
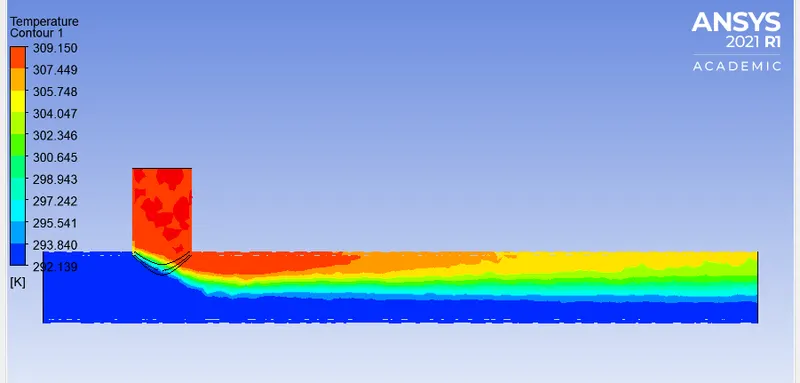 case 3
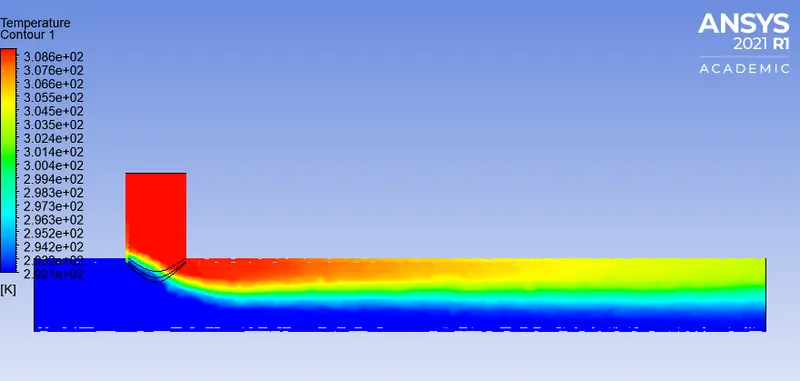 case 4
Conclusions:
- As the momentum ratio is increased, the cold inlet velocity increases in turn causes the temperature of hot inlet fluid to reduce.
- as the lenght of the mixing tee increases the temperature of the hot fluid reduces
- looking at the graphs, we can assume that after 50 iterations, the solution attains convergence.
- After 40-50 iterations, the solver attains an approximate solution.