Week 2 - Flow over a Cylinder.
|
Content
|
Aim: To simulate and analyze flow around a cylinder in Ansys Fluent.
1) Introduction: Von Karman vertex street theory
Vortex shedding is a phenomenon that occurs when a fluid moves around an object. When this encounter happenes a pressure difference is created by the fluid moving around the object(Cylinder) and at the back of the cylinder. This lower pressure at the back causes the fluid to seperate from the walls and create vorticies alternatingly behind the cylinder.
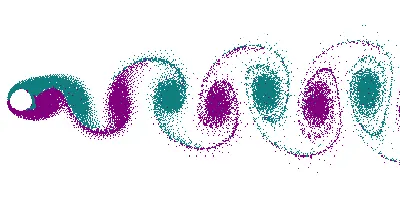 |
The above video shows the phenomenon of vortex shedding and the vortex create a single file, also known as vortex street(Given by Von karman). As these vortexes are created one can easily conclude that the flow becomes Turbulent and hence the Vortices(Eddies).
Applications: In nature Vortex shedding can be seen a light pole is moving side-to-side when air flows around it. Behind vortices of air are created.
Also when air passes from sea or oceans over to mountains the vortex are fromed and can be seen affecting the clouds as well.
Vortex shedding are undesirable phenomenon and can cause vibrations in a body, espicially aircrafts, high chimneys. It is necessary to avoid this and avert catastrophic failures. That is why designs are created that would not cause seperations of flow at high speeds, best example being an Airfoil.
It has found it's applications in aerospace industry.
| ------------------------------------------------------------------------------------------ |
2) Snippets of setting up of problem:
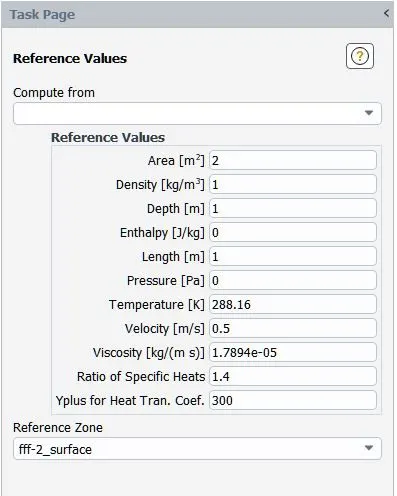
To simulate the problem it was necessary to consider a few values beforehand and input them as the setup progressed,
| Viscosity | 0.02 `(kg)/(m*s)` |
| Area | 2 `m^2` |
| Length | 2 m |
| Density | 1 `(kg)/(m^3)` |
| Velocity |
As per the Renolds number formula Re = `(u*density [rho]) / (viscosity [mu])` |
|
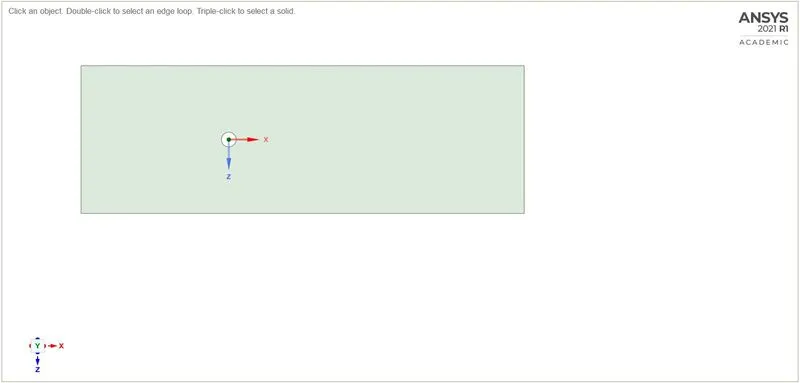
Geometry :
|
|||||||||||
|
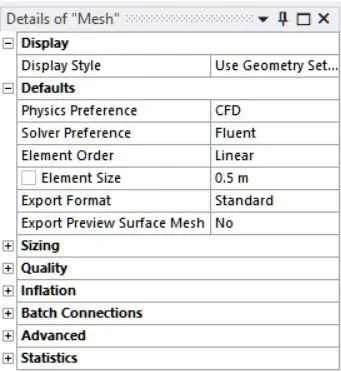
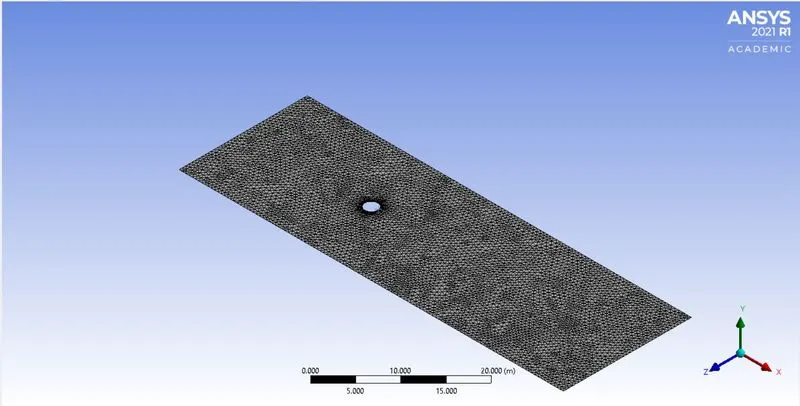
Meshing:
|
|||||||||||
|
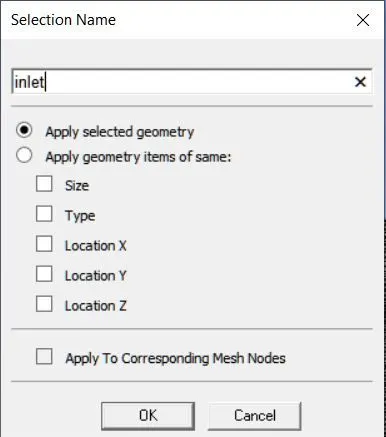
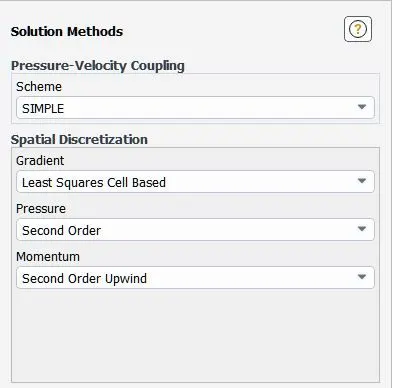
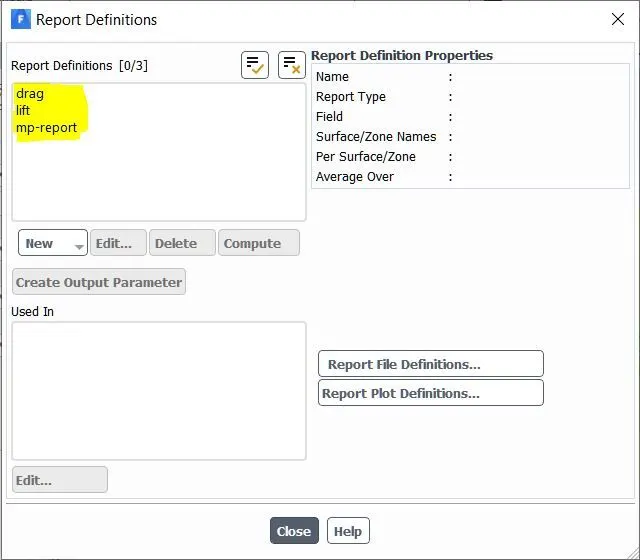
Setup:
|
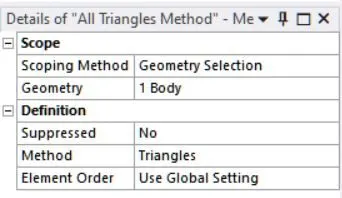
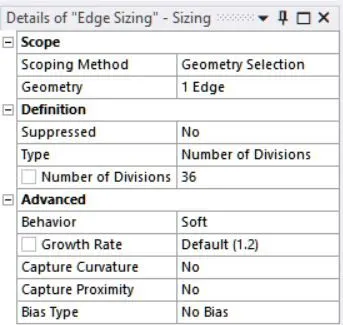
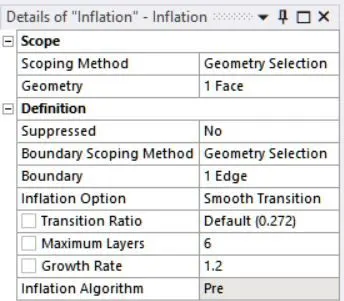
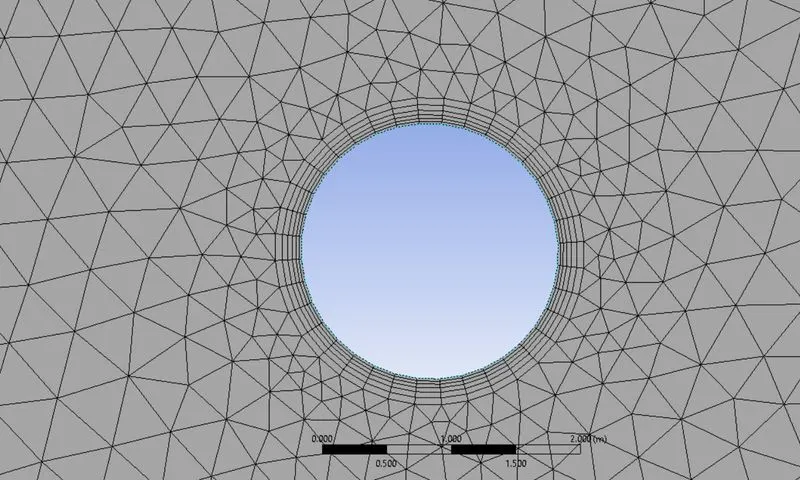
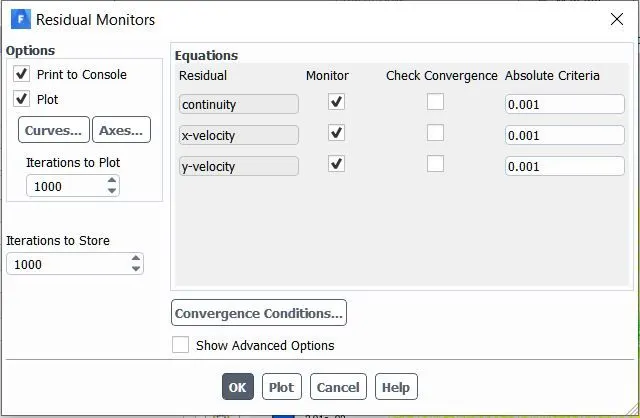
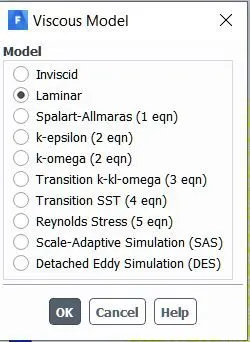
3) Steady state V/S Transient state for Re100:
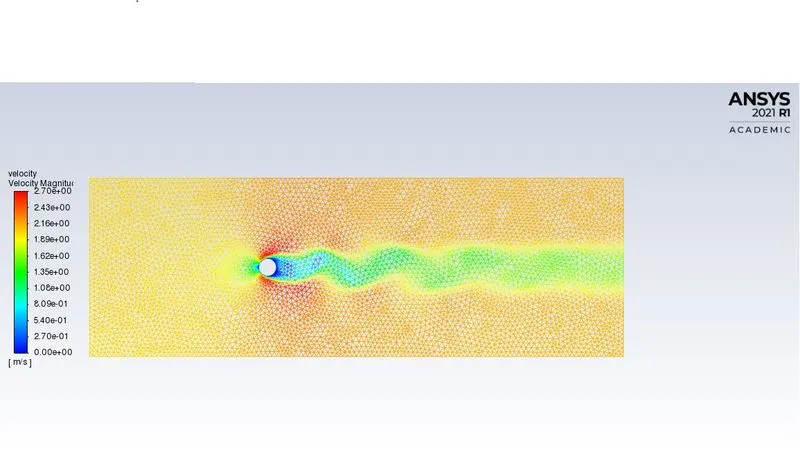
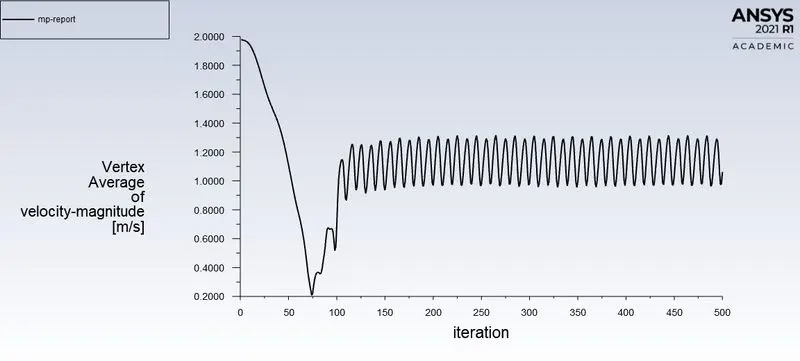
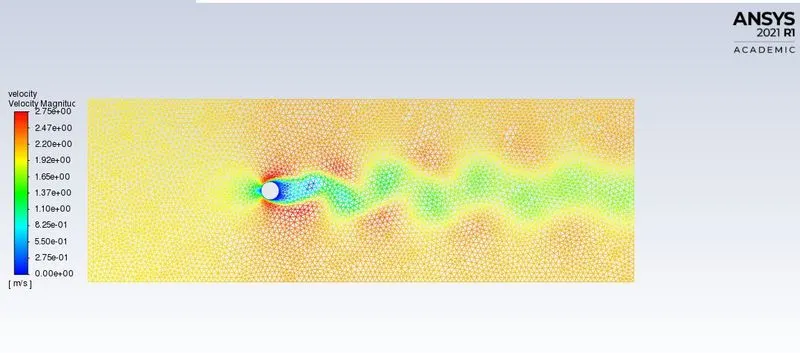
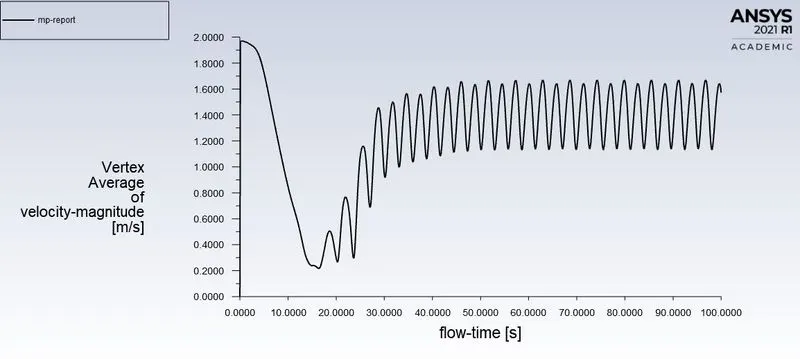
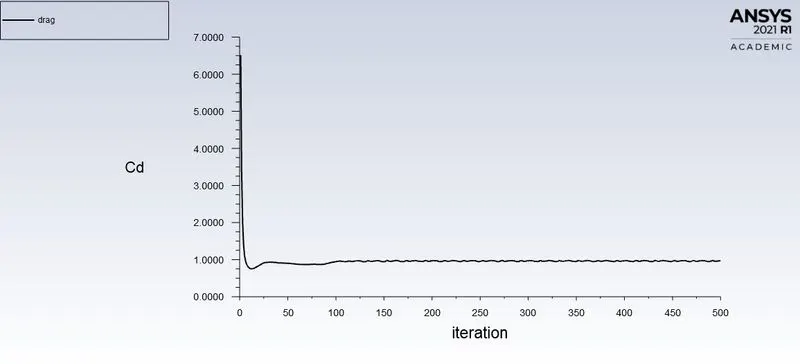
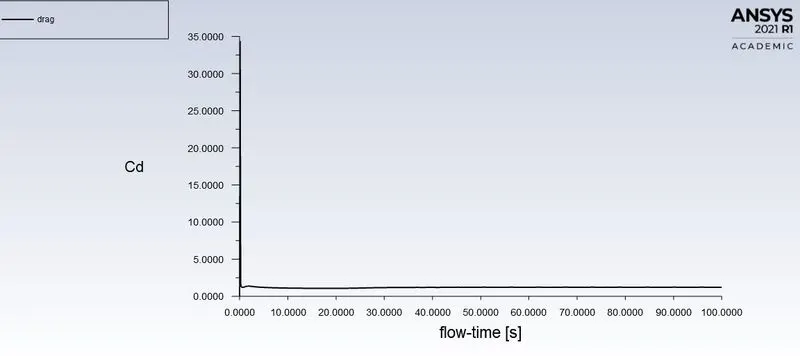
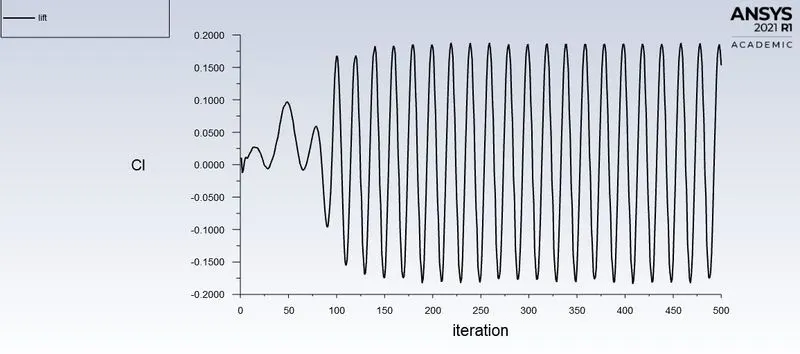
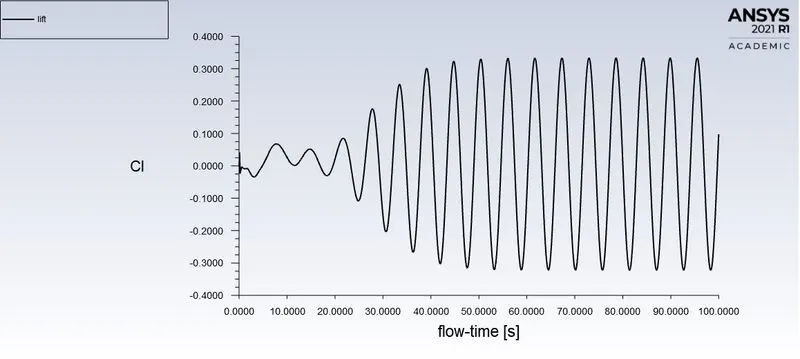
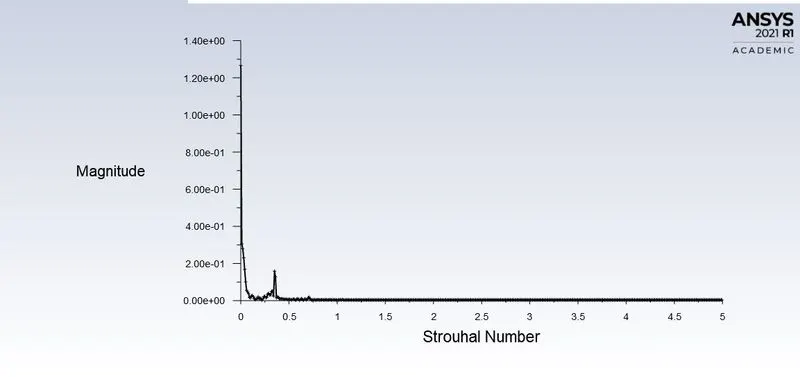
For this simulation steady state(500 interations) and Transient state(1000 iterations with 0.1sec timesteps) were conducted. As per the results the Strouhal number was calculated with the inbuilt function in Ansys Fluent.
Strouhal number: `St = (f*L)/U`
where,
f = frequency (Velocity fluctuatiuon in this case)
L = characteristic length,
U = flow Velocity
| Steady | Transient |
|
Velocity
|
Velocity
|
|
Drag
|
Drag
|
|
Lift
|
Lift
|
|
Strouhal Number
|
| ------------------------------------------------------------------------------------------ |
4) Steady state results for Renolds number (10, 100, 1000, 10000, 100000):
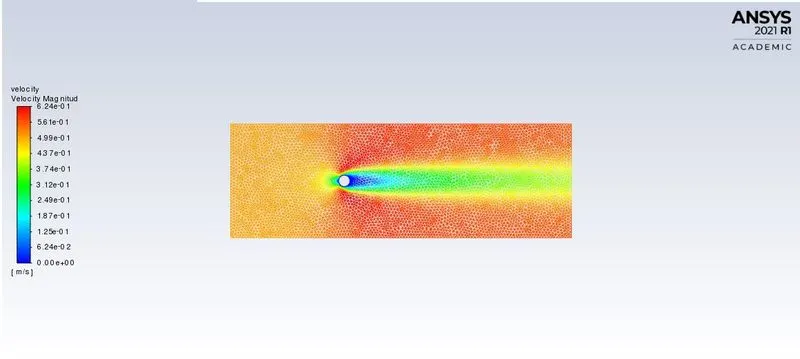
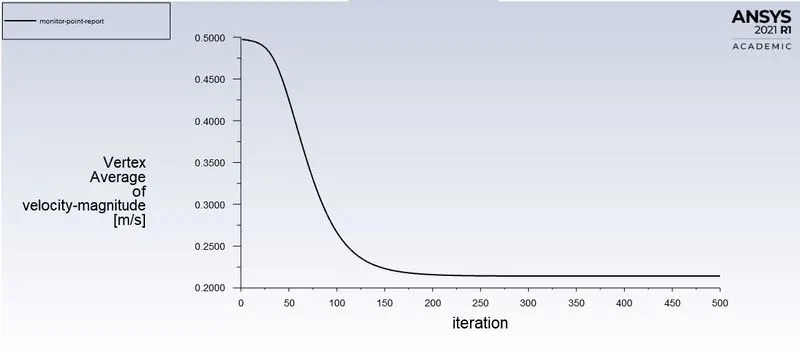
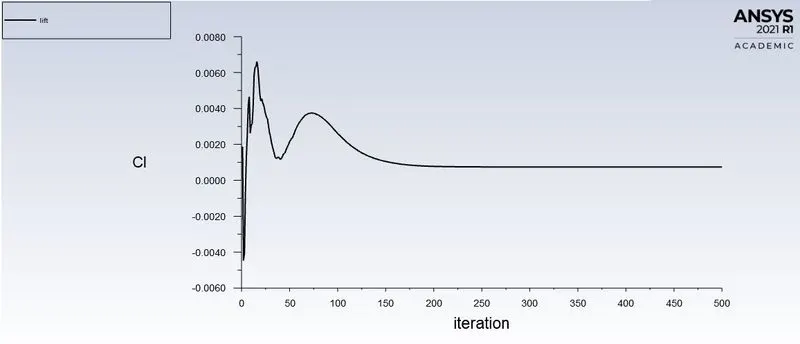
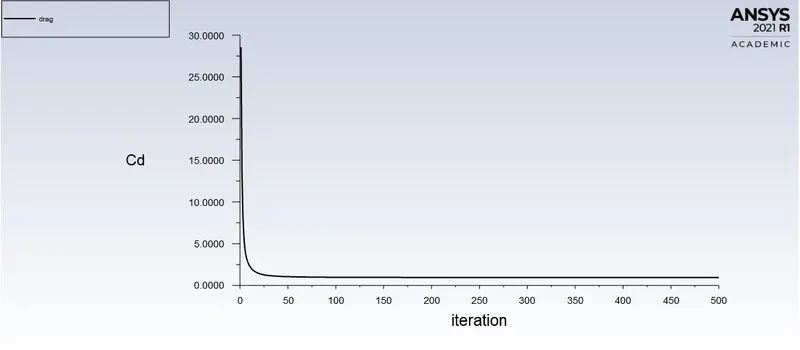
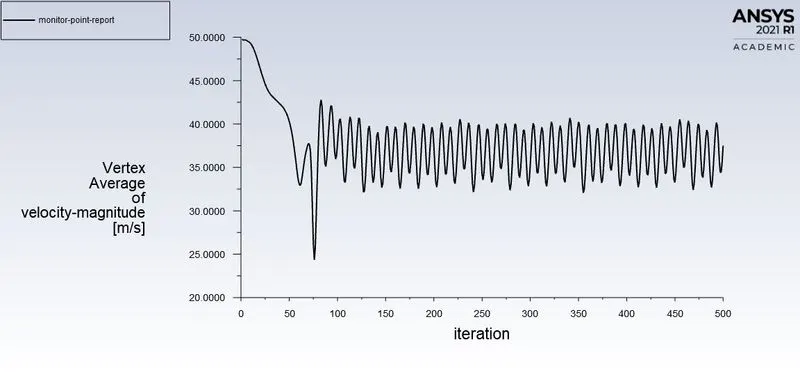
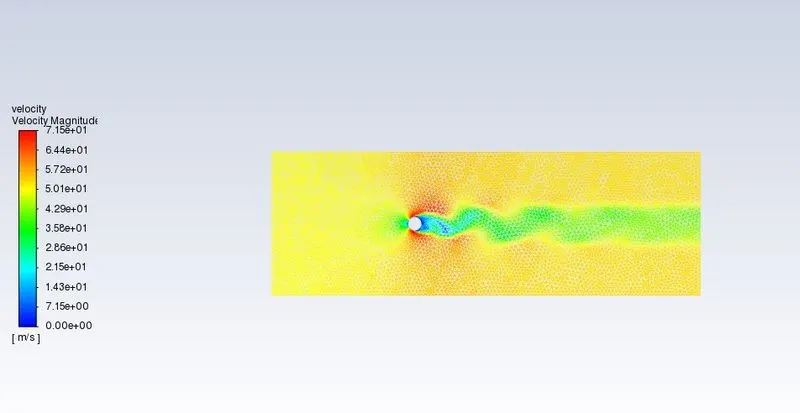
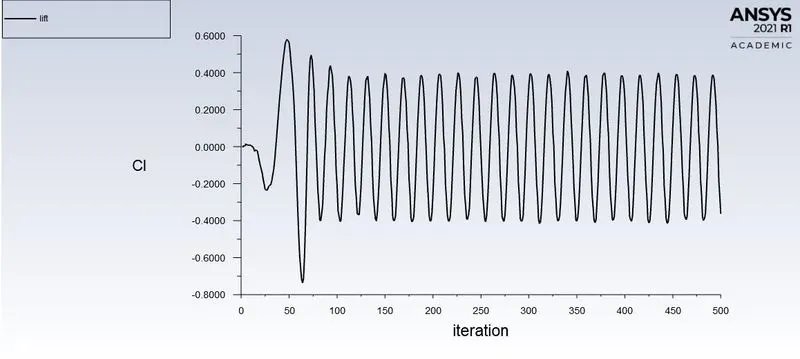
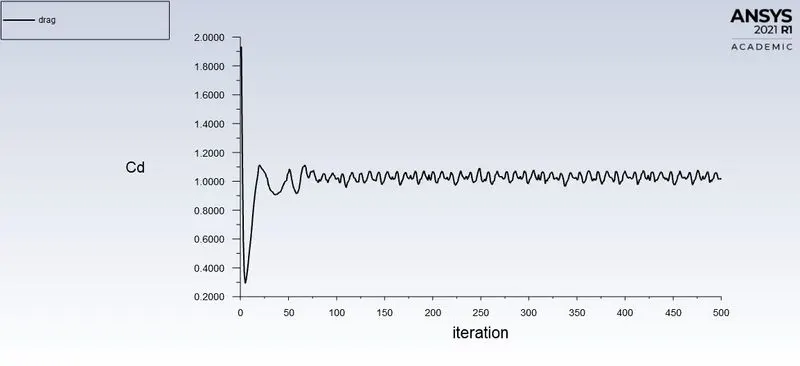
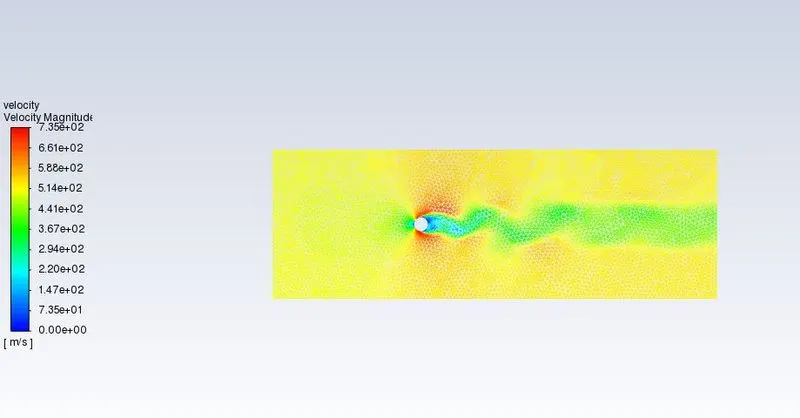
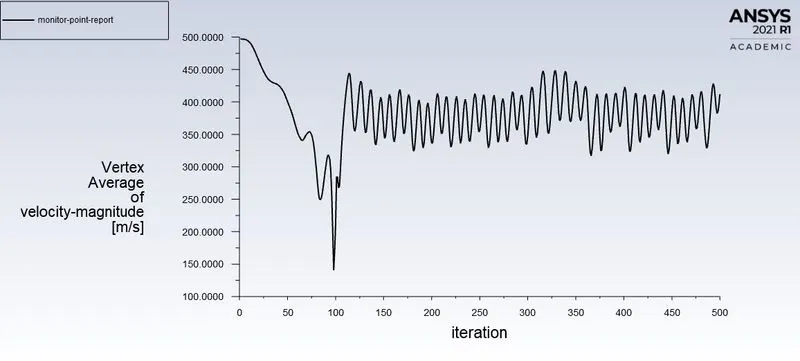
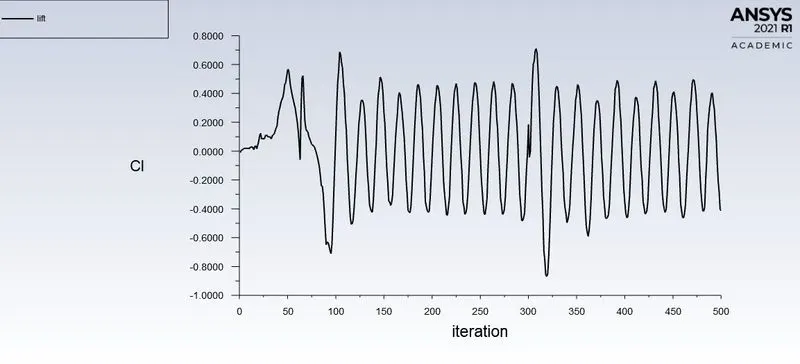
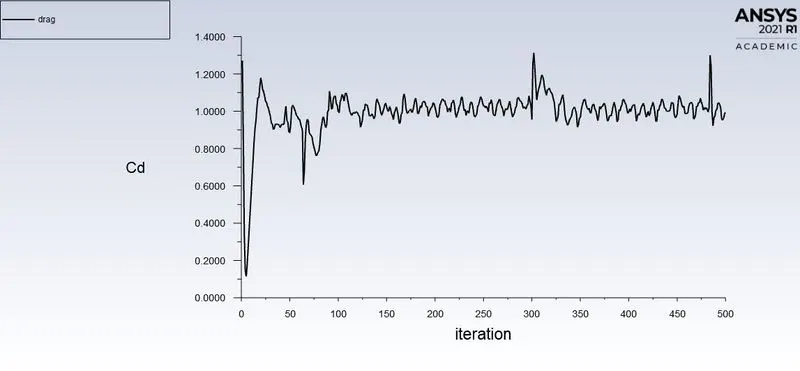
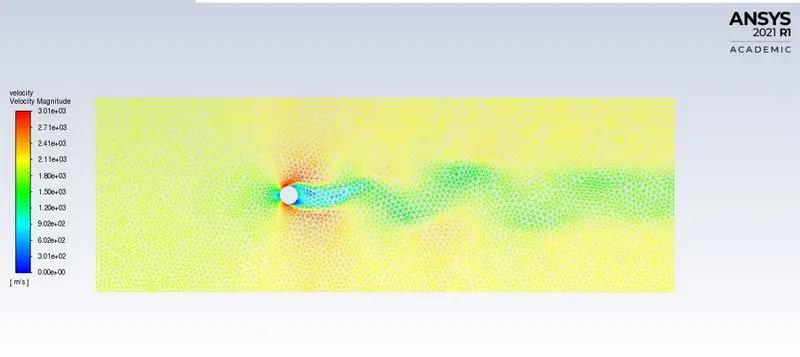
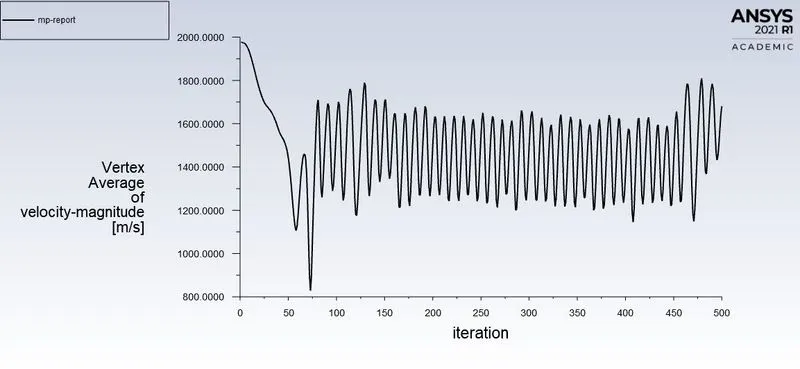
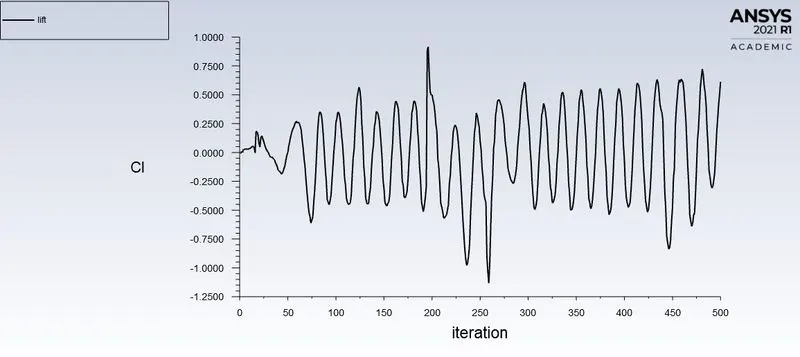
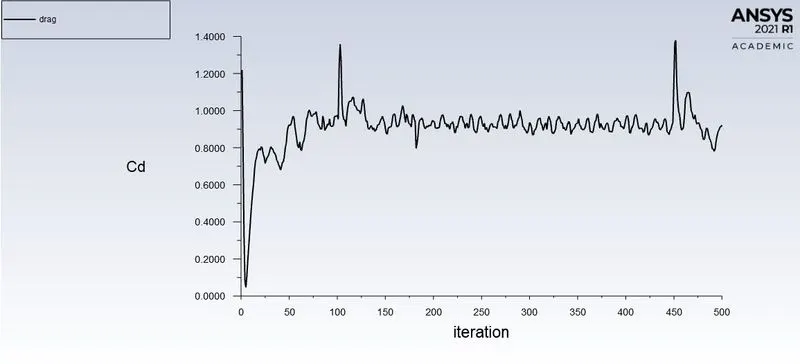
As the simulation was not capped for convergence (Unchecked for residual limit), the simulation would continue to run. It is necessary to check if the convergence had occured. To do this it is necessary to understand when convergence occurs (In a nutshel when a steady fluctuations occur or the values does not change as iterations goes on). In out case it was seen after some point the velocity starts to fluctuate and repetes the pattern of fluctuation, also by observing the lift we can notice these flutuations and the pattern. With these observations one can conclude the solution is converged.
|
Re:10
|
|
Re:1000
|
|
Re:10000
|
|
Re:100000
|
| ------------------------------------------------------------------------------------------ |
| 4) Table of Coefficients for different Re cases |
| Re | Coefficient of Lift |
Coefficient of Drag |
| 10 |
0.0018116234 |
2.3375126 |
| 100 |
0.097608939 |
1.2097777 |
| 1000 | -0.31886661 |
0.83253239 |
| 10000 |
0.4161467 |
0.99624616 |
| 100000 | 0.61247520 | 0.86154509 |
As for Re100: Trannsient results are mentioned and one can confirm that the results of coefficient of drag and coefficient of lift are within 5% of the values in the paper mentioned at the end.
| ------------------------------------------------------------------------------------------ |
5) Conclusion with observation of the result: As the coefficient of drag `(2*Fd)/(rho*u^2*A)` is a function of drag force and is inversely proportional to the area(Frontal area), density and the `(Velocity)^2` it can be seen that as the Renolds number(A function of valocity) increases the coefficient of drag decreases. As the drag decreases the lift simultaneously increases. As this can be analyticaly proven as well we can also say with assurance that the simulation has worked equaly well in this regared, to caliberate the results help of the reaserch paper mentioned below was employed to compare the values of Coefficient of Drag and Coefficient of lift for Re100. Which came close to the experimental(Mentioned) values.
With this we can conclude that the simulation taken place of flow over the cylinder and results obtained are valid.
| ------------------------------------------------------------------------------------------ |
6) Research paper: Numerical simulation of laminar flow past a circular cylinder