Week 2 Air standard Cycle
Aim
Plot Pressure-Volume(PV) Diagram of Air Standard Cycle and Calculation of thermal efficiency Using Python
Objectives
- Plot Pressure-Volume (PV) Diagram of Air Standard Cycle
- Calculate Thermal Efficiency of Air Standard Cycle
Theory:
The Otto cycle is the ideal cycle for spark-ignition reciprocating engines. In most spark-ignition engines, the piston executes four complete strokes (two mechanical cycles) within the cylinder, and the crankshaft completes two revolutions for each thermodynamic cycle. These engines are called four-stroke internal combustion engines.
Initially, both the intake and the exhaust valves are closed, and the piston is at its lowest position (BDC). During the compression stroke, the piston moves upward, compressing the air-fuel mixture. Shortly before the piston reaches its highest position (TDC), the spark plug fires and the mixture
ignites, increasing the pressure and temperature of the system. The high-pressure gases force the piston down, which in turn forces the crankshaft to rotate, producing a useful work output during the expansion or power stroke. At the end of this stroke, the piston is at its lowest position (the completion
of the first mechanical cycle), and the cylinder is filled with combustion products. Now the piston moves upward one more time, purging the exhaust gases through the exhaust valve (the exhaust stroke), and down a second time, drawing in the fresh air-fuel mixture through the intake valve (the intake
stroke). Notice that the pressure in the cylinder is slightly above the atmospheric value during the exhaust stroke and slightly below during the intake stroke.
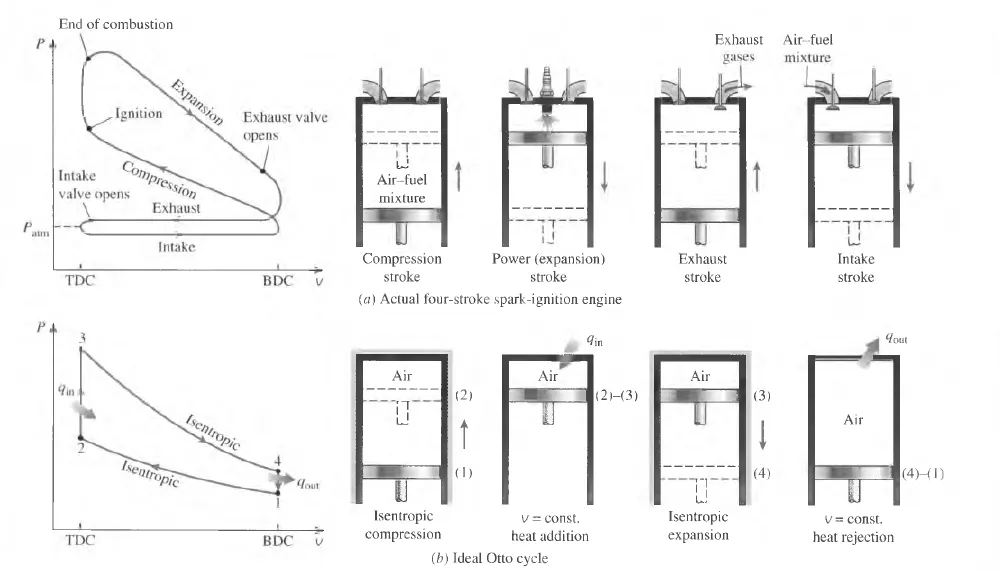
Fig.1 -Actual and ideal cycles in spark-ignition engines and their p-V diagrams.
The four processes in an Otto cycle are:
- Isentropic compression process or Reversible adiabatic compression of air (Process 1-2),
- Constant volume heat addition process (Process 2-3),
- Isentropic expansion process or Reversible adiabatic expansion of air (Process 3-4),
- Constant volume heat rejection process (Process 4-1).
Governing Equations & Graphs
- Adiabatic Process
PVγ=constantPVγ=constant
P – pressure
V-volume
γ - the ratio of specific heat
- Ideal Gas Equation
PV=nRTPV=nRT
P -Pressure
V - Volume
n – No. of moles
R – Universal Gas constant
T – Temperature
- Constant Volume Process
PT=constantPT=constant
P – Pressure
T – Temperature
- Thermal efficiency
η=1−1rγ−1η=1-1rγ-1
γ - the ratio of specific heat
η – thermal efficiency
Ideal PV-Diagram for Otto-Cycle
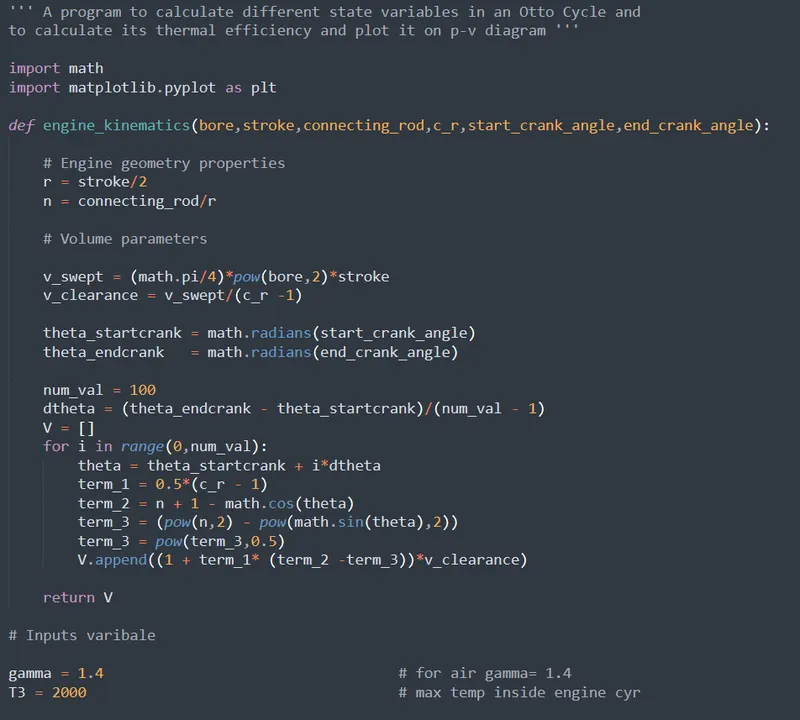
''' A program to calculate different state variables in an Otto Cycle and
to calculate its thermal efficiency and plot it on p-v diagram '''

import math
import matplotlib.pyplot as plt

def engine_kinematics(bore,stroke,connecting_rod,c_r,start_crank_angle,end_crank_angle):

	# Engine geometry properties
	r = stroke/2
	n = connecting_rod/r

	# Volume parameters

	v_swept = (math.pi/4)*pow(bore,2)*stroke
	v_clearance = v_swept/(c_r -1)

	theta_startcrank = math.radians(start_crank_angle)
	theta_endcrank   = math.radians(end_crank_angle)

	num_val = 100
	dtheta = (theta_endcrank - theta_startcrank)/(num_val - 1)
	V = []
	for i in range(0,num_val):
		theta = theta_startcrank + i*dtheta
		term_1 = 0.5*(c_r - 1)
		term_2 = n + 1 - math.cos(theta)
		term_3 = (pow(n,2) - pow(math.sin(theta),2))
		term_3 = pow(term_3,0.5)
		V.append((1 + term_1* (term_2 -term_3))*v_clearance)

	return V

# Inputs varibale

gamma = 1.4                                  # for air gamma= 1.4
T3 = 2000                                    # max temp inside engine cyr

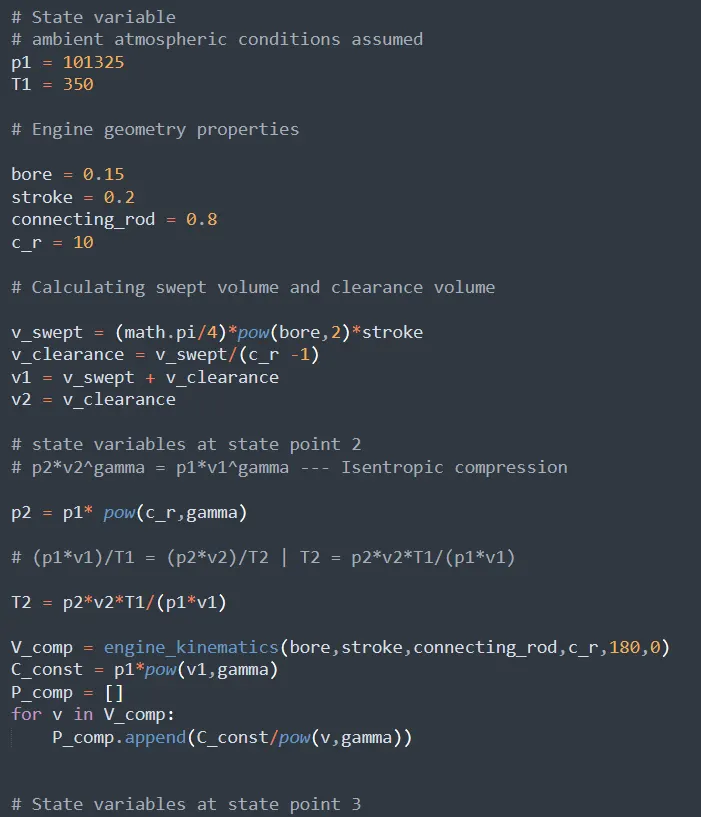
# State variable
# ambient atmospheric conditions assumed
p1 = 101325
T1 = 350

# Engine geometry properties

bore = 0.15
stroke = 0.2
connecting_rod = 0.8
c_r = 10

# Calculating swept volume and clearance volume

v_swept = (math.pi/4)*pow(bore,2)*stroke
v_clearance = v_swept/(c_r -1)
v1 = v_swept + v_clearance
v2 = v_clearance

# state variables at state point 2
# p2*v2^gamma = p1*v1^gamma --- Isentropic compression

p2 = p1* pow(c_r,gamma)

# (p1*v1)/T1 = (p2*v2)/T2 | T2 = p2*v2*T1/(p1*v1)

T2 = p2*v2*T1/(p1*v1)

V_comp = engine_kinematics(bore,stroke,connecting_rod,c_r,180,0)
C_const = p1*pow(v1,gamma)
P_comp = []
for v in V_comp:
	P_comp.append(C_const/pow(v,gamma))


# State variables at state point 3

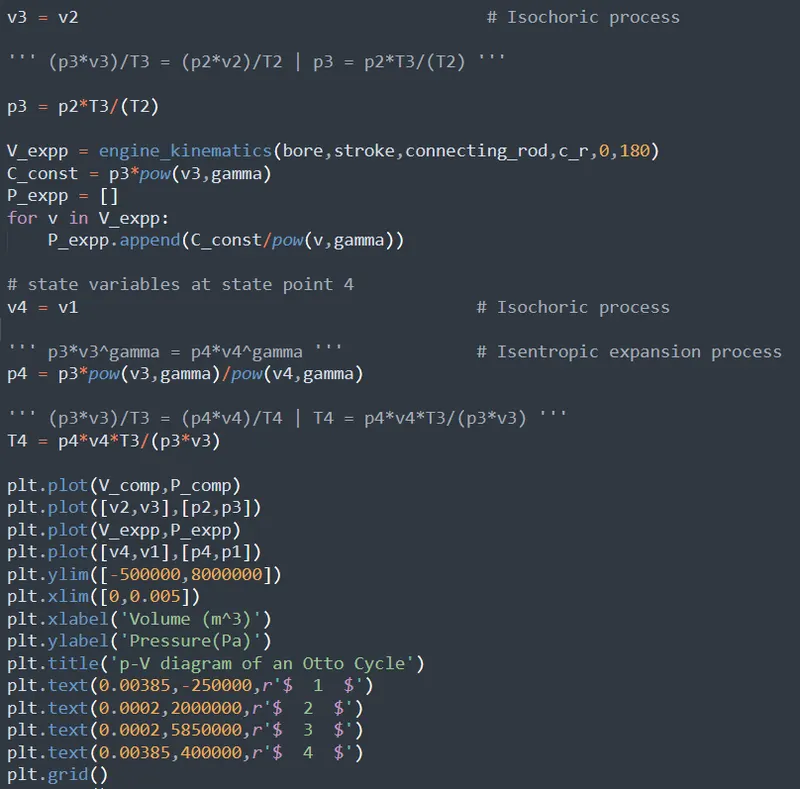
v3 = v2                                        # Isochoric process

''' (p3*v3)/T3 = (p2*v2)/T2 | p3 = p2*T3/(T2) '''

p3 = p2*T3/(T2)

V_expp = engine_kinematics(bore,stroke,connecting_rod,c_r,0,180)
C_const = p3*pow(v3,gamma)
P_expp = []
for v in V_expp:
	P_expp.append(C_const/pow(v,gamma))

# state variables at state point 4
v4 = v1                                       # Isochoric process

''' p3*v3^gamma = p4*v4^gamma '''             # Isentropic expansion process
p4 = p3*pow(v3,gamma)/pow(v4,gamma)

''' (p3*v3)/T3 = (p4*v4)/T4 | T4 = p4*v4*T3/(p3*v3) '''
T4 = p4*v4*T3/(p3*v3)

plt.plot(V_comp,P_comp)
plt.plot([v2,v3],[p2,p3])
plt.plot(V_expp,P_expp)
plt.plot([v4,v1],[p4,p1])
plt.ylim([-500000,8000000])
plt.xlim([0,0.005])
plt.xlabel('Volume (m^3)')
plt.ylabel('Pressure(Pa)')
plt.title('p-V diagram of an Otto Cycle')
plt.text(0.00385,-250000,r'$  1  $')
plt.text(0.0002,2000000,r'$  2  $')
plt.text(0.0002,5850000,r'$  3  $')
plt.text(0.00385,400000,r'$  4  $')
plt.grid()
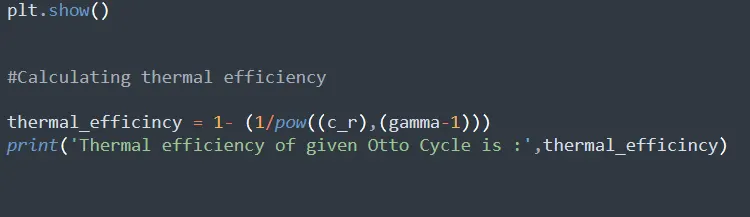
plt.show()


#Calculating thermal efficiency

thermal_efficincy = 1- (1/pow((c_r),(gamma-1)))
print('Thermal efficiency of given Otto Cycle is :',thermal_efficincy)
Result :-
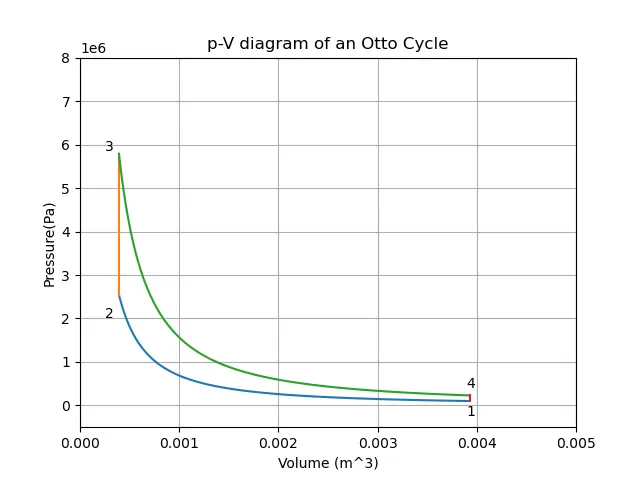
Program window attached screenshot image :-
Conclusion:-
The desired and correct p-V diagram of the Otto cycle was obtained using an array of volume inside the engine cylinder at a different crank angle.