import matplotlib.pyplot as plt
import math

def engine_kinematics(bore,stroke,con_rod,cr,start_crank,end_crank):

	a=stroke/2
	r=con_rod/a

	v_s=math.pi*(1/4)*pow(bore,2)*stroke
	v_c=v_s/(cr-1)

	sc=math.radians(start_crank)
	ec=math.radians(end_crank)

	num_values = 1000

	dtheta=(ec-sc)/(num_values-1)

	v=[]

	for i in range(0,num_values):
		theta=sc+i*dtheta
		term1=0.5*(cr-1)
		term2=r+1-math.cos(theta)
		term3=pow(r,2)-pow(math.sin(theta),2)
		term3=pow(term3,0.5)

		v.append((1+term1*(term2-term3))*v_c)


	return v

#inputs

p1=101325
t1=500
t3=2300
gama=1.4

#geometricparameters

bore=0.1
stroke=0.1
con_rod=0.15
r=12


#volumecomputation

v_s=(math.pi/4)*pow(bore,2)*(stroke)
v_c=v_s/(r-1)
v1=v_c+v_s

#state2

v2=v_c

p2=p1*pow(v1,gama)/pow(v2,gama)
rhs=(p1*v1)/t1
t2=(p2*v2)/rhs

v_compression = engine_kinematics(bore,stroke,con_rod,r,180,0)
constant=p1*pow(v1,gama)
p_compression =[]

for v in v_compression:
	p_compression.append(constant/pow(v,gama))


#state3

v3=v2
rhs=(p2*v2)/t2
p3=(rhs*t3)/v3

v_expansion = engine_kinematics(bore,stroke,con_rod,r,0,180)
constant=p3*pow(v3,gama)
p_expansion =[]

for v in v_expansion:
	p_expansion.append(constant/pow(v,gama))

#state 4

v4=v1
p4=p3*pow(v3,gama)/pow(v4,gama)

rhs=(p3*v3)/t3

t4=(p4*v4)/rhs

thermal_eff=1-((t4-t1)/(t3-t2))
print(thermal_eff)


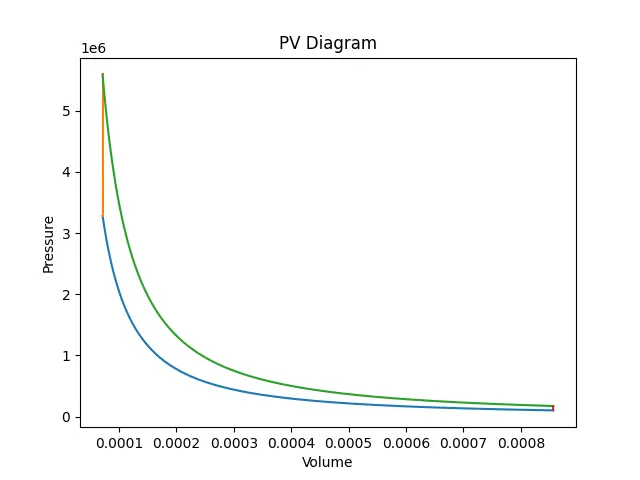
plt.plot(v_compression,p_compression)
plt.plot([v2,v3],[p2,p3])
plt.plot(v_expansion,p_expansion)
plt.plot([v4,v1],[p4,p1])
plt.xlabel('Volume')
plt.ylabel('Pressure')
plt.title('PV Diagram')
plt.show()