Week 2- 2R Robotic Arm Challenge
% Program to simulate kinematics of a 2R Robotic arm

% 2R robotic arm i.e., 2 is no of links, R - rotation, 2 rotating links

% Consider Link 1 to be L1 and it makes an angle theta1 w.r.t x axis in counter clockwise direction
% Consider Link 2 to be L2 and it makes an angle theta2 w.r.t x axis in counter clockwise direction

% Link 1 is fixed to a base A and its movement is restricted to have only 1
% degree of freedom i.e, rotation about an axis perpendicular to the plane xy

% Link 2 is fixed to joint B and its movement is restricted to have only 1
% degree of freedom i.e, rotation about an axis perpendicular to the plane xy

% Projection of Link 1 on x axis = L1cos(theta1)
% Projection of Link 1 on y axis = L2sin(theta1)

% Projection of Link 2 on x axis = L1cos(theta2)
% Projection of Link 2 on y axis = L2sin(theta2)


% Assigning input variables
L1 = 1;
L2 = 0.5;
% For a fixed lengths of L1 and L2, let us consider the multiple theta1 and theta2 values to generate a
% motion plot and also to create an animation video.

theta1 = linspace(0,90,10);
% linspace command - takes 10 values between 0 and 90 with equal intervals
theta2 = linspace(0,90,10);
% linspace command - takes 10 values between 0 and 90 with equal intervals


ct=1;
% ct - counter is used to generate plots one by one in a single figure so that it appears as a motion plot
% To create multiple plots, "for loop" is used as this command does a
% repeat action of the same instructions with different inputs till the program terminates.
for i=1:length(theta1)
    % for loop is initiated, condition - variable 'i' goes through the no of values
    % assigned for theta1 i.e., a total of 10 values. Therefore, the
    % instructions or commands in the for loop are repeated 10 times with
    % different 'i' values.

    THETA1 = theta1(i);
    % for each iteration, THETA1 takes one value i.e., from theta1(1) to theta1(10)
    % theta1(1)=0, theta1(2)=10, theta1(3)=20, theta1(4)=30, theta1(5)=40,
    % theta1(6)=50, theta1(7)=60, theta1(8)=70, theta1(9)=80, theta1(10)=90

for j=1:length(theta2)
    % for loop is initiated, condition - variable 'j' goes through the no of values
    % assigned for theta1 i.e., a total of 10 values. Therefore, the
    % instructions or commands in the for loop are repeated 10 times with
    % different 'j' values.

    THETA2 = theta2(j);
    % for each iteration, THETA2 takes one value i.e., from theta1(1) to theta1(10)
    % theta2(1)=0, theta2(2)=10, theta2(3)=20, theta2(4)=30, theta2(5)=40,
    % theta2(6)=50, theta2(7)=60, theta2(8)=70, theta2(9)=80, theta2(10)=90

    % CODE WORKING:
    % The second for loop i.e., for 'j' is inside of the first for loop of
    % 'i'. The reason for creating code in this manner is to generate a
    % motion plot with L1 being fixed while L2 rotates.
    % Working of code:
    % for every 'i' value for THETA1, 10 'j' values will be considered for THETA2
    % i.e., for every THETA1 of L1,  a number of 10 THETA2 values will be
    % considered to run the program and therefore, 10 plots will be generated for one angle of L1
    % a total of 100 plots will be generated by the end of the entire program.

  % Assigning coordinates for plotting links L1 & L2
   x0 = 0;
   y0 = 0;
   % Let the starting/initial coordinates be at the origin

   x1 = L1*cosd(THETA1);
   % From trigonometric approach, the length of L1 along x axis is L1costheta1

   y1 = L1*sind(THETA1);
   % From trigonometric approach, the length of L1 along y axis is L1sintheta1

   x2 = x1+L2*cosd(THETA2);
   % From trigonometric approach, the length of L2 along x axis is L2costheta2.
   % The ending point of L1 is starting point of L2, therefore the x coordinate of L2 is x1+L2costheta2

   y2 = y1+L2*sind(THETA2);
   % From trigonometric approach, the length of L2 along y axis is L2sintheta2.
   % The ending point of L1 is starting point of L2, therefore the y coordinate of L2 is y1+L2sintheta2

   % NOTE: d is used before theta to mention the angle in degrees otherwise it
   % will be considered as radians while executing the program.

   plot ([x0 x1],[y0 y1],[x1 x2],[y1 y2],'linewidth',3);
   % plot - creates a 2D plot of links on xy plane
   % linewidth - creates a linewidth of 3 to the plot line
   xlabel('x axis');
   % xlabel - to label the x axis
   ylabel('y axis');
   % ylabel - to label y axis
   axis([-0.1 2.5 0 2.5]);
   % axis - to create limits for x axis and y axis
   % -0.1 to 2.5 - x axis limits, 0 to 2.5 - y axis limits
   title('kinematics of 2R robotic arm');
   % title - creates title for the plot on top of the graph
   pause(0.5);
   % pause - takes a pause 0.5 seconds after each run of the program
   M(ct)=getframe(gcf);
   % M - movie file name,ct - counter
   % getframe - records or captures the plot, each plot is one frame
   % gcf - gets the current figure or plot that is being executed
   % M(ct)=getframe(gcf)
   %         M(1) = getframe(gcf) means first plot is captured
   %         M(2) = getframe(gcf) - second plot is captured and so on

   ct = ct+1;
   % after counter 1, it increments by one to execute the program for next plot
   % and so on till the for loop terminates

end
% end of for loop for 'j'
end
% end of for loop for 'i'

movie(M)
% movie - to play movie file M
videofile = VideoWriter('Test_moviefile2Rroboticarm_Harish.avi','Uncompressed AVI');
% Videowriter creates a videofile and file format on which video data can be written
% videofile is the name or variable assigned to videowriter
open(videofile)
% opens the videofile for writing video data
writeVideo(videofile,M)
% writevideo - writes the video data of M i.e., the frames captured by M onto the videofile
close(videofile)
% closes the videofile after writing video data

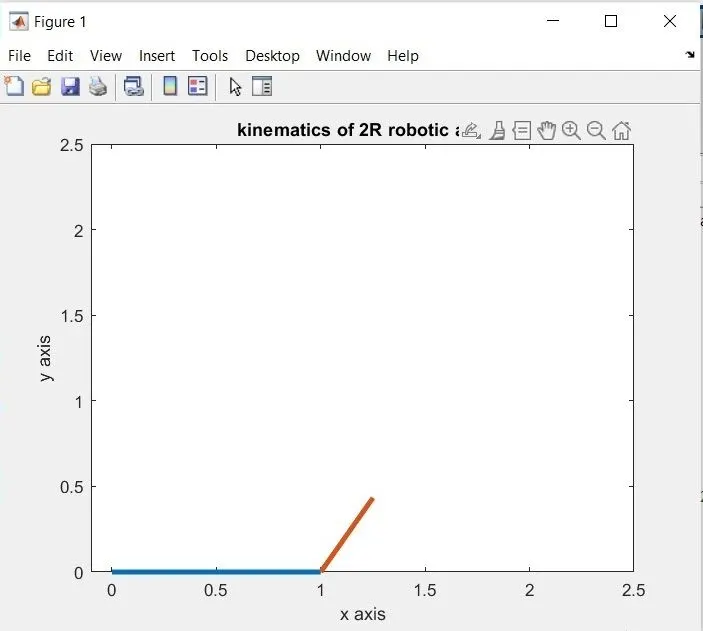
% Explanation of the output motion plot:
% With each angular rotation of L1 about base, L2 rotates about 10 angles about the joint connecting
% L1 and L2. Therefore, for 10 angular rotations of L1, L2 rotates about
% 100 angular rotations about joint connecting L1 and L2.
% The space covered by the links L1 and L2 by angular rotations from start
% point to end point is called the workspace of the robotic arm
% The motion plot does not have smooth transition from one plot to other as
% the pause provided between each plot is 0.5seconds.

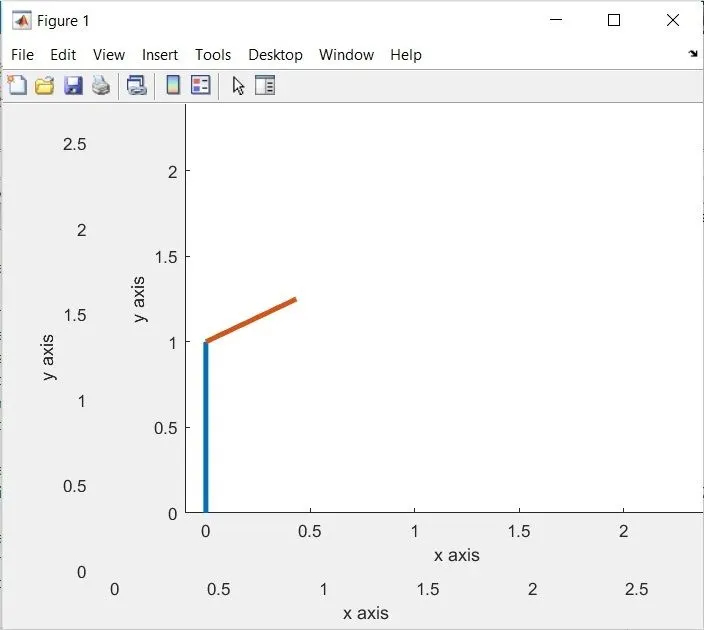
% Explanation of the output  movie(M):
% By giving commmand movie(M), the video will be played once and the framerate is 12fps by default.

% Explanation of output video file saved in the folder:
% By creating a videofile name and format, an object is created so that
% video data can be written on it. Once the video data is written on it, it
% will be saved as a videofile in the format. The framerate is 30fps.
ERRORS FACED WHILE PROGRAMMING
1)
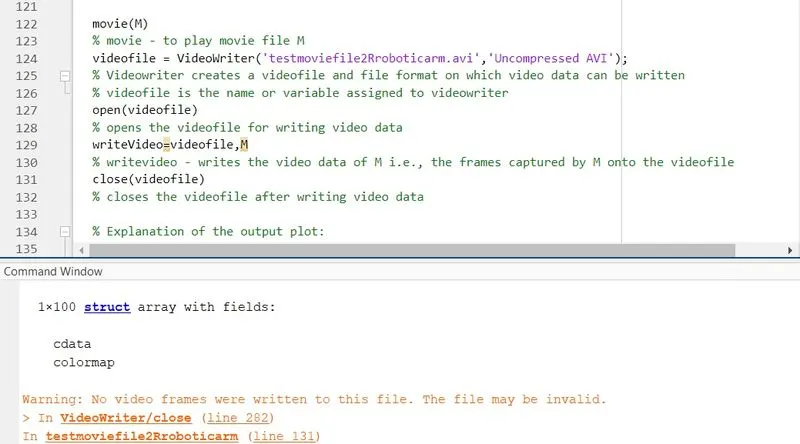
Here, writeVideo is typed as a variable, therefore the program showed an error
writeVideo is a function that writes video data onto the file
Corrected syntax
writeVideo(videofile,M) (Corrected syntax)
2)
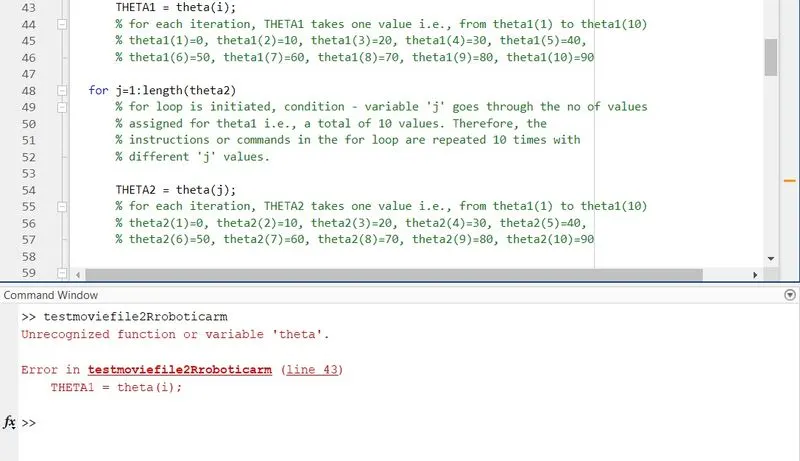
THETA1 and THETA2 were not assigned properly,
THETA1 was assigned theta(i) instead of theta1(i),
similarly with THETA2
Corrected variable assignnment
THETA1 = theta1(i) [theta1(1) to theta1(10)]
THETA2 = theta2(i) [theta2(1) to theta2(10)]
PROGRAM OUTPUT
1) Output motion plot
2) Output movie (M)
3) Output videofile links (both youtube and google drive) are attached as follows
https://drive.google.com/file/d/1dDMIXnT9oXKA8SPHQZgOxG0e8NAgo3Mz/view?usp=sharing