Project 1 - Parsing NASA thermodynamic data
PROJECT1: PARSING NASA THERMODYNAMIC DATA
Program to extract Local temperature data, 14 coefficients of all species from THERMO.dat file
Calculate the specific heat, enthalpy and entropy of all species
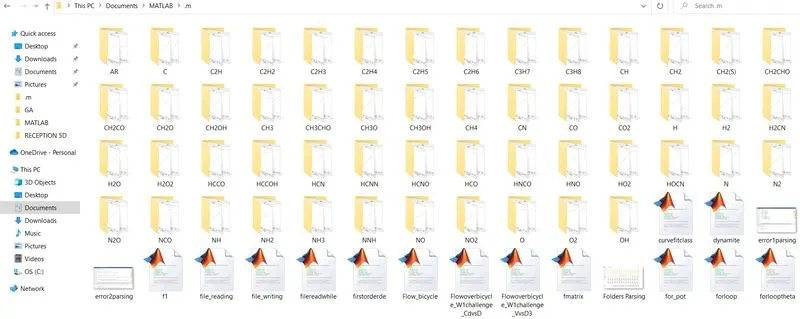
Create folders, one for each species
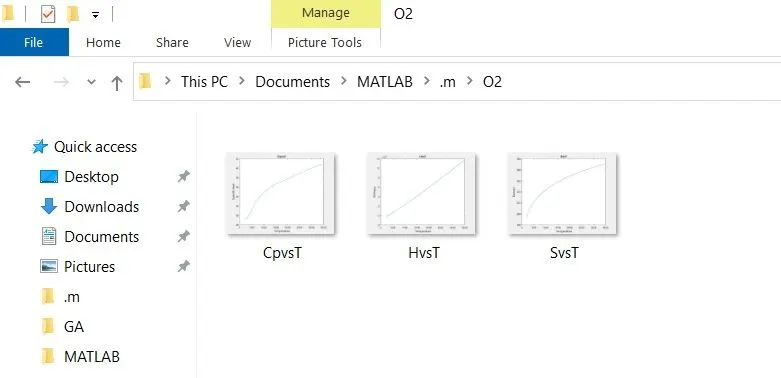
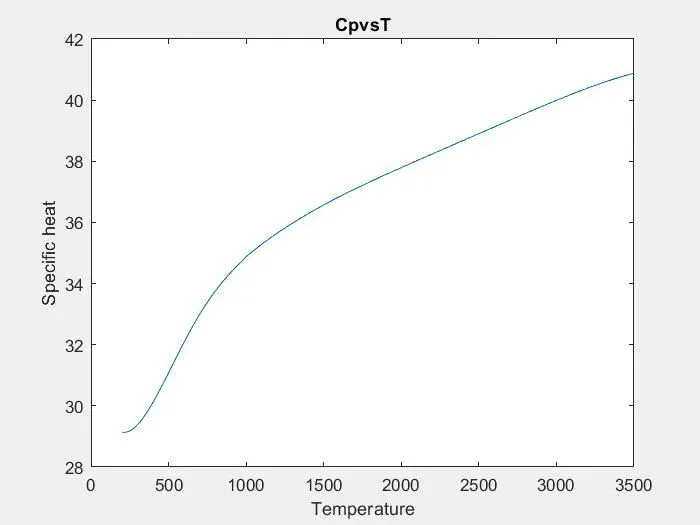
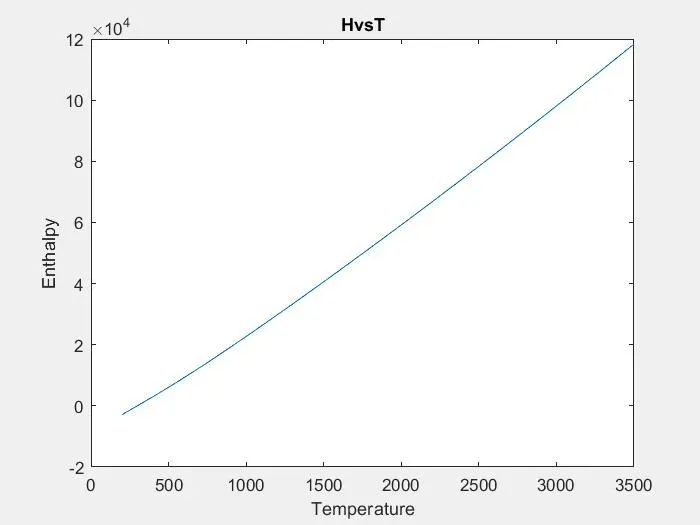
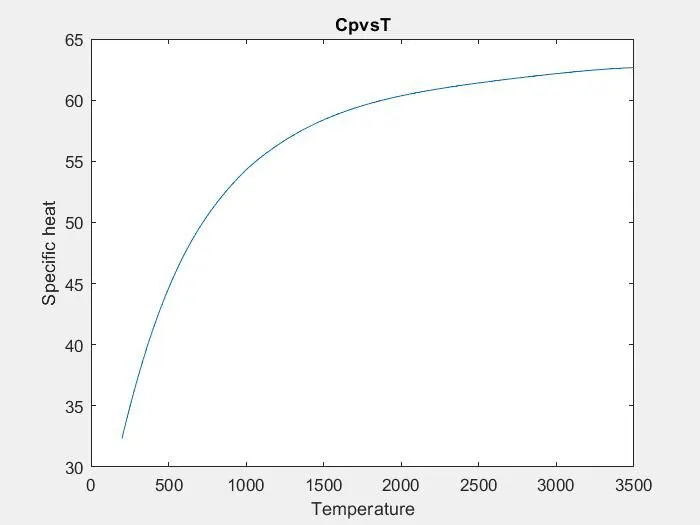
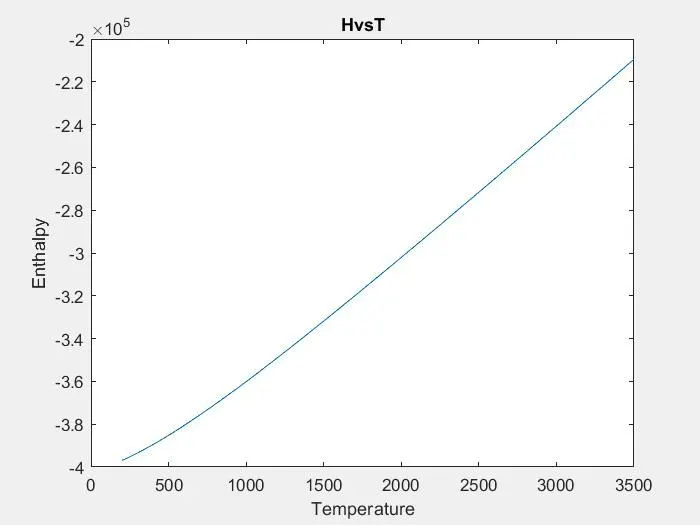
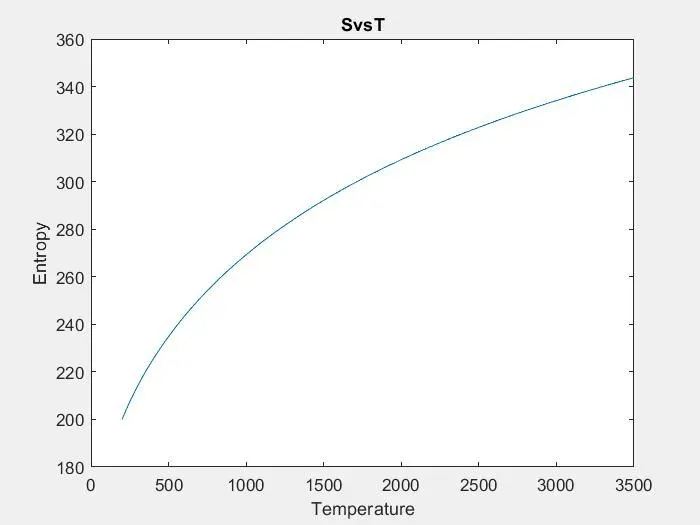
Plot the variation of Cp,H and S w.r.t T and save them as images in respective folders
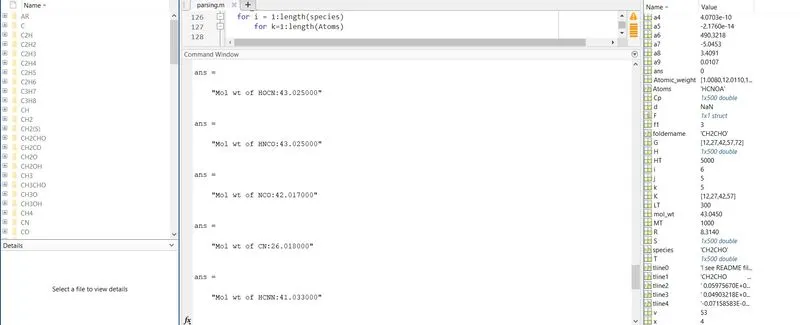
Calculate molecular weight and disply in command window
PROGRAM CODE
clear all
close all
clc
f1=fopen('THERMO.dat','r');
for j=1:5;
tline0=fgetl(f1);
end
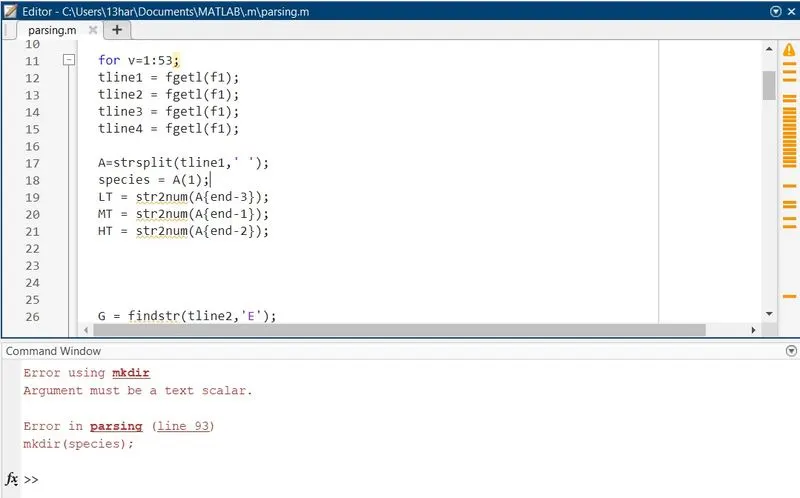
for v=1:53;
tline1 = fgetl(f1);
tline2 = fgetl(f1);
tline3 = fgetl(f1);
tline4 = fgetl(f1);
A=strsplit(tline1,' ');
species = A{1};
LT = str2num(A{end-3});
MT = str2num(A{end-1});
HT = str2num(A{end-2});
G = findstr(tline2,'E');
a1=tline2(1:G(1)+3);
a1=str2num(a1);
a2=tline2(G(1)+4:G(2)+3);
a2=str2num(a2);
a3=tline2(G(2)+4:G(3)+3);
a3=str2num(a3);
a4=tline2(G(3)+4:G(4)+3);
a4=str2num(a4);
a5=tline2(G(4)+4:G(5)+3);
a5=str2num(a5);
H = findstr(tline3,'E');
a6=tline3(1:H(1)+3);
a6=str2num(a6);
a7=tline3(H(1)+4:G(2)+3);
a7=str2num(a7);
a8=tline3(H(2)+4:G(3)+3);
a8=str2num(a8);
a9=tline3(H(3)+4:G(4)+3);
a9=str2num(a9);
a10=tline3(H(4)+4:G(5)+3);
a10=str2num(a10);
K = findstr(tline4,'E');
a11=tline4(1:K(1)+3);
a11=str2num(a11);
a12=tline4(K(1)+4:G(2)+3);
a12=str2num(a12);
a13=tline4(K(2)+4:G(3)+3);
a13=str2num(a13);
a14=tline4(K(3)+4:G(4)+3);
a14=str2num(a14);
R=8.314;
T = linspace(LT,HT,500);
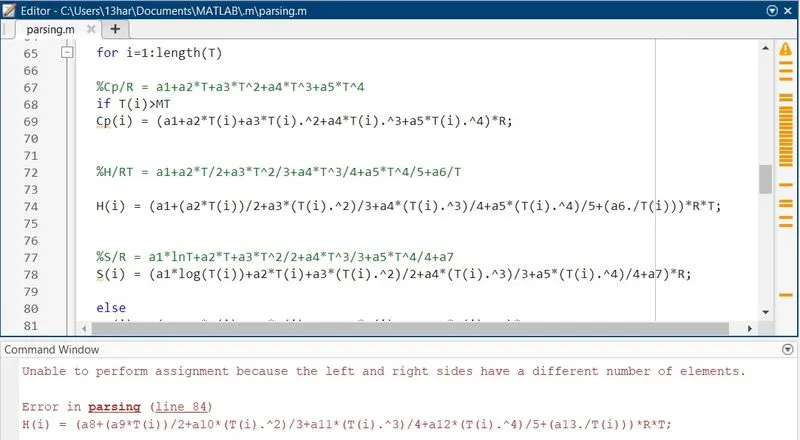
for i=1:length(T)
%Cp/R = a1+a2*T+a3*T^2+a4*T^3+a5*T^4
if T(i)>MT
Cp(i) = (a1+a2*T(i)+a3*T(i).^2+a4*T(i).^3+a5*T(i).^4)*R;
%H/RT = a1+a2*T/2+a3*T^2/3+a4*T^3/4+a5*T^4/5+a6/T
H(i) = (a1+(a2*T(i))/2+a3*(T(i).^2)/3+a4*(T(i).^3)/4+a5*(T(i).^4)/5+(a6./T(i)))*R*T(i);
%S/R = a1*lnT+a2*T+a3*T^2/2+a4*T^3/3+a5*T^4/4+a7
S(i) = (a1*log(T(i))+a2*T(i)+a3*(T(i).^2)/2+a4*(T(i).^3)/3+a5*(T(i).^4)/4+a7)*R;
else
Cp(i) = (a8+a9*T(i)+a10*T(i).^2+a11*T(i).^3+a12*T(i).^4)*R;
H(i) = (a8+(a9*T(i))/2+a10*(T(i).^2)/3+a11*(T(i).^3)/4+a12*(T(i).^4)/5+(a13./T(i)))*R*T(i);
S(i) = (a8*log(T(i))+a9*T(i)+a10*(T(i).^2)/2+a11*(T(i).^3)/3+a12*(T(i).^4)/4+a14)*R;
end
end
foldername = [species];
mkdir(species);
cd(species);
figure(1);
plot(T,Cp);
xlabel('Temperature');
ylabel('Specific heat');
title('CpvsT')
F=getframe(gcf);
imwrite(F.cdata,'CpvsT.jpg')
figure(2);
plot(T,H);
xlabel('Temperature');
ylabel('Enthalpy');
title('HvsT');
F=getframe(gcf);
imwrite(F.cdata,'HvsT.jpg')
figure(3);
plot(T,S);
xlabel('Temperature');
ylabel('Entropy');
title('SvsT');
F=getframe(gcf);
imwrite(F.cdata,'SvsT.jpg')
cd ..
Atoms = ['H','C','N','O','A'];
Atomic_weight = [1.008 12.011 14.007 15.999 39.948];
mol_wt = 0;
for i = 1:length(species)
for k=1:length(Atoms)
if strcmp(species(i),Atoms(k))
mol_wt = mol_wt+Atomic_weight(k);
x = k;
end
end
d=str2double(species(i));
if d>1
mol_wt=mol_wt+Atomic_weight(x)*(d-1);
end
end
sprintf("Mol wt of %s:%f",species,mol_wt)
end
fclose(f1);
DETAILED REPORT OF PROGRAM LOGIC & STEPWISE EXPLANATION OF CODE
Step 1
We open the file THERMO.DAT (given in the challenge) and read the data using fopen command.
fopen command
fopen command is used to create a new file and add/write content in the file.
Eg: f1 = fopen('filename','w') -
'f1'- fileID, filename' - to open the new file to be created, 'w' - writing access given to add content to the file.
fopen command is also used to open the existing file and read the content from the file.
Eg: f1 = fopen('filename','r')
'f1'- fileID, 'filename' - to open the existing file to be read, 'r' - reading access to read the content of the file.
f1 - fileID returns a numerical once the program is executed. f1 returns a value >= 3 if the file is opened and returns -1 if the file is not opened.
For the file to open, the file should be located in the same directory as the program file.
Step 2
To read the data from the file that is relevant or as asked in the challenge - Species names, Local temperatures and Coefficients of each species. Data can be read using 'fgetl' command.
The first five lines from the file are not relevant to our program. Therefore, 'for' loop is used to read all the five lines instead of typing 'fgetl' five times.
fgetl command
fgetl command is used to read lines from the file. This command reads one line at a time. Everytime we type this command, it reads a new line or next line.
Eg: tline0=fgetl(f1) ---- reads first line
tline1=fgetl(f1) ---- reads second line
--------------------
--------------------
--------------------
tlinen=fgetl(f1) ---- reads nth line
'f1' - fileId of the file from which the data is read.
Step 3
There are a total number of 53 species in the file. The local temperatures and coefficients are to be extracted for each species to calculate specific heat, enthalpy and entropy. 'for' loop is initiated for a number of 53 iterations to read the data of all species.
Each species data is contained in four lines. Therefore, fgetl command is used four times (one for each line). tline1, tline2, tline3 and tline4 will read the lines of one species in the program. tline1 reads the line that contains species name and local temperatures. tline2,3 and 4 reads the lines that contains coefficients. Here, read lines are considered as string or character vector.
Species name & local temperature data extraction
To locate or extract the particular element from the line, the line should be in the form of an array or a vector so that each element can be located with an index. strsplit command is used on tline1 to split the string into a cell array. We obtain a cell array of size 1x9.
Cell array - each element in the cell array is a cell and can be any data type.
A = strsplit(tline1,' ') -(refer program for this statement)
- space in quotes is used as a delimiter to separate elements and forms a cell array.
From the cell array A, species name and local temperatures are extracted using cell array indexing. The data extracted is still in the form of string. Therefore, the local temperatures are converted to numeric array so that they will be compatible for arithmetic operations.
Coefficients extraction
For tline2,3 and 4, strsplit operation is not feasible due to absence of proper delimiter between coefficients. Therefore, findstr command is used to index and locate the coefficients. The line remains as a character vector, therefore, coefficients are located using character vector indexing. After indexing, str2num operation is applied on the coefficients to convert them to numerals for arithmetic operations.
The code from the program is as follows
G = findstr(tline2,'E'); locating ‘E’ in the line
a1=tline2(1:G(1)+3); - locating the coefficient using character vector indexing
a1=str2num(a1); - conversion to numeral
Repeat the same procedure for remaining 13 coefficients.
Step 4
Calculation of Cp,H and S using the following polynomial equations
1) Cp/R = a1+a2*T+a3*T^2+a4*T^3+a5*T^4
2) H/RT = a1+a2*T/2+a3*T^2/3+a4*T^3/4+a5*T^4/5+a6/T
3) S/R = a1*lnT+a2*T+a3*T^2/2+a4*T^3/3+a5*T^4/4+a7
a1 to a7 are high temperature coefficients, a8 to a14 are low temperature coefficients.
R – Universal gas contant = 8.314J/mol/K
T = linspace(LT,HT,500) – generated a range of 500 values for temperature from LT to HT for good accuracy of plots.
Low temperature coefficients are used in the equations for temperatures below MT and high temperature coefficients above MT. ‘if’ ‘else’ condition statements are used to calculate and generate Cp, H and S vectors.
‘if’ condition is used to check T value with MT,if it is greater than MT, then it will solve the equations using high temperature coefficients, ‘else’ it will solve the equations using low temperature coefficients.
Step 5
Creation of folder
A folder is created for each species with its name and variation of Cp,H and S of that species w.r.t local temperatures are plotted and saved in that folder.
The folder name is given name species, it is a variable assigned to species name in the file.
species = A{1} (from the program)
As the program is executed, the folder name ‘species’ will be replaced by actual species name.
mkdir command is used to create folder – mkdir(foldername)
mkdir(species) – species is the folder name given
cd command is used to change current folder to new folder in which the plots are saved –
cd – displays the current folder, cd(newfolder) – displays change of current folder to new folder.
cd(species) represents change of current folder to new folder species in which the plots are to be saved.
Saving the plots as image files in the folder
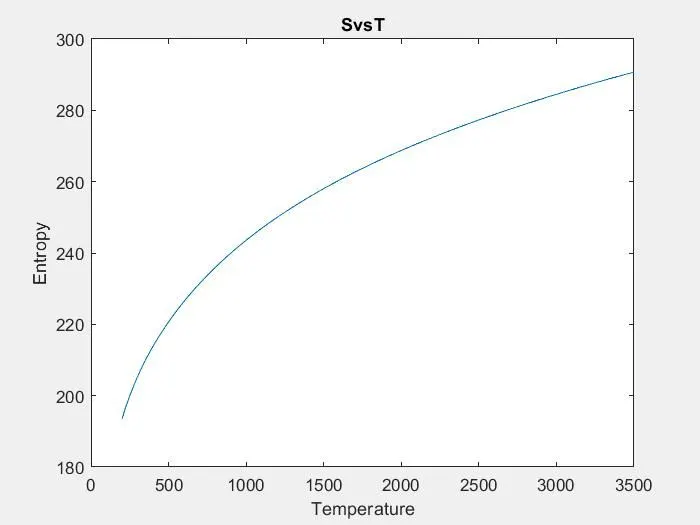
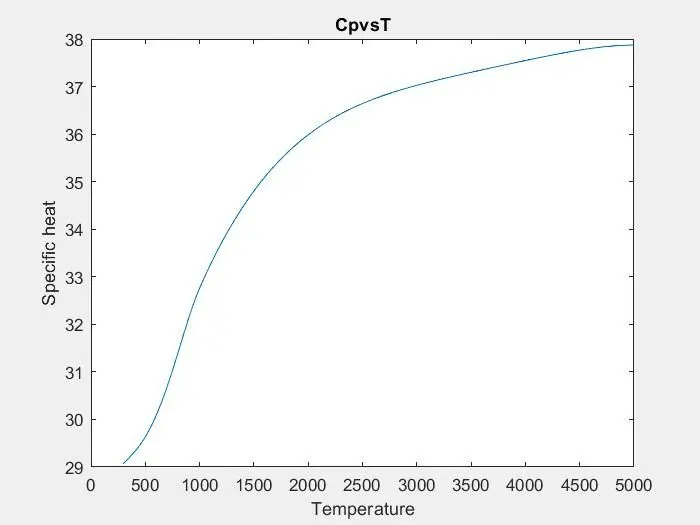
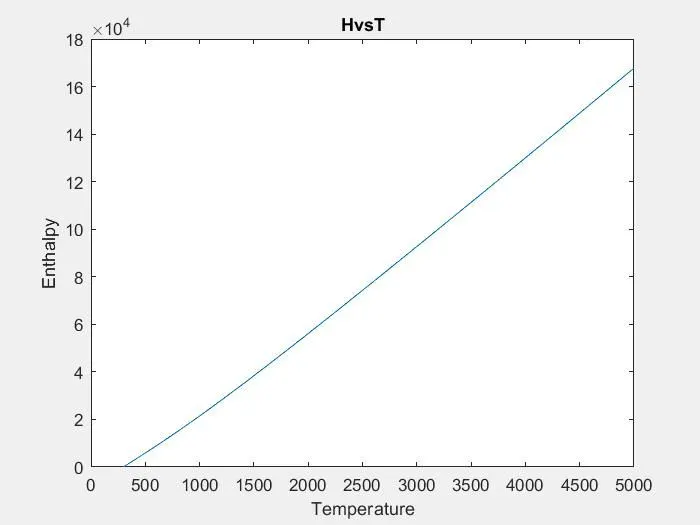
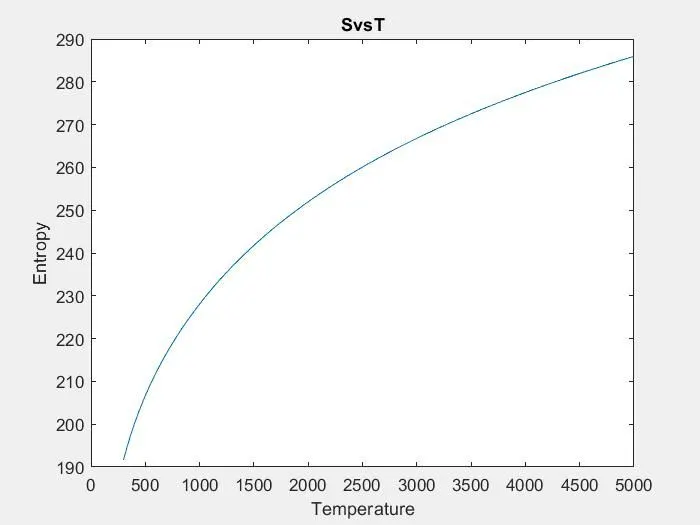
Plot CpvsT, HvsT and SvsT for the species
getframe command with gcf as input argument is used for plot. This action will capture the figure (that contains the plot) as a whole(axes,plot,labels&title) and save the figure as an image data. The image data is written onto a file using imwrite command saved as a jpg file.
F=getframe(gcf);
imwrite(F.cdata,'CpvsT.jpg')
Cdata is the image color data.
Repeat the same procedure for remaining plots
cd.. command is used to save the image files in the folder ‘species’
Step 6
Calculation of molecular weight
To calculate molecular weight of all the species, atoms and respective atomic weights vectors are created. The position of a particular atom in atoms vector matches with the position of the atomic weight in the atomic weight vector. A nested for loop is created, one is initiated for the entire length of species vector and another for loop for the length of atoms vector. For each species, the program runs 5 iterations i.e, for all atoms. ‘strcmp’(string comparison) command is used to check whether the string of each element of atoms vector matches with the string of species name from the file. If it matches, the molecular weight of the species will be calculated. Molecular weight will be calculated tmol_wt = mol_wt+Atomic_weight(k); ---- eqn1
If the species contains more than one molecule, ‘str2double’ command is used to convert species name to number and if d>1 (from the program), the molecular weight is calculated using the following equation.
mol_wt=mol_wt+Atomic_weight(x)*(d-1); --- eqn2
The atomic weight position is the position recorded after calculation of molecular weight in the previous equation i.e., x = k; (from the program)
sprintf("Mol wt of %s:%f",species,mol_wt) – returns the output with species name and molecular weight. %s – format specifier for string (species), %f- format specifier for floating point numbers(mol_wt)
Step 7
Output of the program and Closing of the file
The program runs for 53 iterations, one for each species. The output of the program generates 53 folders of different species and saves the plots generated for each species in their respective folders. It also displays the molecular weight of each species in the command window.
fclose(f1)-closes the opened file